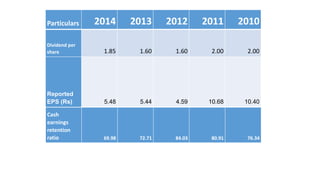
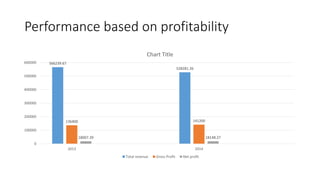
The document analyzes the financial performance of Voltas over several years. It examines the company's liquidity, turnover, profitability, and overall performance. Key points:
- The company's current and quick ratios show adequate liquidity to meet short-term obligations. Inventories and receivables decreased from prior years.
- Inventory turnover and debtors' turnover ratios remained relatively stable from 2013-2014. Creditors' turnover saw a small increase.
- Gross and net profit margins declined from 2010-2014 despite expenses decreasing from 2013-2014. Dividends per share and earnings per share increased.
- Overall, the company's performance has been positive based on stable profitability, increased shareholders' returns
4. Particulars Mar ‘14 Mar ‘13 Mar ‘12 Mar ‘11 Mar ‘10
Current Ratio 1.39 1.35 1.41 1.32 1.24
•The Current ratio in the year 2012-13 was 1.35 while in the year 2013-14 it increased
to 1.39
•It shows that the Current Assets in 2013-14 have increased in proportion to the
Current Liabilities
•Investments in the Mar’14 have increased from 26803 to 59271. It shows that the
company is planning for expansion
•Inventories have decreased from 83273.77 to 71532.67. It depicts the efficient
inventory management technique of the company. The company predicts its future
sales and thus maintains the stock
•Trade Receivables have decreased from 116826 to 105906. It shows the effective
collection policy of he management of the company since the total receivables have
decreased.
•The current liabilities have remain pretty much constant over the years.
5. Particulars Mar ‘14 Mar ‘13 Mar ‘12 Mar ‘11 Mar ‘10
Quick Ratio 1.02 0.94 1.06 0.99 .70
•The massive decline in quick ratio in comparison to current ratio shows that the Company has a
good amount of stock and prepaid expenses. It is not a good sign for the company since this
amounts invested in these goods can be put to better use to generate revenue
•Despite the presence of large amount of stock the ratio is ideal i.e. 1:1. It means that the
company’s resources are enough to meet its current liabilities.
•The Acid Test Ratio depicts the same liquidity position of the company.
7. Inventory Turnover Ratio
1) The inventory turnover ratio is the ratio of Sales and Average
Stock. It’s a ratio showing how many times a company’s inventory is
sold and replaced.
2) In 2013, it was 6.68 whereas in 2014 it was 7.20.
3) The reason behind this fall could be the sharp fall in Sales from
Rupees 556543.2 lakhs to Rupees 515135.7 lakhs and the decrease
in inventory.
4) This fall of Rupees 41,407.5 lakhs is the main reason behind the
decrease in Inventory Turnover Ratio.
8. Debtors Turnover Ratio
1) The Debtors Turnover Ratio is the ratio of Credit Sales and Average
Debtors. It measures a firm’s capability in extending credit and
collecting debts.
2) In 2013, it was 4.76 and in 2014 it was 4.86. Thus we can clearly say
that there has not been a noticeable change in the ratio. This is
mainly due to the reason that Average Debtors has witnessed only a
change of 10,920 hence not affecting the ratio drastically.
9. Creditors Turnover Ratio
1) The Creditors Turnover Ratio of Purchases and Average Payable. It is
a ratio which ascertains the speed at which the company pays off
it’s suppliers.
2) In 2013, it was 1.13 and in 2014 it was 1.33. Such a tiny difference
may be due to the reason that in 2013 Trade Payables amounted at
Rupees 152576.46 lakhs and in 2014 Rupees 146103.02 which is a
marginal difference.
3) Hence not bringing a big change in the ratio over the two years.
11. Operating
margin
(%) 3.17 3.47 5.84 8.75 9.14
2014 2013 2012 2011 2010
• The operating margin is decreasing since 2010 -2014
• The revenue from operations of voltas is decreased from
2013-2014, by Rs.556543.2 – Rs. 515135.7
12. Gross
profit
margin (%) 2.81 3.07 5.28 8.43 8.78
Net profit
margin (%) 3.43 3.18 2.87 6.77 7.45
• Gross profit decreases since 2010-2014. Wheras
• The net profit is increased since 2010-2014
• Expenses being decreased from 2013- 2014
15. Pricing relative to 10 year average P/E ratio
• Last 3 Years Average EPS x Last 10 Years Average P/E Ratio
• Voltas’s average P/E ratio for the past 10 years has been around 12
times, while its last 3 years’ average EPS has been Rs 10 per share.
Based on the formula, Voltas’s intrinsic value is coming to around Rs
121 per share.
16. Graham number
• As per this rule, the product of a stock’s price to earnings (P/E) and
price to book value (P/BV) should not be more than 22.5.
• Fair Value Price = Square Root of (22.5 x EPS x BVPS)
• Applying this formula, Voltas’s intrinsic value comes to around Rs 100
per share
17. Dividend discount model
• Intrinsic value = Dividend per share/(Discount rate – Dividend
Growth Rate)
Given that Voltas has paid higher dividends over the years, we use
this ‘dividend growth’ formula for calculating the stock’s intrinsic
value.
• Assuming a discount rate of 15%, dividend growth rate of 12%, and
the latest dividend of Rs 2 per share, and inputting these numbers in
the above DDM formula, we get to an intrinsic value of Rs 67.
18.
19.
20. Tangible Assets
• Tangible Assets have decreased by 151705 (YoY) or 90% which means
that the company has sold an asset, partially shows the effect of
depreciation.
• It looks like the company has used the money from the sale to
increase current investment which inc by 32,467.5 or 121%
• The company may have also used the money to reduce current
liabilities.
21. Other current liability
• Other current liability has increased by 2624 (YoY) or 4.8%. The
increase may be due to the fact that the company decided to
purchase other current assets from other current liabilities.
• Other current assets have risen by 2488 YoY or 4.01%
22. Share Capital
• The share capital of the company shows almost no change which
means the company has not issued fresh equity.
23. Reserves and surplus
• Reserves and Surplus have increased by Rs. 11534 or 7.96% yoy.
• A possible reason could be the money transferred from the sale of
tangible asset being transferred to the reserve and surplus account
24. Capital work in progess
• Capital work in Progress has increased dramatically from 0.5 to 177
which is a change of 34005% yoy.
• This shows that the company has increased its order pipeline and it
has got more contracts.
25. Company’s Overall performance
• Performance on the basis of Profitability
• Performance on the basis of Shareholder’s wealth
• Performance on the basis of working capital management
26. Performance based on profitability
566239.67
528281.26
136400 141200
18007.39 18148.27
0
100000
200000
300000
400000
500000
600000
2013 2014
Chart Title
Total revenue Gross Profit Net profit
27. Reasons for decrease in Total revenue
• Decrease in revenue from operations
• Though, the increase in other income is not enough to improve the
Total revenue.
28. Decrease in revenue from operations
561800.39
518816.67
323257.5
352333.97
237293.96
164751.87
0
100000
200000
300000
400000
500000
600000
2013 2014
Chart Title
Total revenue from operations Sales contract revenue
Contracts of Voltas: Burj Khalifa at
Dubai; the F1 track and Ferrari
World at Abu Dhabi; one of the
world’s biggest water treatment
plants at Singapore and the new
Sidra Medical and Research Centre
at Qatar.
29. Increase in Other Income.
0
2000
4000
6000
8000
10000
12000
14000
2013 2014
9696.49
13145.58
3246.28
6314.38
Chart Title
Total other income Dividend income Column1
Reason: Rohini Industrial
electricals
Saudi Ensas Co. for engineering
services
30. Reason for increase in Gross profit
• Decrease in Cost of goods sold or cost of sales due to various
technology improvements and technological contracts and increase in
R&D expenditure.
• Cost of Sales: 2013- 84071.09 2014-50249.78
• The operating profit is also increased by 11.09% due to a decrease in
staff expenses i.e., the salaries due to the expiration or maturity of
the contract employees.
31. Reasons for increase in Net profit
• Decrease in cost of materials consumed.
• Decrease in the employee benefit expenses.
• The decrease in the inventory to 11579 from a negative of 6648.49 is
the reason for mere increase.
33. Contd..
• The company issued 15.6% more than the previously issued dividend.
• The adjusted earning per share is increased by 0.40 per share
compared to previous year
34. Performance on the basis of working capital
management
• The current assets of the company are mainly financed from the
shareholder’s funds.
• The working capital of the company has increased by 8156.04i.e.,
9.54% increase.
• Therefore, the liquidity position of the company is satisfactory.