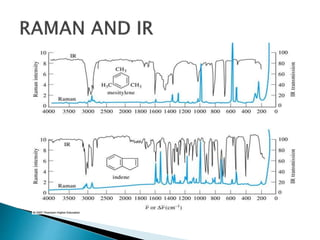
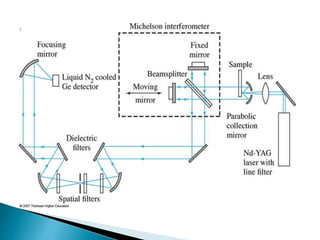
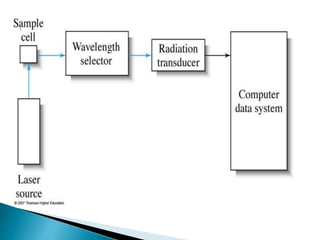
Raman spectroscopy and infrared spectroscopy are similar techniques for analyzing molecular vibrations, but they differ in their operating principles. Raman spectroscopy analyzes the scattering of monochromatic light, such as a laser, while infrared spectroscopy analyzes light absorption. Raman spectroscopy can be used to analyze aqueous solutions because water is a weak Raman scatterer, whereas water strongly absorbs infrared light. Both techniques provide information about molecular structure through vibrational fingerprints, but Raman spectroscopy has advantages for certain applications due to its ability to analyze solutions and its high sensitivity.
Raman Spectroscopy is a non destructive chemical analysis technique which provides detailed information about chemical structure, crystallinity and molecular interactions. The raman effect involves scattering of light by molecules of gases, liquids, or solids. Raman Spectroscopy is sensitive to homo-nuclear molecular bonds. It is able to distinguish between single, double, and triple bonds between carbon atoms.Raman spectroscopy is the study of matter by the inelastic scattering of monochromatic
light. It has become a ubiquitous tool in modern spectroscopy, biophysics, microscopy, geochemistry, and analytical chemistry. In contrast to typical absorption or emission spectroscopy experiments, transitions among quantum levels of atoms or molecules are induced by the absorption or emission of photons (IR, visible, UV). In a typical Raman experiment, a polarized monochromatic light source (usually a laser) is focused into a sample, and the scattered light at 90 degree
to the laser beam is collected and dispersed by a high-resolution monochromator. The incident laser wavelength (chosen such that
the sample does not absorb, in ordinary Raman Spectroscopy) is fixed, and the scattered light is
dispersed and detected to obtain the frequency spectrum of the scattered light. The scattered light is very weak
(<10-7 of the incident power), so that monochromators with excellent straylight rejection and sensitive detectors are required. In a much rarer event (approximately 1 in 10million photons)Raman scattering occurs, which is an inelastic scattering process with a transfer of energy between the molecule and scattered photon. If the molecule gains energy from the photon during the scattering (excited to a higher
vibrational level) then the scattered photon loses energy and its wavelength increases which is called Stokes Raman scattering . Inversely, if the molecule loses energy by relaxing to alower vibrational level the scattered photon gains thecorresponding energy and its wavelength decreases;
which is called Anti-Stokes Raman scattering. • Quantum mechanically Stokes and Anti-Stokes areequally likely processes. However, with an ensemble of molecules, the majority of molecules will be in the ground vibrational level (Boltzmann distribution) and Stokes scatter is the statistically more probable process. As a result, the Stokes Raman scatter is always more intense than the anti-Stokes and for this
reason, it is nearly always the Stokes Raman scatter that is measured in Raman spectroscopy. Raman spectroscopy is used in chemistry to identify molecules and study chemical bonding and intramolecular bonds.In solid-state physics, Raman spectroscopy is used to characterize materials, measure temperature, and find the crystallographic orientation of a sample . In nanotechnology, a Raman microscope can be used to analyze nanowires to better understand their structures, and the radial breathing mode of carbon nanotubes is commonly used to evaluate their diameter.
Although the inelastic scattering of light was predicted by Adolf Smekal in 1923, it was not observed in practice until 1928. The Raman effect was named after one of its discoverers, the Indian scientist C. V. Raman, who observed the effect in organic liquids in 1928 together with K. S. Krishnan, and independently by Grigory Landsberg and Leonid Mandelstam in inorganic crystals. Raman won the Nobel Prize in Physics in 1930 for this discovery. The first observation of Raman spectra in gases was in 1929 by Franco Rasetti.
Raman spectroscopy.pptx M Pharm, M Sc, Advanced Spectral AnalysisDiwakar Mishra
Raman Spectroscopy is included in the syllabus Advanced Spectral Analysis (Pharmaceutical Chemistry) which discribes the principle and working of Raman Spectroscopy.
What is greenhouse gasses and how many gasses are there to affect the Earth.moosaasad1975
What are greenhouse gasses how they affect the earth and its environment what is the future of the environment and earth how the weather and the climate effects.
Richard's aventures in two entangled wonderlandsRichard Gill
Since the loophole-free Bell experiments of 2020 and the Nobel prizes in physics of 2022, critics of Bell's work have retreated to the fortress of super-determinism. Now, super-determinism is a derogatory word - it just means "determinism". Palmer, Hance and Hossenfelder argue that quantum mechanics and determinism are not incompatible, using a sophisticated mathematical construction based on a subtle thinning of allowed states and measurements in quantum mechanics, such that what is left appears to make Bell's argument fail, without altering the empirical predictions of quantum mechanics. I think however that it is a smoke screen, and the slogan "lost in math" comes to my mind. I will discuss some other recent disproofs of Bell's theorem using the language of causality based on causal graphs. Causal thinking is also central to law and justice. I will mention surprising connections to my work on serial killer nurse cases, in particular the Dutch case of Lucia de Berk and the current UK case of Lucy Letby.
THE IMPORTANCE OF MARTIAN ATMOSPHERE SAMPLE RETURN.Sérgio Sacani
The return of a sample of near-surface atmosphere from Mars would facilitate answers to several first-order science questions surrounding the formation and evolution of the planet. One of the important aspects of terrestrial planet formation in general is the role that primary atmospheres played in influencing the chemistry and structure of the planets and their antecedents. Studies of the martian atmosphere can be used to investigate the role of a primary atmosphere in its history. Atmosphere samples would also inform our understanding of the near-surface chemistry of the planet, and ultimately the prospects for life. High-precision isotopic analyses of constituent gases are needed to address these questions, requiring that the analyses are made on returned samples rather than in situ.
Observation of Io’s Resurfacing via Plume Deposition Using Ground-based Adapt...Sérgio Sacani
Since volcanic activity was first discovered on Io from Voyager images in 1979, changes
on Io’s surface have been monitored from both spacecraft and ground-based telescopes.
Here, we present the highest spatial resolution images of Io ever obtained from a groundbased telescope. These images, acquired by the SHARK-VIS instrument on the Large
Binocular Telescope, show evidence of a major resurfacing event on Io’s trailing hemisphere. When compared to the most recent spacecraft images, the SHARK-VIS images
show that a plume deposit from a powerful eruption at Pillan Patera has covered part
of the long-lived Pele plume deposit. Although this type of resurfacing event may be common on Io, few have been detected due to the rarity of spacecraft visits and the previously low spatial resolution available from Earth-based telescopes. The SHARK-VIS instrument ushers in a new era of high resolution imaging of Io’s surface using adaptive
optics at visible wavelengths.
(May 29th, 2024) Advancements in Intravital Microscopy- Insights for Preclini...Scintica Instrumentation
Intravital microscopy (IVM) is a powerful tool utilized to study cellular behavior over time and space in vivo. Much of our understanding of cell biology has been accomplished using various in vitro and ex vivo methods; however, these studies do not necessarily reflect the natural dynamics of biological processes. Unlike traditional cell culture or fixed tissue imaging, IVM allows for the ultra-fast high-resolution imaging of cellular processes over time and space and were studied in its natural environment. Real-time visualization of biological processes in the context of an intact organism helps maintain physiological relevance and provide insights into the progression of disease, response to treatments or developmental processes.
In this webinar we give an overview of advanced applications of the IVM system in preclinical research. IVIM technology is a provider of all-in-one intravital microscopy systems and solutions optimized for in vivo imaging of live animal models at sub-micron resolution. The system’s unique features and user-friendly software enables researchers to probe fast dynamic biological processes such as immune cell tracking, cell-cell interaction as well as vascularization and tumor metastasis with exceptional detail. This webinar will also give an overview of IVM being utilized in drug development, offering a view into the intricate interaction between drugs/nanoparticles and tissues in vivo and allows for the evaluation of therapeutic intervention in a variety of tissues and organs. This interdisciplinary collaboration continues to drive the advancements of novel therapeutic strategies.
Slide 1: Title Slide
Extrachromosomal Inheritance
Slide 2: Introduction to Extrachromosomal Inheritance
Definition: Extrachromosomal inheritance refers to the transmission of genetic material that is not found within the nucleus.
Key Components: Involves genes located in mitochondria, chloroplasts, and plasmids.
Slide 3: Mitochondrial Inheritance
Mitochondria: Organelles responsible for energy production.
Mitochondrial DNA (mtDNA): Circular DNA molecule found in mitochondria.
Inheritance Pattern: Maternally inherited, meaning it is passed from mothers to all their offspring.
Diseases: Examples include Leber’s hereditary optic neuropathy (LHON) and mitochondrial myopathy.
Slide 4: Chloroplast Inheritance
Chloroplasts: Organelles responsible for photosynthesis in plants.
Chloroplast DNA (cpDNA): Circular DNA molecule found in chloroplasts.
Inheritance Pattern: Often maternally inherited in most plants, but can vary in some species.
Examples: Variegation in plants, where leaf color patterns are determined by chloroplast DNA.
Slide 5: Plasmid Inheritance
Plasmids: Small, circular DNA molecules found in bacteria and some eukaryotes.
Features: Can carry antibiotic resistance genes and can be transferred between cells through processes like conjugation.
Significance: Important in biotechnology for gene cloning and genetic engineering.
Slide 6: Mechanisms of Extrachromosomal Inheritance
Non-Mendelian Patterns: Do not follow Mendel’s laws of inheritance.
Cytoplasmic Segregation: During cell division, organelles like mitochondria and chloroplasts are randomly distributed to daughter cells.
Heteroplasmy: Presence of more than one type of organellar genome within a cell, leading to variation in expression.
Slide 7: Examples of Extrachromosomal Inheritance
Four O’clock Plant (Mirabilis jalapa): Shows variegated leaves due to different cpDNA in leaf cells.
Petite Mutants in Yeast: Result from mutations in mitochondrial DNA affecting respiration.
Slide 8: Importance of Extrachromosomal Inheritance
Evolution: Provides insight into the evolution of eukaryotic cells.
Medicine: Understanding mitochondrial inheritance helps in diagnosing and treating mitochondrial diseases.
Agriculture: Chloroplast inheritance can be used in plant breeding and genetic modification.
Slide 9: Recent Research and Advances
Gene Editing: Techniques like CRISPR-Cas9 are being used to edit mitochondrial and chloroplast DNA.
Therapies: Development of mitochondrial replacement therapy (MRT) for preventing mitochondrial diseases.
Slide 10: Conclusion
Summary: Extrachromosomal inheritance involves the transmission of genetic material outside the nucleus and plays a crucial role in genetics, medicine, and biotechnology.
Future Directions: Continued research and technological advancements hold promise for new treatments and applications.
Slide 11: Questions and Discussion
Invite Audience: Open the floor for any questions or further discussion on the topic.
Deep Behavioral Phenotyping in Systems Neuroscience for Functional Atlasing a...Ana Luísa Pinho
Functional Magnetic Resonance Imaging (fMRI) provides means to characterize brain activations in response to behavior. However, cognitive neuroscience has been limited to group-level effects referring to the performance of specific tasks. To obtain the functional profile of elementary cognitive mechanisms, the combination of brain responses to many tasks is required. Yet, to date, both structural atlases and parcellation-based activations do not fully account for cognitive function and still present several limitations. Further, they do not adapt overall to individual characteristics. In this talk, I will give an account of deep-behavioral phenotyping strategies, namely data-driven methods in large task-fMRI datasets, to optimize functional brain-data collection and improve inference of effects-of-interest related to mental processes. Key to this approach is the employment of fast multi-functional paradigms rich on features that can be well parametrized and, consequently, facilitate the creation of psycho-physiological constructs to be modelled with imaging data. Particular emphasis will be given to music stimuli when studying high-order cognitive mechanisms, due to their ecological nature and quality to enable complex behavior compounded by discrete entities. I will also discuss how deep-behavioral phenotyping and individualized models applied to neuroimaging data can better account for the subject-specific organization of domain-general cognitive systems in the human brain. Finally, the accumulation of functional brain signatures brings the possibility to clarify relationships among tasks and create a univocal link between brain systems and mental functions through: (1) the development of ontologies proposing an organization of cognitive processes; and (2) brain-network taxonomies describing functional specialization. To this end, tools to improve commensurability in cognitive science are necessary, such as public repositories, ontology-based platforms and automated meta-analysis tools. I will thus discuss some brain-atlasing resources currently under development, and their applicability in cognitive as well as clinical neuroscience.
2. Raman Spectroscopy
When radiation passes through a transparent medium, the
species present scatter a fraction of the beam in all
directions. In 1928, the Indian physicist C. V. Raman
discovered that the visible wavelength of a small fraction
of the radiation scattered by certain molecules differs from
that of the incident beam and furthermore that the shifts in
wavelength depend upon the chemical structure of the
molecules responsible for the scattering.
3. The theory of Raman scattering shows that
the phenomenon results from the same type
of quantized vibrational changes that are
associated with infrared absorption. Thus,
the difference in wavelength between the
incident and scattered visible radiation
corresponds to wavelengths in the mid-
infrared region. The Raman scattering
spectrum and infrared absorption spectrum
for a given species often resemble one
another quite closely.
4. An important advantage of Raman spectra over
infrared lies in the fact that water does not cause
interference; indeed, Raman spectra can be obtained
from aqueous solutions. Hence, water can be used
as a solvent in Raman spectroscopy because is a
weak Raman scatterer which means that samples can
be analyzed in their aqueous form, which is highly
beneficial to the pharmaceutical industry. Water
cannot be used in IR due to its intense absorption of
IR. In addition, glass or quartz cells can be
employed, thus avoiding the inconvenience of
working with sodium chloride or other
atmospherically unstable window materials
5. THEORY OF RAMAN SPECTROSCOPY
Raman spectra are acquired by irradiating a
sample with a powerful laser source of visible
or near-infrared monochromatic radiation.
During irradiation, the spectrum of the scattered
radiation is measured at some angle (often 90
deg) with a suitable spectrometer. At the very
most, the intensities of Raman lines are % of the
intensity of the source; as a consequence, their
detection and measurement are somewhat more
difficult than are infrared spectra.
6. Excitation of Raman Spectra
A Raman spectrum can be obtained by
irradiating a sample of carbon tetrachloride
(Fig 18-2) with an intense beam of an argon
ion laser having a wavelength of nm
(20492 cm-1). The emitted radiation is of
three types: 1. Stokes scattering
2. Anti-stokes scattering
3. Rayleigh scattering
7.
8. The abscissa of Raman spectrum is the wavenumber shift
∆ν, which is defined as the difference in wavenumbers
(cm-1) between the observed radiation and that of the
source. For CCl4 three peaks are found on both sides of
the Rayleigh peak and that the pattern of shifts on each
side is identical (Fig. 18-2). Anti-Stokes lines are
appreciably less intense that the corresponding Stokes
lines. For this reason, only the Stokes part of a spectrum
is generally used. The magnitude of Raman shifts are
independent of the wavelength of excitation. ( ν =C/λ)
9.
10. Mechanism of Raman and Rayleigh
Scattering
The heavy arrow on the far left depicts the
energy change in the molecule when it
interacts with a photon. The increase in
energy is equal to the energy of the photon
hν. The second and narrower arrow shows
the type of change that would occur if the
molecule is in the first vibrational level of
the electronic ground state.
11. Mechanism of Raman and Rayleigh Scattering
The middle set of arrows depicts the changes
that produce Rayleigh scattering. The energy
changes that produce stokes and anti-Stokes
emission are depicted on the right. The two
differ from the Rayleigh radiation by
frequencies corresponding to ±∆E, the energy of
the first vibrational level of the ground state. If
the bond were infrared active, the energy of its
absorption would also be ∆E. Thus, the Raman
frequency shift and the infrared absorption peak
frequency are identical.
12.
The relative populations of the two upper energy
states are such that Stokes emission is much
favored over anti-Stokes. Rayleigh scattering
has a considerably higher probability of
occurring than Raman because the most
probable event is the energy transfer to
molecules in the ground state and reemission by
the return of these molecules to the ground state.
The ratio of anti-Stokes to Stokes intensities will
increase with temperature because a larger
fraction of the molecules will be in the first
vibrationally excited state under these
circumstances.
13. RAMAN VS. I.R
For a given bond, the energy shifts observed in a Raman
experiment should be identical to the energies of its
infrared absorption bands, provided that the vibrational
modes involved are active toward both infrared
absorption and Raman scattering. The differences
between a Raman spectrum and an infrared spectrum are
not surprising. Infrared absorption requires that a
vibrational mode of the molecule have a change in dipole
moment or charge distribution associated with it
14.
15. In contrast, scattering involves a momentary
distortion of the electrons distributed
around a bond in a molecule, followed by
reemission of the radiation as the bond
returns to its normal state. In its distorted
form, the molecule is temporarily polarized;
that is, it develops momentarily an induced
dipole that disappears upon relaxation and
reemission. The Raman activity of a given
vibrational mode may differ markedly from
its infrared activity
16. INTENSITY OF NORMAL RAMAN PEAKS
The intensity or power of a normal Raman peak
depends in a complex way upon the
polarizability of the molecule, the intensity of
the source, and the concentration of the active
group. The power of Raman emission increases
with the fourth power of the frequency of the
source; however, advantage can seldom be
taken of this relationship because of the
likelihood that ultraviolet irradiation will cause
photodecomposition. Raman intensities are
usually directly proportional to the
concentration of the active species
17. RAMAN DEPOLARIZATION RATIOS
Polarization is a property of a beam of
radiation and describes the plane in which
the radiation vibrates. Raman spectra are
excited by plane-polarized radiation. The
scattered radiation is found to be polarized to
various degrees depending upon the type of
vibration responsible for the scattering.
18.
19. The depolarization ratio p is defined as
Experimentally, the depolarization ratio
may be obtained by inserting a polarizer
between the sample and the
monochromatic. The depolarization ratio
is dependent upon the symmetry of the
vibrations responsible for scattering.
20. RAMAN DEPOLARIZATION RATIOS
Polarized band: p = < 0.76 for totally
symmetric modes (A1g) Depolarized
band: p = 0.76 for B1g and B2g
nonsymmetrical vibrational modes
Anomalously polarized band: p = >
0.76 for A2g vibrational modes
21.
22.
23.
24. INSTRUMENTATION
Instrumentation for modern Raman spectroscopy
consists of three components: A laser source, a
sample illumination system and a suitable
spectrometer. Source The sources used in modern
Raman spectrometry are nearly always lasers
because their high intensity is necessary to
produce Raman scattering of sufficient intensity
to be measured with a reasonable signal-to-noise
ratio. Because the intensity of Raman scattering
varies as the fourth power of the frequency, argon
and krypton ion sources that emit in the blue and
green region of the spectrum have and advantage
over the other sources
25.
26.
27.
28. SAMPLE ILLUMINATION SYSTEM
Sample handling for Raman spectroscopic measurements
is simpler than for infrared spectroscopy because glass can
be used for windows, lenses, and other optical components
instead of the more fragile and atmospherically less stable
crystalline halides. In addition, the laser source is easily
focused on a small sample area and the emitted radiation
efficiently focused on a slit. Consequently, very small
samples can be investigated. A common sample holder for
nonabsorbing liquid samples is an ordinary glass melting-
point capillary.
29.
Liquid Samples: A major advantage of sample
handling in Raman spectroscopy compared with
infrared arises because water is a weak Raman
scatterer but a strong absorber of infrared radiation.
Thus, aqueous solutions can be studied by Raman
spectroscopy but not by infrared.
This advantage is particularly important for
biological and inorganic systems and in studies
dealing with water pollution problems.
Solid Samples: Raman spectra of solid samples are
often acquired by filling a small cavity with the
sample after it has been ground to a fine powder.
Polymers can usually be examined directly with no
sample pretreatment.
30. RAMAN SPECTROMETERS
Raman spectrometers were similar in design and used the
same type of components as the classical
ultraviolet/visible dispersing instruments. Most employed
double grating systems to minimize the spurious radiation
reaching the transducer. Photomultipliers served as
transducers. Now Raman spectrometers being marketed
are either Fourier transform instruments equipped with
cooled germanium transducers or multichannel
instruments based upon charge-coupled devices.
31.
32.
33. APPLICATIONS OF RAMAN SPECTROSCOPY
Raman Spectra of Inorganic Species The Raman
technique is often superior to infrared for
spectroscopy investigating inorganic systems because
aqueous solutions can be employed. In addition, the
vibrational energies of metal-ligand bonds are
generally in the range of 100 to 700 cm-1, a region of
the infrared that is experimentally difficult to study.
These vibrations are frequently Raman active,
however, and peaks with ∆ν values in this range are
readily observed. Raman studies are potentially useful
sources of information concerning the composition,
structure, and stability of coordination compounds.
34. BIOLOGICALAPPLICATIONS OF RAMAN SPECTROSCOPY
Raman Spectra of Organic Species Raman spectra are
similar to infrared spectra in that they have regions that
are useful for functional group detection and fingerprint
regions that permit the identification of specific
compounds. Raman spectra yield more information
about certain types of organic compounds than do their
infrared counterparts. Biological Applications of Raman
Spectroscopy Raman spectroscopy has been applied
widely for the study of biological systems.
The advantages of his technique include the small
sample requirement, the minimal sensitivity toward
interference by water, the spectral detail, and the
conformational and environmental sensitivity.
35. QUANTITATIVE APPLICATIONS
Raman spectra tend to be less cluttered with peaks than
infrared spectra. As a consequence, peak overlap in mixtures
is less likely, and quantitative measurements are simpler. In
addition, Raman sampling devices are not subject to attack
by moisture, and small amounts of water in a sample do not
interfere. Despite these advantages, Raman spectroscopy has
not yet been exploited widely for quantitative analysis. This
lack of use has been due largely to the rather high cost of
Raman spectrometers relative to that of absorption
instrumentation
36. Resonance Raman Spectroscopy
Resonance Raman scattering refers to a phenomenon in
which Raman line intensities are greatly enhanced by
excitation with wavelengths that closely approach that of
an electronic absorption peak of an analyte. Under this
circumstance, the magnitudes of Raman peaks associated
with the most symmetric vibrations are enhanced by a
factor of 102 to 106.
As a consequence, resonance Raman spectra have been
obtained at analyte concentrations as low as 10-8M.
37. RESONANCE RAMAN SPECTROSCOPY
The most important application of resonance Raman
spectroscopy has been to the study of biological
molecules under physiologically significant
conditions; that is , in the presence of water and at low
to moderate concentration levels. As an example, the
technique has been used to determine the oxidation
state and spin of iron atoms in hemoglobin and
cytochrome-c. In these molecules, the resonance
Raman bands are due solely to vibrational modes of
the tetrapyrrole chromophore. None of the other bands
associated with the protein is enhanced, and at the
concentrations normally used these bands do not
interfere as a consequence.
38. Surface-Enhanced Raman Spectroscopy (SERS)
Surface enhanced Raman spectroscopy involves
obtaining Raman spectra in the usual way on samples
that are adsorbed on the surface of colloidal metal
particles (usually silver, gold, or copper) or on
roughened surfaces of pieces of these metals. For
reasons that are not fully understood, the Raman lines of
the adsorbed molecule are often enhanced by a factor of
103 to 106. When surface enhancement is combined
with the resonance enhancement technique discussed in
the previous section, the net increase in signal intensity
is roughly the product of the intensity produced by each
of the techniques. Consequently, detection limits in the
10-9 to M range have been observed.
39. THE DISSIMILARITY BETWEEN THE RAMMAN
AND IR SPECTROSCOPY
Raman spectra result from scattering of light by vibrating
molecules whereas IR spectra result from light absorption
by vibrating molecules
Raman activity results from change of polarizability of a
molecule whereas IR activity results from changing dipole
moment
A monochromatic light beam of high intensity laser can be
used in UV, visible or IR regions in Raman measurements
whereas in IR spectroscopy the range is limited to IR
frequencies
40. In case of Raman scattered light is observed at
right angles to the direction of the incident beam
whereas in case of IR the absorption signal is
measured in the same direction as the incident
beam.
Raman technique is non-destructive. The sample
can be measured directly in glass container or in
case of pharmaceuticals samples can be
measured in original sachets.. IR technique
requires solid sample preparation using KBr or
CSi powder though accessories such as
HATR permit direct observation of liquids, films
and gels.
41. Laser sources in Raman technique are highly
intense and these facilitate focusing the coherent
beam on small sample area or on exceedingly
small sample volumes. This is a key advantage
when only limited sample quantities are available
A high degree of amplification of weak Stoke
signals is necessary in presence of intense
Rayleigh light scattering component. This results
in higher cost of the Raman spectrometer. Higher
cost can be easily justified against the benefits
offered by the technique.