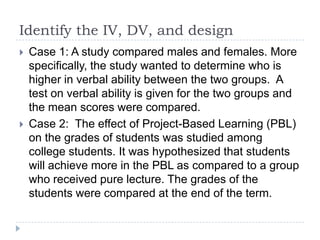
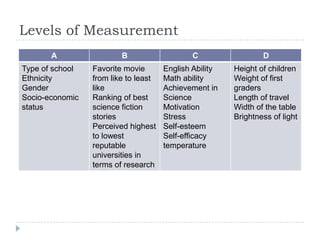
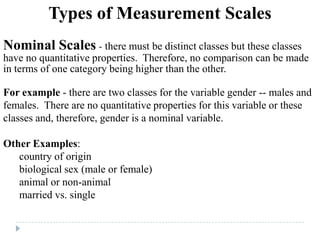
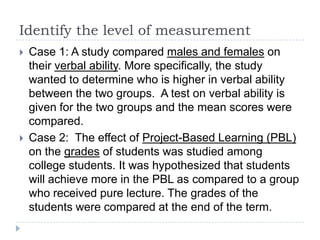
The level of measurement for gender in this case study is nominal. Gender (male or female) consists of distinct categories without quantitative properties that allow comparisons in terms of magnitude.
Case 2: The effect of Project-Based Learning (PBL)
on the grades of students was studied among
college students. Grades were either A, B, C, D, or F.
Methods of Data Collection in Quantitative Research (Biostatistik)AKak Long
DEFINITION : Quantitative research, is defined as a the systematic investigation of phenomena by gathering quantifiable data and performing statistical, mathematical or computational techniques.
Quantitative research gathers information from existing and potential customers using sampling methods and sending out online surveys, online polls, questionnaires etc., the results of which can be depicted in the form of numericals.
After careful understanding of these numbers to predict the future of a product or service and make changes accordingly.
Described as the process of gathering and measuring information on variables of interest, in an established systematic fashion that enables one to answer research questions, test hypothesis and evaluate outcome.
Importance of data collection:
Helps us search for answers and resolutions
Facilitates and improve decision-making processes and the quality of the decisions made.
#Types of quantitative research.
. Survey research
The collection of data attained by asking individuals questions by either in person, on paper, by phone or online.
2. Correlational research
Measures two variables, understand assess the statistical relationship between them with no influence from any extraneous variable.
3. Casual-comparative research
To find relationship between independent and dependent variables after an action or event has already occurred.
4. Experimental research
Researcher manipulates one variables, and control/randomizes the rest of the variables.
These introductory statistics slides will give you a basic understanding of statistics, types of statistics, variable and its types, the levels of measurements, data collection techniques, and types of sampling.
Reliability and Validity and How to Achieve Them - Mass Media Research.pptxMuhammad Awais
At least one pilot study should be conducted for any newly developed scale to ensure its reliability and validity. To be useful, a measurement must possess these two related qualities.
A measure is reliable if it consistently gives the same answer. Reliability in measurement is the same as reliability in any other context.
For example, a reliable person is one who is dependable, stable, and consistent over time. An unreliable person is unstable and unpredictable and may act one way today and another way tomorrow.
Similarly, if measurements are consistent from one session to another, they are reliable and can be believed to some degree.
measurement and scaling is an important tool of research. by following the right and suitable scale will provide an appropriate result of research.this slide show will additionally provide the statistical testing for research measurement and scale.
Measurement is a procedure for assigning symbols, letters, or numbers to empirical properties of variables according to rules. A Scale is a tool or mechanism by which individuals are distinguished as to how they differ from one another on the variables of interest to our study There are four levels of measurements: nominal, ordinal, interval, and ratio. The measurement scales, commonly used in marketing research, can be divided into two types; comparative and non-comparative scales. A number of scaling techniques are available for measurement of attitudes. There is no unique way that you can use to select a particular scaling technique for your research study.
Dr. Lani discusses all aspects of the dissertation methodology, including: selecting a survey instrument, population, reliability, validity, data analysis plan, and IRB/URR considerations.
This session answers the following questions: (1) What are the implications of the 4IR on Educational Assessment and Education as a whole? (2) What skills do we need to assess given the landscape of the 4IR? (3) How do we assess such skills to prepare students in the 4IR? (4) What standards should schools adapt to prepare students in the 4IR?
The objectives of this session are: (1) Identify the characteristics of an effective research mentor, (2) Identify issues and problems in thesis/research mentoring. (3) Make a flowchart of the mentoring process
Managing technology integration in schoolsCarlo Magno
This session answers the following questions: (1) How do we integrate technology in teaching and learning? (2) Is technology integration effective? (3) How do we support technology integration in our schools? (4) How do we know we are in the right track on technology integration?
This session first describes 21st century learning. Technology integration is described, shift in the use of technology in learning, the use of LMS, and the flipped classroom.
Empowering educators on technology integrationCarlo Magno
This presentation answers the following questions: (1) What is the status of technology integration among private schools? (2)What is needed among teachers to implement well technology integration? (3) What is needed among school administrators to make technology integration work? (4) What are the indicators of successful practice in ICT integration?
This slide tackles the steps, guidelines, and parts of an online lesson. A checklist is provided to assess whether the online lesson conform to quality standards.
This presentation provides an overview of K to 12 Curriculum in the Philippines. The different principles to be considered in teaching and learning the curriculum based on the best teaching and learning practices of the APA is tackled.
Accountability in Developing Student LearningCarlo Magno
This slide emphasizes on the role of instructional leaders to support instruction that would eventually lead to student learning. Different strategies on instructional leadership is tackled in order to achieve student progress overtime.
The Instructional leader: TOwards School ImprovementCarlo Magno
This slide contains (1) Purpose of instructional leadership, (2) What is instructional leadership? (3) Curriculum involvement
Functions of an instructional leader, (4) Roles of the instructional leader (5) Characteristics of instructional leadership, (5) Activities of instructional leadership, (6) Effective instructional leaders, (7) Instructionally effective schools, and (8)
Philippine Professional Standards for Teaching.
Guiding your child on their career decision makingCarlo Magno
This presentation provides perspective for parents to understand the career development of their child and how they get involved in their child's career development.
This presentation emphasizes on assessing science based on learning competencies, selecting appropriate forms of assessment and developing written and performance based tasks on science.
Assessment in the Social Studies CurriculumCarlo Magno
This presentation contains two assessment competencies of teachers in social studies: (1) Constructive alignment and (2) and making decisions as to give written works or performance-based assessment in class. Some guidelines in making paper and pencil items and performance-based task are presented.
This presentation covers new perspectives in using books in the classroom. The utility of books are integrated with pedagogical practices such as essential questions, inquiry-based approach, authentic-based tasks, and learner-centeredness
Digital Transformation and IT Strategy Toolkit and TemplatesAurelien Domont, MBA
This Digital Transformation and IT Strategy Toolkit was created by ex-McKinsey, Deloitte and BCG Management Consultants, after more than 5,000 hours of work. It is considered the world's best & most comprehensive Digital Transformation and IT Strategy Toolkit. It includes all the Frameworks, Best Practices & Templates required to successfully undertake the Digital Transformation of your organization and define a robust IT Strategy.
Editable Toolkit to help you reuse our content: 700 Powerpoint slides | 35 Excel sheets | 84 minutes of Video training
This PowerPoint presentation is only a small preview of our Toolkits. For more details, visit www.domontconsulting.com
Discover the innovative and creative projects that highlight my journey throu...dylandmeas
Discover the innovative and creative projects that highlight my journey through Full Sail University. Below, you’ll find a collection of my work showcasing my skills and expertise in digital marketing, event planning, and media production.
Implicitly or explicitly all competing businesses employ a strategy to select a mix
of marketing resources. Formulating such competitive strategies fundamentally
involves recognizing relationships between elements of the marketing mix (e.g.,
price and product quality), as well as assessing competitive and market conditions
(i.e., industry structure in the language of economics).
B2B payments are rapidly changing. Find out the 5 key questions you need to be asking yourself to be sure you are mastering B2B payments today. Learn more at www.BlueSnap.com.
In the Adani-Hindenburg case, what is SEBI investigating.pptxAdani case
Adani SEBI investigation revealed that the latter had sought information from five foreign jurisdictions concerning the holdings of the firm’s foreign portfolio investors (FPIs) in relation to the alleged violations of the MPS Regulations. Nevertheless, the economic interest of the twelve FPIs based in tax haven jurisdictions still needs to be determined. The Adani Group firms classed these FPIs as public shareholders. According to Hindenburg, FPIs were used to get around regulatory standards.
3.0 Project 2_ Developing My Brand Identity Kit.pptxtanyjahb
A personal brand exploration presentation summarizes an individual's unique qualities and goals, covering strengths, values, passions, and target audience. It helps individuals understand what makes them stand out, their desired image, and how they aim to achieve it.
LA HUG - Video Testimonials with Chynna Morgan - June 2024Lital Barkan
Have you ever heard that user-generated content or video testimonials can take your brand to the next level? We will explore how you can effectively use video testimonials to leverage and boost your sales, content strategy, and increase your CRM data.🤯
We will dig deeper into:
1. How to capture video testimonials that convert from your audience 🎥
2. How to leverage your testimonials to boost your sales 💲
3. How you can capture more CRM data to understand your audience better through video testimonials. 📊
Event Report - SAP Sapphire 2024 Orlando - lots of innovation and old challengesHolger Mueller
Holger Mueller of Constellation Research shares his key takeaways from SAP's Sapphire confernece, held in Orlando, June 3rd till 5th 2024, in the Orange Convention Center.
Affordable Stationery Printing Services in Jaipur | Navpack n PrintNavpack & Print
Looking for professional printing services in Jaipur? Navpack n Print offers high-quality and affordable stationery printing for all your business needs. Stand out with custom stationery designs and fast turnaround times. Contact us today for a quote!
Buy Verified PayPal Account | Buy Google 5 Star Reviewsusawebmarket
Buy Verified PayPal Account
Looking to buy verified PayPal accounts? Discover 7 expert tips for safely purchasing a verified PayPal account in 2024. Ensure security and reliability for your transactions.
PayPal Services Features-
🟢 Email Access
🟢 Bank Added
🟢 Card Verified
🟢 Full SSN Provided
🟢 Phone Number Access
🟢 Driving License Copy
🟢 Fasted Delivery
Client Satisfaction is Our First priority. Our services is very appropriate to buy. We assume that the first-rate way to purchase our offerings is to order on the website. If you have any worry in our cooperation usually You can order us on Skype or Telegram.
24/7 Hours Reply/Please Contact
usawebmarketEmail: support@usawebmarket.com
Skype: usawebmarket
Telegram: @usawebmarket
WhatsApp: +1(218) 203-5951
USA WEB MARKET is the Best Verified PayPal, Payoneer, Cash App, Skrill, Neteller, Stripe Account and SEO, SMM Service provider.100%Satisfection granted.100% replacement Granted.
Business Valuation Principles for EntrepreneursBen Wann
This insightful presentation is designed to equip entrepreneurs with the essential knowledge and tools needed to accurately value their businesses. Understanding business valuation is crucial for making informed decisions, whether you're seeking investment, planning to sell, or simply want to gauge your company's worth.
Personal Brand Statement:
As an Army veteran dedicated to lifelong learning, I bring a disciplined, strategic mindset to my pursuits. I am constantly expanding my knowledge to innovate and lead effectively. My journey is driven by a commitment to excellence, and to make a meaningful impact in the world.
Kseniya Leshchenko: Shared development support service model as the way to ma...Lviv Startup Club
Kseniya Leshchenko: Shared development support service model as the way to make small projects with small budgets profitable for the company (UA)
Kyiv PMDay 2024 Summer
Website – www.pmday.org
Youtube – https://www.youtube.com/startuplviv
FB – https://www.facebook.com/pmdayconference
2. Objectives
Decide on what statistics to use given a set of data
Use appropriate statistics in studies that will be
conducted (long term).
Use statistica to conduct some statistical analysis
3. Outline
Considerations in the selection of statistics to use.
List of statistics
Examples in using the statistics
5. Processing
What was the aim of the study?
What is the independent variable in the first study?
What is the dependent variable it the first study?
How many groups were used in the first study?
How many levels of IV was used in the first study?
How was the DV measured?
How was the data analyzed? What statistics was
used?
Why do you think this is the appropriate analysis?
What is the difference between study 1 and 2?
Would the analysis change?
6. When we analyzed the use of the statistics in the
study by Guthrie et al., what information did we
determine first?
7. What determines the use of statistics?
Variables Involved
•Independent
•Dependent
How many groups?
•Design
•Comparison
•Correlating
•Effect
Levels of
Measurement of the
variables (IV and DV)
8. Identify the IV, DV, and design
Case 1: A study compared males and females. More
specifically, the study wanted to determine who is
higher in verbal ability between the two groups. A
test on verbal ability is given for the two groups and
the mean scores were compared.
Case 2: The effect of Project-Based Learning (PBL)
on the grades of students was studied among
college students. It was hypothesized that students
will achieve more in the PBL as compared to a group
who received pure lecture. The grades of the
students were compared at the end of the term.
9. Identify the IV, DV, and design
Case 3: Writing anxiety, writing metacognition, and
topic knowledge was used to predict students writing
proficiency. Students essays were scored which
served as indicator for their writing proficiency.
Scales were used to determine writing anxiety,
writing metacognition, and topic knowledge.
Case 4: Neophyte and experienced principals,
coordinators, and directors were compared on their
degree of transformational leadership. A scale
measuring transformational leadership was
administered to the administrators across 200 school
in NCR.
10. Identify the IV, DV, and design
Case 4: Filipino and Korean high school students
were compared on their oral proficiency (TOEFL),
vocabulary, and reading comprehension in English
(English test).
Case 5: The effect of case study method on
students critical thinking was studied. The Watson
Glaser Critical Thinking Appraisal (WGCTA) was
administered as a pretest then the case study
method was implemented for the rest of the term.
Towards the end of the term, the WGCTA was
administered again.
Case 6: The frequencies of SV agreement errors
were counted among high school students in the
public and private. The comparison was also done
among high and low ability students in these two
11. Levels of Measurement
A B C D
Type of school
Ethnicity
Gender
Socio-economic
status
Favorite movie
from like to least
like
Ranking of best
science fiction
stories
Perceived highest
to lowest
reputable
universities in
terms of research
English Ability
Math ability
Achievement in
Science
Motivation
Stress
Self-esteem
Self-efficacy
temperature
Height of children
Weight of first
graders
Length of travel
Width of the table
Brightness of light
13. Levels of measurement
Three important properties:
Magnitude--property of “moreness”. Higher score
refers to more of something.
Equal intervals--is the difference between any
two adjacent numbers referring to the same
amount of difference on the attribute?
Absolute zero--does the scale have a zero point
that refers to having none of that attribute?
14. Types of Measurement Scales
Nominal Scales - there must be distinct classes but these classes
have no quantitative properties. Therefore, no comparison can be made
in terms of one category being higher than the other.
For example - there are two classes for the variable gender -- males and
females. There are no quantitative properties for this variable or these
classes and, therefore, gender is a nominal variable.
Other Examples:
country of origin
biological sex (male or female)
animal or non-animal
married vs. single
15. Nominal Scale
Sometimes numbers are used to designate category
membership
Example:
Country of Origin
1 = United States 3 = Canada
2 = Mexico 4 = Other
However, in this case, it is important to keep in mind that
the numbers do not have intrinsic meaning
16. Types of Measurement Scales
Ordinal Scales - there are distinct classes but these
classes have a natural ordering or ranking. The
differences can be ordered on the basis of magnitude.
For example - final position of horses in a
thoroughbred race is an ordinal variable. The horses
finish first, second, third, fourth, and so on. The
difference between first and second is not necessarily
equivalent to the difference between second and third,
or between third and fourth.
16
17. Ordinal Scales
Does not assume that the intervals between numbers are equal
Example:
finishing place in a race (first place, second place)
1 hour 2 hours 3 hours 4 hours 5 hours 6 hours 7 hours 8 hours
1st place 2nd place 3rd place 4th place
17
18. Types of Measurement Scales (cont.)
Interval Scales - it is possible to compare differences in magnitude,
but importantly the zero point does not have a natural meaning. It
captures the properties of nominal and ordinal scales -- used by most
psychological tests.
Designates an equal-interval ordering - The distance between, for
example, a 1 and a 2 is the same as the distance between a 4 and a 5
Example - Celsius temperature is an interval variable. It is meaningful to
say that 25 degrees Celsius is 3 degrees hotter than 22 degrees Celsius,
and that 17 degrees Celsius is the same amount hotter (3 degrees) than 14
degrees Celsius. Notice, however, that 0 degrees Celsius does not have a
natural meaning. That is, 0 degrees Celsius does not mean the absence
of heat!
18
19. Types of Measurement Scales (cont.)
Ratio Scales - captures the properties of the other types of
scales, but also contains a true zero, which represents the
absence of the quality being measured.
For example - heart beats per minute has a very natural zero
point. Zero means no heart beats. Weight (in grams) is also a
ratio variable. Again, the zero value is meaningful, zero grams
means the absence of weight.
Example:
the number of intimate relationships a person has had
0 quite literally means none
a person who has had 4 relationships has had twice as
many as someone who has had 219
20. Types of Measurement Scales (cont.)
• Each of these scales have different properties (i.e.,
difference, magnitude, equal intervals, or a true zero point)
and allows for different interpretations.
• The scales are listed in hierarchical order. Nominal scales
have the fewest measurement properties and ratio having the
most properties including the properties of all the scales
beneath it on the hierarchy.
• The goal is to be able to identify the type of measurement
scale, and to understand proper use and interpretation of the
scale.
21. Types of scales
Nominal scales--qualitative, not quantitative
distinction (no absolute zero, not equal intervals,
not magnitude)
Ordinal scales--ranking individuals (magnitude,
but not equal intervals or absolute zero)
Interval scales--scales that have magnitude and
equal intervals but not absolute zero
Ratio scales--have magnitude, equal intervals,
and absolute zero (so can compute ratios)
22. Test Your Knowledge:
A professor is interested in the relationship between the number
of times students are absent from class and the letter grade that
students receive on the final exam. He records the number of
absences for each student, as well as the letter grade
(A,B,C,D,F) each student earns on the final exam. In this
example, what is the measurement scale for number of
absences?
a) Nominal b) Ordinal c) Interval d) Ratio
23. In the previous example, what is the measurement scale of
letter grade on the final exam?
a) Nominal b) Ordinal c) Interval d) Ratio
24. A researcher is interested in studying the effect of room
temperature in degrees Fahrenheit on productivity of automobile
assembly workers. She controls the temperature of the three
manufacturing facilities, such that employees in one facility work
in a room temperature of 60 degrees, employees in another
facility work in a room temperature of 65 degrees, and the last
group works in a room temperature of 70 degrees. The
productivity of each group is indicated by the number of
automobiles produced each day. In this example, what is the
measurement scale of room temperature?
a) Nominal b) Ordinal c) Interval d)Ratio
25. In the previous example, what is the measurement scale of
productivity?
a) Nominal b) Ordinal c) Interval d) Ratio
26. Select the highest appropriate level of measurement:
Bicycle models:
1= Road
2 = Touring
3 = Mountain
4 = Hybrid
5 = Comfort
6 = Cruiser
a) Nominal b) Ordinal c) Interval d) Ratio
27. Select the highest appropriate level of measurement:
Educational Level:
1 = Some High school
2 =High school Diploma
3 = Undergraduate Degree
4 = Masters Degree
5 = Doctorate Degree
a) Nominal b) Ordinal c) Interval d) Ratio
28. Select the highest appropriate level of measurement:
Number of questions asked during a class lecture
a) Nominal b) Ordinal c) Interval d) Ratio
29. Select the highest level of measurement:
Categories on a Likert-type scale measuring attitudes:
1 = Strongly Disagree
2 = Disagree
3 = Neutral
4 = Agree
5 = Strongly Agree
a) Nominal b) Ordinal c) Interval d) Ratio
30. Identify the level of measurement
Case 1: A study compared males and females on
their verbal ability. More specifically, the study
wanted to determine who is higher in verbal ability
between the two groups. A test on verbal ability is
given for the two groups and the mean scores were
compared.
Case 2: The effect of Project-Based Learning (PBL)
on the grades of students was studied among
college students. It was hypothesized that students
will achieve more in the PBL as compared to a group
who received pure lecture. The grades of the
students were compared at the end of the term.
31. Identify the level of measurement
Case 3: Writing anxiety, writing metacognition, and
topic knowledge was used to predict students writing
proficiency. Students essays were scored which
served as indicator for their writing proficiency.
Scales were used to determine writing anxiety,
writing metacognition, and topic knowledge.
Case 4: Neophyte and experienced principals,
coordinators, and directors were compared on their
degree of transformational leadership. A scale
measuring transformational leadership was
administered to the administrators across 200 school
in NCR.
32. Identify the level of measurement
Case 4: Filipino and Korean high school students
were compared on their oral proficiency (TOEFL),
vocabulary, and reading comprehension in English
(English test).
Case 5: The effect of case study method on
students critical thinking was studied. The Watson
Glaser Critical Thinking Appraisal (WGCTA) was
administered as a pretest then the case study
method was implemented for the rest of the term.
Towards the end of the term, the WGCTA was
administered again.
Case 6: The frequencies of SV agreement errors in
an essay were counted among high school students
in the public and private. The comparison was also
done among high and low ability students in these
33. Statistics Used
Parametric Non-Parametric
•Enables researchers to make
assumptions about the population
•Large sample size is requires (N>30)
•Used for interval and ratio scales
•Difficult to make assumptions about
the population
•Large sample size is not a
requirement
•Used for nominal and ordinal scales
34. Statistics Used
Design Parametric Non-Parametric
One sample
-the mean of one sample is compared
with a standard
No. of comparisons:
nominal
DV: interval/ratio
One sample,
categories are
nominal/ordinal
One sample repeated measures
(dependent groups)
-One sample is studies but more
measured twice (2 set of data)
- e. g. pre and post test design
No. of comparisons:
nominal
DV: interval/ratio
No. of comparisons:
nominal
DV: nominal/ordinal
Two independent groups
-studying two distinct samples/groups
Groups/IV: nominal
DV: interval/ratio
Groups/IV: nominal
DV: nominal/ordinal
Comparing multiple groups
(independent or dependent groups)
Groups/IV: nominal
DV: interval/ratio
Groups/IV: nominal
DV: nominal
Relating one variable to another
35. Statistics Used
Design Parametric Non-Parametric
One sample
-the mean of one sample is
compared with a standard
z-test
t-test
One-way chi-square
Kolmogorov smirnov
One sample repeated measures
(dependent groups)
-One sample is studies but more
measured twice (2 set of data)
- e. g. pre and post test design
t-test for 2 dependent
samples
McNemar change test
Wilcoxon signed ranks
test
Two independent groups
-studying two distinct
samples/groups
t-test for 2
independent samples
Two-way chi-square
Mann Whitney U test
Comparing multiple groups
(independent or dependent groups)
Analysis of Variance
(ANOVA)
1 IV, 1 DV: one way
ANOVA
2 IV, 1 DV: two way
ANOVA
1 more IV, 2 or more
DV: MANOVA
Kruskal wallis test
36. Case 1
It was hypothesized in a study that students ability in
school is related to procrastination. College students
were tested using the OTIS Lenon School Ablity Test
(OLSAT) and the perfectionism scale by Frost was
administered to the same group.
How many variables are studied?
What are the levels of measurement of the
variables?
What is the purpose of the study?
What statistics will be used?
38. Regression Line between OLSAT and
perfectionism
S ca tte rp lo t: X vs. Y
Y = 1 4 .3 7 9 + .8 5 6 3 3 * X
C o rre la tio n : r = .9 8 9 6 6
4 0 5 0 6 0 7 0 8 0 9 0 1 0 0 1 1 0
X
5 5
6 0
6 5
7 0
7 5
8 0
8 5
9 0
9 5
1 0 0
1 0 5
Y
9 5 % co n fid e n ce
39. Linear Regression
There is a straight line relationship between
variables X and Y
When X increases, Y also increases-positive
relationship
When X increases, Y decreases or vice versa –
negative relationship
40. Correlational Techniques
Pearson Product-Moment correlation – (r) used for
interval/ratio sets of variables
Spearman Rank-order correlation – two sets of data
are ordinal
Phi coefficient – each of the variables is a
dichotomy
42. Relationship between Laziness and
Perseverance S ca tte rp lo t: Y vs. X
X = 1 3 9 .9 4 - 1 .1 3 8 * Y
C o rre la tio n : r = -.9 9 5 9
3 0 4 0 5 0 6 0 7 0 8 0 9 0
Y
4 0
5 0
6 0
7 0
8 0
9 0
1 0 0
1 1 0
X
9 5 % co n fid e n ce
43. Magnitude of the Relationship
Positive relationship – as one variable increases
the other variable also increases
Ex. academic grades and intelligence
Negative relationship – as one variable increases,
the other decreases or vice versa
Ex. procrastination and motivation
Absence of relationship between variables –
denoted by .00
Show computation in statistica
44. Strength of Relationship
A correlation coefficient is computed for a
bivariate distribution using a statistical formula
Correlation Coefficient Value Interpretation
0.80 – 1.00 Very strong relationship
0.6 – 0.79 Strong relationship
0.40 – 0.59 Substantial/marked relationship
0.2 – 0.39 Low relationship
0.00 – 0.19 Negligible relationship
45. Variance
How much of Y’s is explained/accounted for by X
Proportion explained
Square of the correlation coefficient value
46. Case 2: Spearman rho
Students ranked their degree of importance on
poverty alleviation poverty and health policy.
Poverty alleviation policy Health policy
14 13
11 12
10 9
10 8
14 10
13 14
47. Case 3: Phi coefficient
High Low
Own choice 30 20
Others choice 10 40
Teaching Satisfaction
Becoming
a teacher
48. Case 4: One sample t-test
7 Filipino college students have taken the Test for
English as a Second Language (TESL). The
researcher wanted to determine if their scores are
far from the standard norm among speakers of ESL.
The standard norm in the manual is 40.5 with a
standard error of 4.54.42
45
46
45
43
46
47
49. Case 5: one way chi-square
Errors found F Expected
frequency
Poor sentence
construction
26 21.11
Wrong choice of
word
32 21.11
Faulty parallelism 12 21.11
Wrong case 14 21.11
Wrong
punctuation
46 21.11
Fragment 8 21.11
Wrong article 16 21.11
Run-on sentence 27 21.11
Wrong verb 9 21.11
Total=190
50. Case 6: Kolmogorov smirnov
fo fe
Asst. Instructor
25 15.6
Instructor
10 15.6
Ass. Prof
31 15.6
Prof
7 15.6
Full Prof 5 15.6
ft/∑ fo = 78
51. Case 7: t-test for 2 dependent samples
A study investigated whether the effect of problem-
based teaching in mathematics would develop
students deep approach to learning. The students
were first given a pre test using the learning process
questionnaire (LPQ) that measures deep approach
to learning. The students are exposed to different
problems in mathematics before learning concepts
and algorithms. After the instruction, the LPQ was
again administered to the same 10 students.
52. Case 7: t-test for 2 dependent samples
LPQ pre test LPQ post test
24 2
28 30
32 37
18 22
24 29
36 40
40 38
37 41
24 29
20 28
53. Case 8: Wilcoxon signed ranks test
One group of pre-school students were asked to
rank a picture by giving the age of a very simple
person in a picture without make-up. On a second
occasion, the same person in the first picture was
again shown but with elaborate clothes and with
make-up. Is there a difference in the 2 sets of
rankings?
55. Case 9: McNemar Change test
An experiment was conducted to determine whether
hypnosis can be a clinical intervention to increase
students test performance. A test was given and
students who passed and failed were identified. The
students have undergone hypnosis and after session
they were again given an identical test. The students
who passed and failed were again identified.
Before hypnosis
Pass Fail
After
hypnosis
Fail 7 10
Pass 15 20
56. Case 10: t-test for 2 independent samples
The effect of picture-taste association on memory
recall was investigated among 30 volunteer college
students. The 15 participants in the experiment
group looked at 20 pictures matched with the food
that they have to taste. The other 15 participants in
the control group just looked at the pictures. After
the procedure, both groups were tested in their
memory where they have to enumerate in order the
labels of the pictures they saw.
58. Case 11: Mann-Whitney U test
In the study, 8 single individuals and 7 married
individuals were asked to rank their life satisfaction
using a ranking scale. Test whether they differ in
their rankings.
Single Married
40 10
37 75
35 40
37 32
51 25
38 62
42 5
49
59. Case 12: Chi-square
A survey was conducted among 29 prisoners in
manila city jail. They were asked crimes that they
committed and their educational attainment through
a checklist. The following data was tabulated
Crimes
Committed
Educational Attainment
Elementary HS College Total
Murder 3 7 1 11
Homicide 2 3 6 11
Robbery 1 2 5 8
Total 6 12 12 30
60. Case 13: One-Way ANOVA
In an experiment, the effect of nonbehavioral
intervention techniques was investigated on the
computational ability of fourth year high school
students. The non-behavioral intervention
techniques has three levels: bibliotherapy, small
group interaction, and games. These techniques
were used as a teaching strategy in a lesson in a
math class for three sections. Each of the strategy
was used for each section. One section did not
receive any strategy which served as the control
group. After undergoing the strategy, the students
were tested where they answered a series of
computation items.
61. Case 13: One-Way ANOVA
Control bibliotherap
y
Small group Games
8 14 19 15
9 13 18 15
6 12 19 14
7 15 19 15
2 15 17 13
4 14 18 14
4 13 18 13
63. Case 14: Two way ANOVA
low achiever high achiever
Public
10 15
9 16
5 17
6 15
5 16
Private
15 19
14 20
14 19
13 18
15 18
64. Case 15: MANOVA
Public and Private schools were compared on their
self-monitoring and goal-setting
Self-monitoring goal-setting
Public 10 9
10 8
9 7
7 7
8 5
7 5
6 4
Private 18 17
19 19
18 19
17 18
17 18
18 17
18 18
65. Case 16: Multiple regression
Goal-setting, self-evaluation, seeking assistance,
and environmental structuring were used to predict
learning responsibility.
66. Workshop
Work with a team
Make an outline of a study that will make use of
quantitative analysis
State the purpose of the study (research question)
Possible hypothesis (if there is)
Framework that supports the study
Research Design
Participants
Instruments
Procedure
Data Analysis