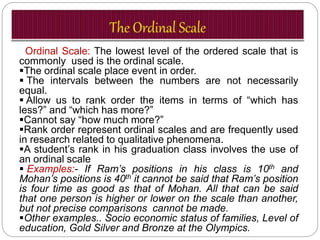
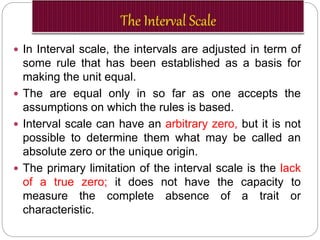
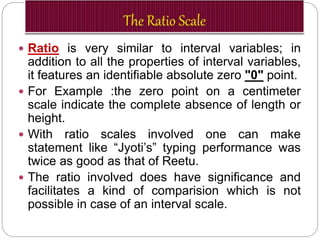
caling is the branch of measurement that involves the construction of an instrument that associates qualitative constructs with quantitative metric units. Scaling evolved out of efforts in psychology and education to measure “unmeasurable” constructs like authoritarianism and self-esteem. In many ways, scaling remains one of the most arcane and misunderstood aspects of social research measurement. And, it attempts to do one of the most difficult of research tasks – measure abstract concepts.
Most people don’t even understand what scaling is. The basic idea of scaling is described in General Issues in Scaling, including the important distinction between a scale and a response format. Scales are generally divided into two broad categories: unidimensional and multidimensional. The unidimensional scaling methods were developed in the first half of the twentieth century and are generally named after their inventor. We’ll look at three types of unidimensional scaling methods here:
Thurstone or Equal-Appearing Interval Scaling
Likert or “Summative” Scaling
Guttman or “Cumulative” Scaling
In the late 1950s and early 1960s, measurement theorists developed more advanced techniques for creating multidimensional scales. Although these techniques are not considered here, you may want to look at the method of concept mapping that relies on that approach to see the power of these multivariate methods.
Validate data
Questionnaire checking
Edit acceptable questionnaires
Code the questionnaires
Keypunch the data
Clean the data set
Statistically adjust the data
Store the data set for analysis
Analyse data
Vasumitra Life Energies provide the solution to current problem that India is facing. The P.R.O.M. (Phosphate Rich Organic Manure) or Samved Humiphos is manufactured and marketed as alternative to Single Super Phosphate (SSP) and Di ammonium Phosphate (DAP).
Integrated Nutrient Management refers to maintenance of soil fertility and the plant nutrient supply at an optimum level for sustaining the desired productivity through optimization of the benefits from all the possible sources of Organic, Inorganic & biological component in an integrated manner.
Measurement is the process observing and recording the observations that are collected as part of a research effort.
Process of assigning numbers to objects or observations, the level of measurement being a function of the rules under which the numbers are assigned.
“convert the basic materials of the problem to data”
This Power Point Presentation has been made while referring to the research books written by eminent, renowned and expert authors as mentioned in the references section. The purpose of this Presentation is to help the research students in developing an insight about the Scaling in Research.
This presentation is on Measurement and it's scales. There are four different types of scales of measurement, namely, Nominal, Ordinal, Interval and Ratio
Adjusting primitives for graph : SHORT REPORT / NOTESSubhajit Sahu
Graph algorithms, like PageRank Compressed Sparse Row (CSR) is an adjacency-list based graph representation that is
Multiply with different modes (map)
1. Performance of sequential execution based vs OpenMP based vector multiply.
2. Comparing various launch configs for CUDA based vector multiply.
Sum with different storage types (reduce)
1. Performance of vector element sum using float vs bfloat16 as the storage type.
Sum with different modes (reduce)
1. Performance of sequential execution based vs OpenMP based vector element sum.
2. Performance of memcpy vs in-place based CUDA based vector element sum.
3. Comparing various launch configs for CUDA based vector element sum (memcpy).
4. Comparing various launch configs for CUDA based vector element sum (in-place).
Sum with in-place strategies of CUDA mode (reduce)
1. Comparing various launch configs for CUDA based vector element sum (in-place).
StarCompliance is a leading firm specializing in the recovery of stolen cryptocurrency. Our comprehensive services are designed to assist individuals and organizations in navigating the complex process of fraud reporting, investigation, and fund recovery. We combine cutting-edge technology with expert legal support to provide a robust solution for victims of crypto theft.
Our Services Include:
Reporting to Tracking Authorities:
We immediately notify all relevant centralized exchanges (CEX), decentralized exchanges (DEX), and wallet providers about the stolen cryptocurrency. This ensures that the stolen assets are flagged as scam transactions, making it impossible for the thief to use them.
Assistance with Filing Police Reports:
We guide you through the process of filing a valid police report. Our support team provides detailed instructions on which police department to contact and helps you complete the necessary paperwork within the critical 72-hour window.
Launching the Refund Process:
Our team of experienced lawyers can initiate lawsuits on your behalf and represent you in various jurisdictions around the world. They work diligently to recover your stolen funds and ensure that justice is served.
At StarCompliance, we understand the urgency and stress involved in dealing with cryptocurrency theft. Our dedicated team works quickly and efficiently to provide you with the support and expertise needed to recover your assets. Trust us to be your partner in navigating the complexities of the crypto world and safeguarding your investments.
Show drafts
volume_up
Empowering the Data Analytics Ecosystem: A Laser Focus on Value
The data analytics ecosystem thrives when every component functions at its peak, unlocking the true potential of data. Here's a laser focus on key areas for an empowered ecosystem:
1. Democratize Access, Not Data:
Granular Access Controls: Provide users with self-service tools tailored to their specific needs, preventing data overload and misuse.
Data Catalogs: Implement robust data catalogs for easy discovery and understanding of available data sources.
2. Foster Collaboration with Clear Roles:
Data Mesh Architecture: Break down data silos by creating a distributed data ownership model with clear ownership and responsibilities.
Collaborative Workspaces: Utilize interactive platforms where data scientists, analysts, and domain experts can work seamlessly together.
3. Leverage Advanced Analytics Strategically:
AI-powered Automation: Automate repetitive tasks like data cleaning and feature engineering, freeing up data talent for higher-level analysis.
Right-Tool Selection: Strategically choose the most effective advanced analytics techniques (e.g., AI, ML) based on specific business problems.
4. Prioritize Data Quality with Automation:
Automated Data Validation: Implement automated data quality checks to identify and rectify errors at the source, minimizing downstream issues.
Data Lineage Tracking: Track the flow of data throughout the ecosystem, ensuring transparency and facilitating root cause analysis for errors.
5. Cultivate a Data-Driven Mindset:
Metrics-Driven Performance Management: Align KPIs and performance metrics with data-driven insights to ensure actionable decision making.
Data Storytelling Workshops: Equip stakeholders with the skills to translate complex data findings into compelling narratives that drive action.
Benefits of a Precise Ecosystem:
Sharpened Focus: Precise access and clear roles ensure everyone works with the most relevant data, maximizing efficiency.
Actionable Insights: Strategic analytics and automated quality checks lead to more reliable and actionable data insights.
Continuous Improvement: Data-driven performance management fosters a culture of learning and continuous improvement.
Sustainable Growth: Empowered by data, organizations can make informed decisions to drive sustainable growth and innovation.
By focusing on these precise actions, organizations can create an empowered data analytics ecosystem that delivers real value by driving data-driven decisions and maximizing the return on their data investment.
Chatty Kathy - UNC Bootcamp Final Project Presentation - Final Version - 5.23...John Andrews
SlideShare Description for "Chatty Kathy - UNC Bootcamp Final Project Presentation"
Title: Chatty Kathy: Enhancing Physical Activity Among Older Adults
Description:
Discover how Chatty Kathy, an innovative project developed at the UNC Bootcamp, aims to tackle the challenge of low physical activity among older adults. Our AI-driven solution uses peer interaction to boost and sustain exercise levels, significantly improving health outcomes. This presentation covers our problem statement, the rationale behind Chatty Kathy, synthetic data and persona creation, model performance metrics, a visual demonstration of the project, and potential future developments. Join us for an insightful Q&A session to explore the potential of this groundbreaking project.
Project Team: Jay Requarth, Jana Avery, John Andrews, Dr. Dick Davis II, Nee Buntoum, Nam Yeongjin & Mat Nicholas
2. MEASUREMENT AND SCALE
Presented By:
Jaspreet Kaur
Dep. Of Food Science & Nutrition
ASPEE College of Home Science
Sardar Krushinagar Dantiwada Agricultural University
3. 3
• Measurement is a process of mapping aspect of a
domain on to other aspect of a range according to some
rules of correspondence.
Acc. To Stevens(1946),
Measurement is assigning numbers to the objects or
events .
The purpose of measurement is to have information in a
form in which a variables can be related to each other.
MEASUREMENT
4. VARIABLES
IntervalNominal
Ordinal Ratio
The "levels of measurement" are expressions that typically
refer to the theory of scale developed by the psychologist
Stanley Smith Stevens .
Stevens claimed that all measurement in science was
conducted using four different types of scales that he called
"nominal", "ordinal", "interval" and "ratio".
5. • Nominal measurement is a system of assigning number
symbols to event in order to label them.
• No quantitative information is conveyed in nominal data.
• No ordering of the items is implied.
• Nominal scales are used to measure QUALITATIVE
variables only.
• Nominal scale simply describe differences between
things by assigning them to categories.
• Nominal scale are very useful and are widely used in
survey and other ex-post facto research when data are
being classified by major sub- group of the population .
• For example… Assignment of numbers of basketball
player in order to identify them.
• Other example… Religious preference, race, and
gender.
6. Ordinal Scale: The lowest level of the ordered scale that is
commonly used is the ordinal scale.
The ordinal scale place event in order.
The intervals between the numbers are not necessarily
equal.
Allow us to rank order the items in terms of “which has
less?” and “which has more?”
Cannot say “how much more?”
Rank order represent ordinal scales and are frequently used
in research related to qualitative phenomena.
A student’s rank in his graduation class involves the use of
an ordinal scale
Examples:- If Ram’s positions in his class is 10th and
Mohan’s positions is 40th it cannot be said that Ram’s position
is four time as good as that of Mohan. All that can be said
that one person is higher or lower on the scale than another,
but not precise comparisons cannot be made.
Other examples.. Socio economic status of families, Level of
education, Gold Silver and Bronze at the Olympics.
7. In Interval scale, the intervals are adjusted in term of
some rule that has been established as a basis for
making the unit equal.
The are equal only in so far as one accepts the
assumptions on which the rules is based.
Interval scale can have an arbitrary zero, but it is not
possible to determine them what may be called an
absolute zero or the unique origin.
The primary limitation of the interval scale is the lack
of a true zero; it does not have the capacity to
measure the complete absence of a trait or
characteristic.
8. Allows us not only to rank order the items that
are measured, but also to quantify and compare
the sizes of differences between them.
For example… temperature, as measured in
degrees Fahrenheit or Celsius, constitutes an
interval scale. Equal differences on this scale
represent equal differences in temperature, but
a temperature of 30 degrees is not twice as
warm as one of 15 degrees.
9. Ratio is very similar to interval variables; in
addition to all the properties of interval variables,
it features an identifiable absolute zero "0" point.
For Example :the zero point on a centimeter
scale indicate the complete absence of length or
height.
With ratio scales involved one can make
statement like “Jyoti’s” typing performance was
twice as good as that of Reetu.
The ratio involved does have significance and
facilitates a kind of comparision which is not
possible in case of an interval scale.
10. Ratio scale represents the actual amount of variable.
Measure of physical dimension such as weight,
height, physical distance etc. are examples.
11. Student
Mark out of
100%
Mark relative
to 40% pass
mark
Position Result
Ahmed 56 16 6 Pass
Ali 48 8 7 Pass
Comara 65 25 3 Pass
Dawod 73 33 2 Pass
Elias 62 22 4 Pass
Fatima 35 -5 10 Fail
Sayyed 20 -20 9 Fail
Hana 38 -2 8 Fail
Nurul 58 18 5 Pass
Zaleha 82 42 1 Pass
Ratio Interval Ordinal Nominal
12. Possible sources of error
Respondent
Situation
Measurer
Instrument
Source of Error in Measurement
13. At time the respondent may be
reluctant to express strong negative
feeling .
Transient factor like fatigue, boredom,
anxiety, etc may limit the ability of the
respondent to respond accurately and
fully.
Respondent
14. Any condition which palaces a strain on interview can have
serious effects on the interviewer-respondent rapport.
For instance ,if someone else is present, he/she can distort
responses by joining in or merely by being present.
Situation
15. The interviewer can distort responses by rewording
and reordering questions.
Careless mechanical processing can distort the
finding
Incorrect coding ,faulty tabulation or statistical
calculation particularly in the data analysis stage.
measurer
16. Error may arise because of defective measuring
instrument. Those may be:
Use of complex word
Beyond the comprehension of the respondent
Ambiguous meaning
Poor printing
Inadequate space for replies
Response choice omission etc .
Another type of instrument deficiency is the poor sampling
of the universe of items of concern.
Instrument
17. ss
Sound measurement must meet the tests of
validity, reliability, practicality .
These are three major consideration one should
use in evaluating a measurement tool.
Tests of sound measurement
18. 18
Validity means truthfulness .
Validity refers to the extent to which a tests
measures what we actually wish to measure.
Lindquist (1951) defined validity of test as “the
accuracy with which it measures that which is
intended to measure”.
For example, a test to measure farmers’
knowledge about plant protection is valid for
measuring that dimensions & nothing else.
test of validity
20. It is the degree to which a test measures an
intended content area.
It involves essentially the systematic examination
of the test content to determine whether it covers
a representative sample of behaviour domain to
be measured.
It is established in two ways by experts
judgement & statistical analysis.
20
CONTENT VALIDITY
21. For example the items to be measured were sent to
judges who were experts, with two categories ‘agree’ &
‘disagree’ against each item . In final selection, the items
for which there were at least 80% judges’ agreement
were retained. This indicated validity of scale content.
Similarly statistical methods are also applied, for
example if one wants to know the content of validity of a
Hindi spelling test, then the teacher can correlate the
scores on the said test with another similar Hindi spelling
test. A high correlation coefficient would provide an index
for the content validity (Singh,1997).
21
Contd………
22. It is defined as the extent to which the test may be said to
measure a theoretical construct or trait. (Anastasi,1968)
It is a more complex & difficult process. Hence, a decision to
compute construct validity is taken only when the researcher is
fully satisfied that neither any valid & reliable criterion to define
the quality of test is available.
For example, the attitude of farmer towards the use of
nitrogenous fertilisers. The construct for this purpose was ‘the
more favourable the attitude of a respondent to an improved
farming innovation, the greater is the adoption of that innovation
by the respondent’. This theory or construct was tested by
calculating correlation coefficient between adoption scores of
nitrogenous fertilisers for 50 respondents & the attitude scores
for them obtained on the basis of attitude scale of the study. The
correlation coefficient was found to be positive & highly22
CONSTRUCT VALIDITY
23. It is defined as the degree to which a measure predicts a
second future measure(Sproull,1988).
In this, test scores are obtained and then a time of gap of
months or years is allowed to elapse, after which the criterion
scores are obtained. Subsequently, the test scores & the
criterion scores are correlated & the obtained correlation
becomes the index of predictive validity.
For example, an investigator may administer a test of
intelligence to the students at the time of their admission to a
college & thus obtains a set of scores. After two years, marks
obtained in the final examination are noted which constitutes
the criterion scores. A product moment correlation may be
computed between the sets of intelligence scores at the time
of admission & the marks obtained after two years.
23
Predictive validity
24. If the correlation is positive & significant it can be
said that scores on intelligence at the time of
admission are directly predicting the future
performance of the students in the college. The
correlation becomes the index of validity coefficient.
Predictive validity is needed for tests which include
long range forecast of academic achievement,
industrial management etc.
24
Contd….
25. In this method a test is correlated with a criterion
which is available at the present time. Scores on
newly constructed intelligence test may be
correlated with scores obtained on an already
standardised test of intelligence. The resulting
coefficient of correlation is the indicator of
concurrent validity(Singh, 1997).
25
Concurrent validity
26. RELIABILITY & validity OF MEASUREMENT
26
The key indicators of the quality of a measuring
instrument are the reliability and validity of the measures.
The process of developing and validating an instrument is
in large part focused on reducing error in the
measurement process.
RELIABILITY & validity OF MEASUREMENT
27. 27
Reliability refers to the consistency of scores
obtained by the same individuals when re-examined
with test on different occasions, or with different sets
of equivalent items or under variable examining
conditions.(Anastasi,1968).
For example, if an individual receives a score of 60
on an achievement test & is assigned a rank, the
person should receive approximately the same rank
when the test is administered on the second
occasion.
RELIABILITY
28. TYPES OF RELIABILITY
28
Inter-rater reliability.
Test-retest reliability.
Inter method reliability.
Internal consistency reliability.
TYPES OF RELIABILITY
29. 29
Inter-rater reliability: assesses the degree to
which test scores are consistent when
measurements are taken by different people
using the same methods.
Test-retest reliability: assesses the degree to
which test scores are consistent from one test
administration to the next. Measurements are
gathered from a single rater who uses the
same methods or instruments and the same
testing conditions. This includes intra-rater
reliability.
Contd….
30. Contd…
30
Inter method reliability: assesses the degree to
which test scores are consistent when there is a
variation in the methods or instruments used. This
allows inter-rater reliability to be ruled out.
Internal consistency reliability: assesses the
consistency of results across items within a test.
Contd…..
31. Practicality : Practicality is concerned with a wide range of
factors of economy, convenience and interpretability.
From the operation point of view, the measuring
instrument ought to be practical i.e.it should be
economical, convenient, and interpretable.
Economy consideration suggest that some trade off is
needed between the ideal research project that which the
budget can afford.
Convenience test suggest that the should be easy to
measuring instrument should be easy to administer.
For this purpose one should give due attention to the
proper layout of the measuring instrument.
For Instance, A questionnaire with clear instruction is
certainly more effective and easier to complete to complete
than one which lacks these features.
Test of practicality
32. Interpretability consideration is specially important
when person other then the designers of the test are
to interpret the result.
The measuring instrument , in the order to be
interpretable, must be supplemented by
a) Detailed instructions for administering the test;
b) Scoring keys;
c) Evidence about the reliability and
d) Guides for using the and for interpreting results.
cont......
33. The technique of developing measurement tools
involves a four stage process ,consisting of the
following :
Concept development;
Specification of concept dimensions;
selection of indicator; and
Formation of index.
Technique of developing measurement tool
34. First and foremost step which means that the
researcher should arrive at an understanding of the
major concepts pertaining to his/her study.
This step is more apparent in theoretical studies than
in the more pragmatic research , where the
fundamental concepts are already established.
Step first-concept development
35. This step require the researcher to specify the
dimensions of the concepts that he/she developed in
the first stage.
This task may either be accomplished by deduction
i.e. by adopting a more or less intuitive approach or
by empirical correlation of the individual dimensions
with the total concept and/or other concepts.
For instance: one may think of several dimension
such as product reputation, customer treatment,
corporate leadership, concern for individuals, sense
of social responsibility and so forth when one is
thinking about the image of a certain company.
Step second -concept development
36. After specification the dimension of concept ,the
researcher must develop indicators for measuring
each concept element.
Indicator are specific question, scales or other
devices by which respondent’s knowledge, opinion
expectation, etc are measured.
As there is seldom a perfect measure of a concept,
the researcher should consider several alternatives
for the purpose.
The use of more than one indicator gives stability to
the scores and it is also improves their validity.
Step third -selecton of indicator
37. When we have several dimensions of a concept or
different measurements of a dimensions, we may
need to combine them into a single index .
One simple way for getting an overall index is to
provide scale value to the responses and then sum
up the corresponding scores.
Such an overall index would provide a better
measurement tool than a single indicator because of
that an individual indicator has only a probability
relation to what we really want to know.
This way we must obtain an overall index for the
various concepts
Step fourth - formation of index