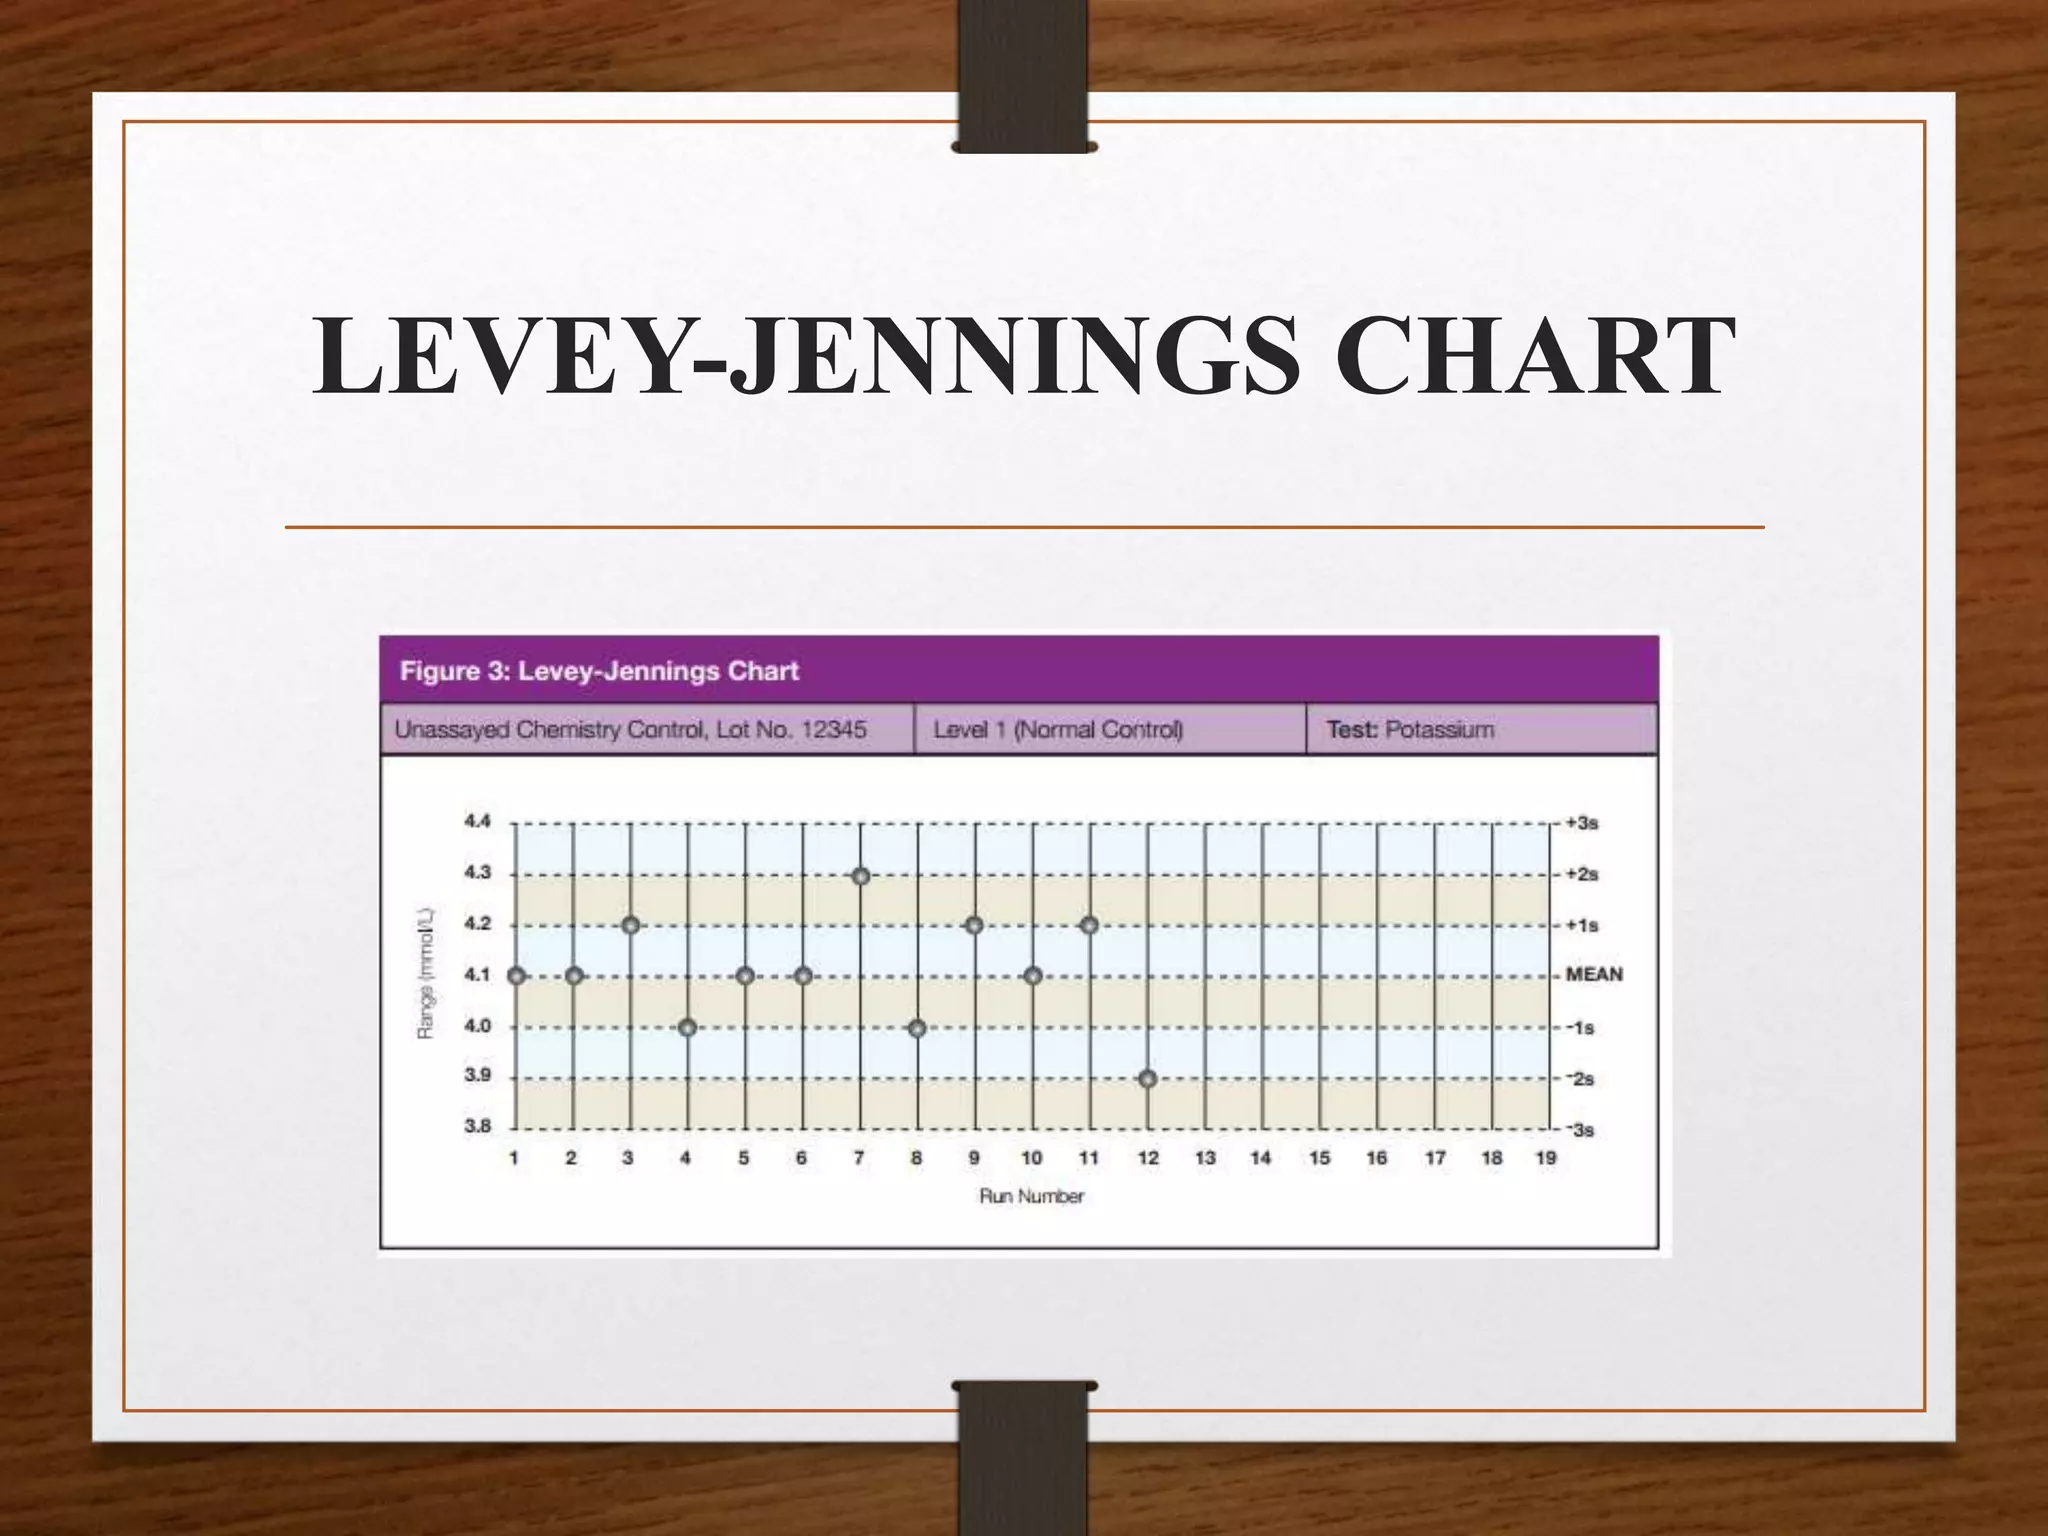
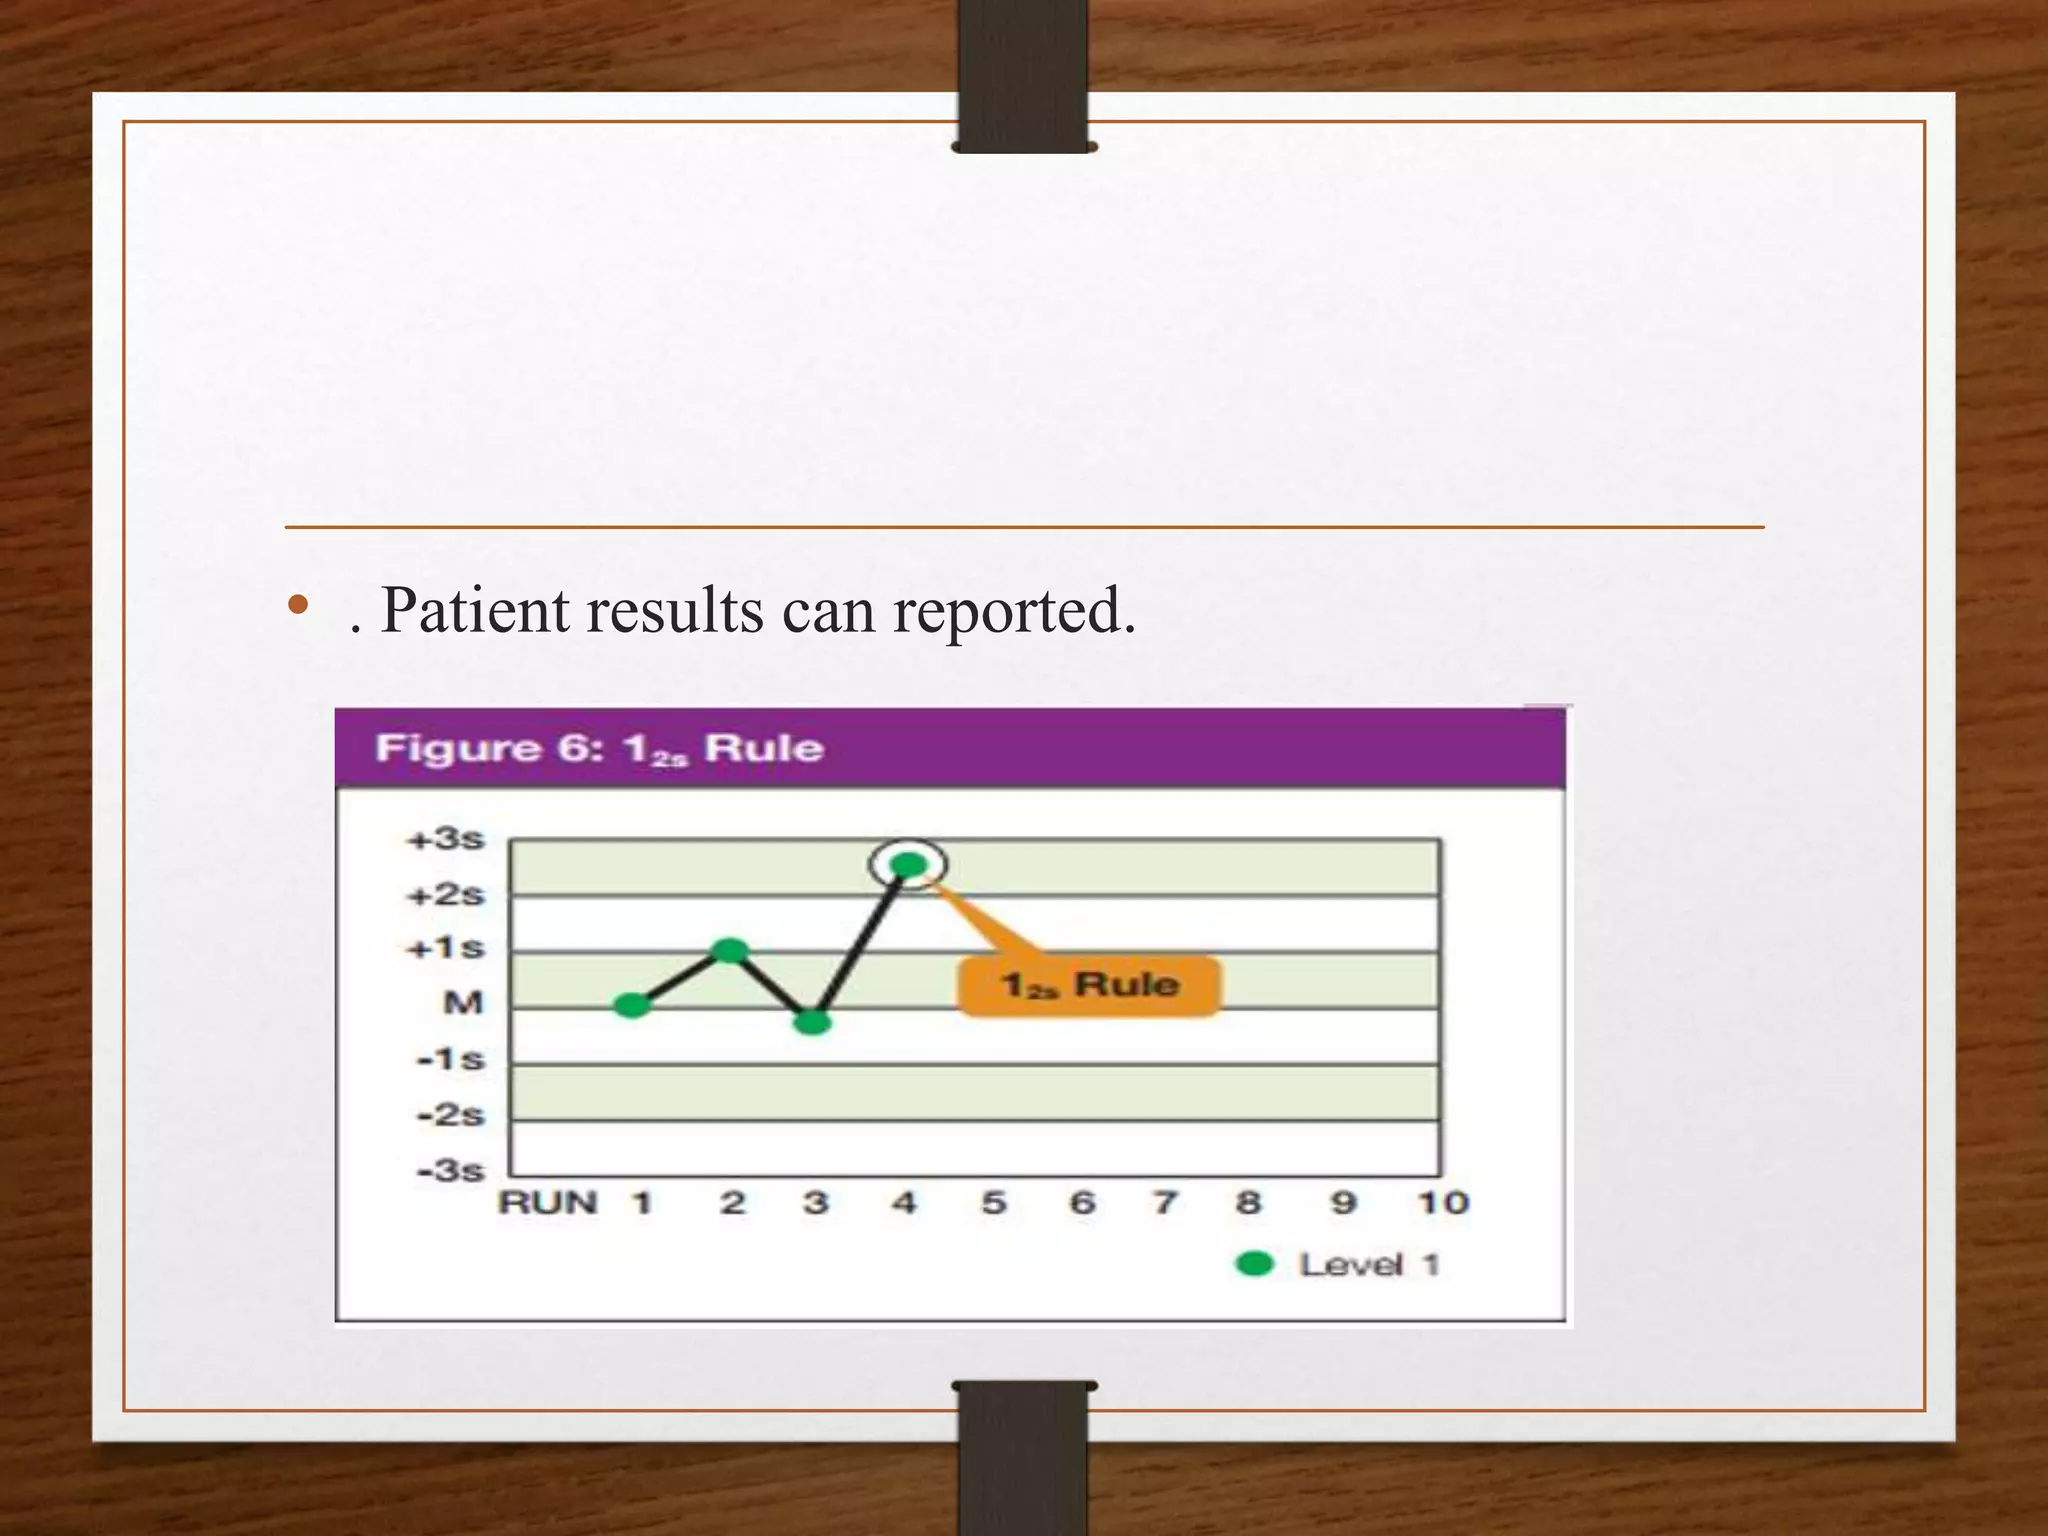
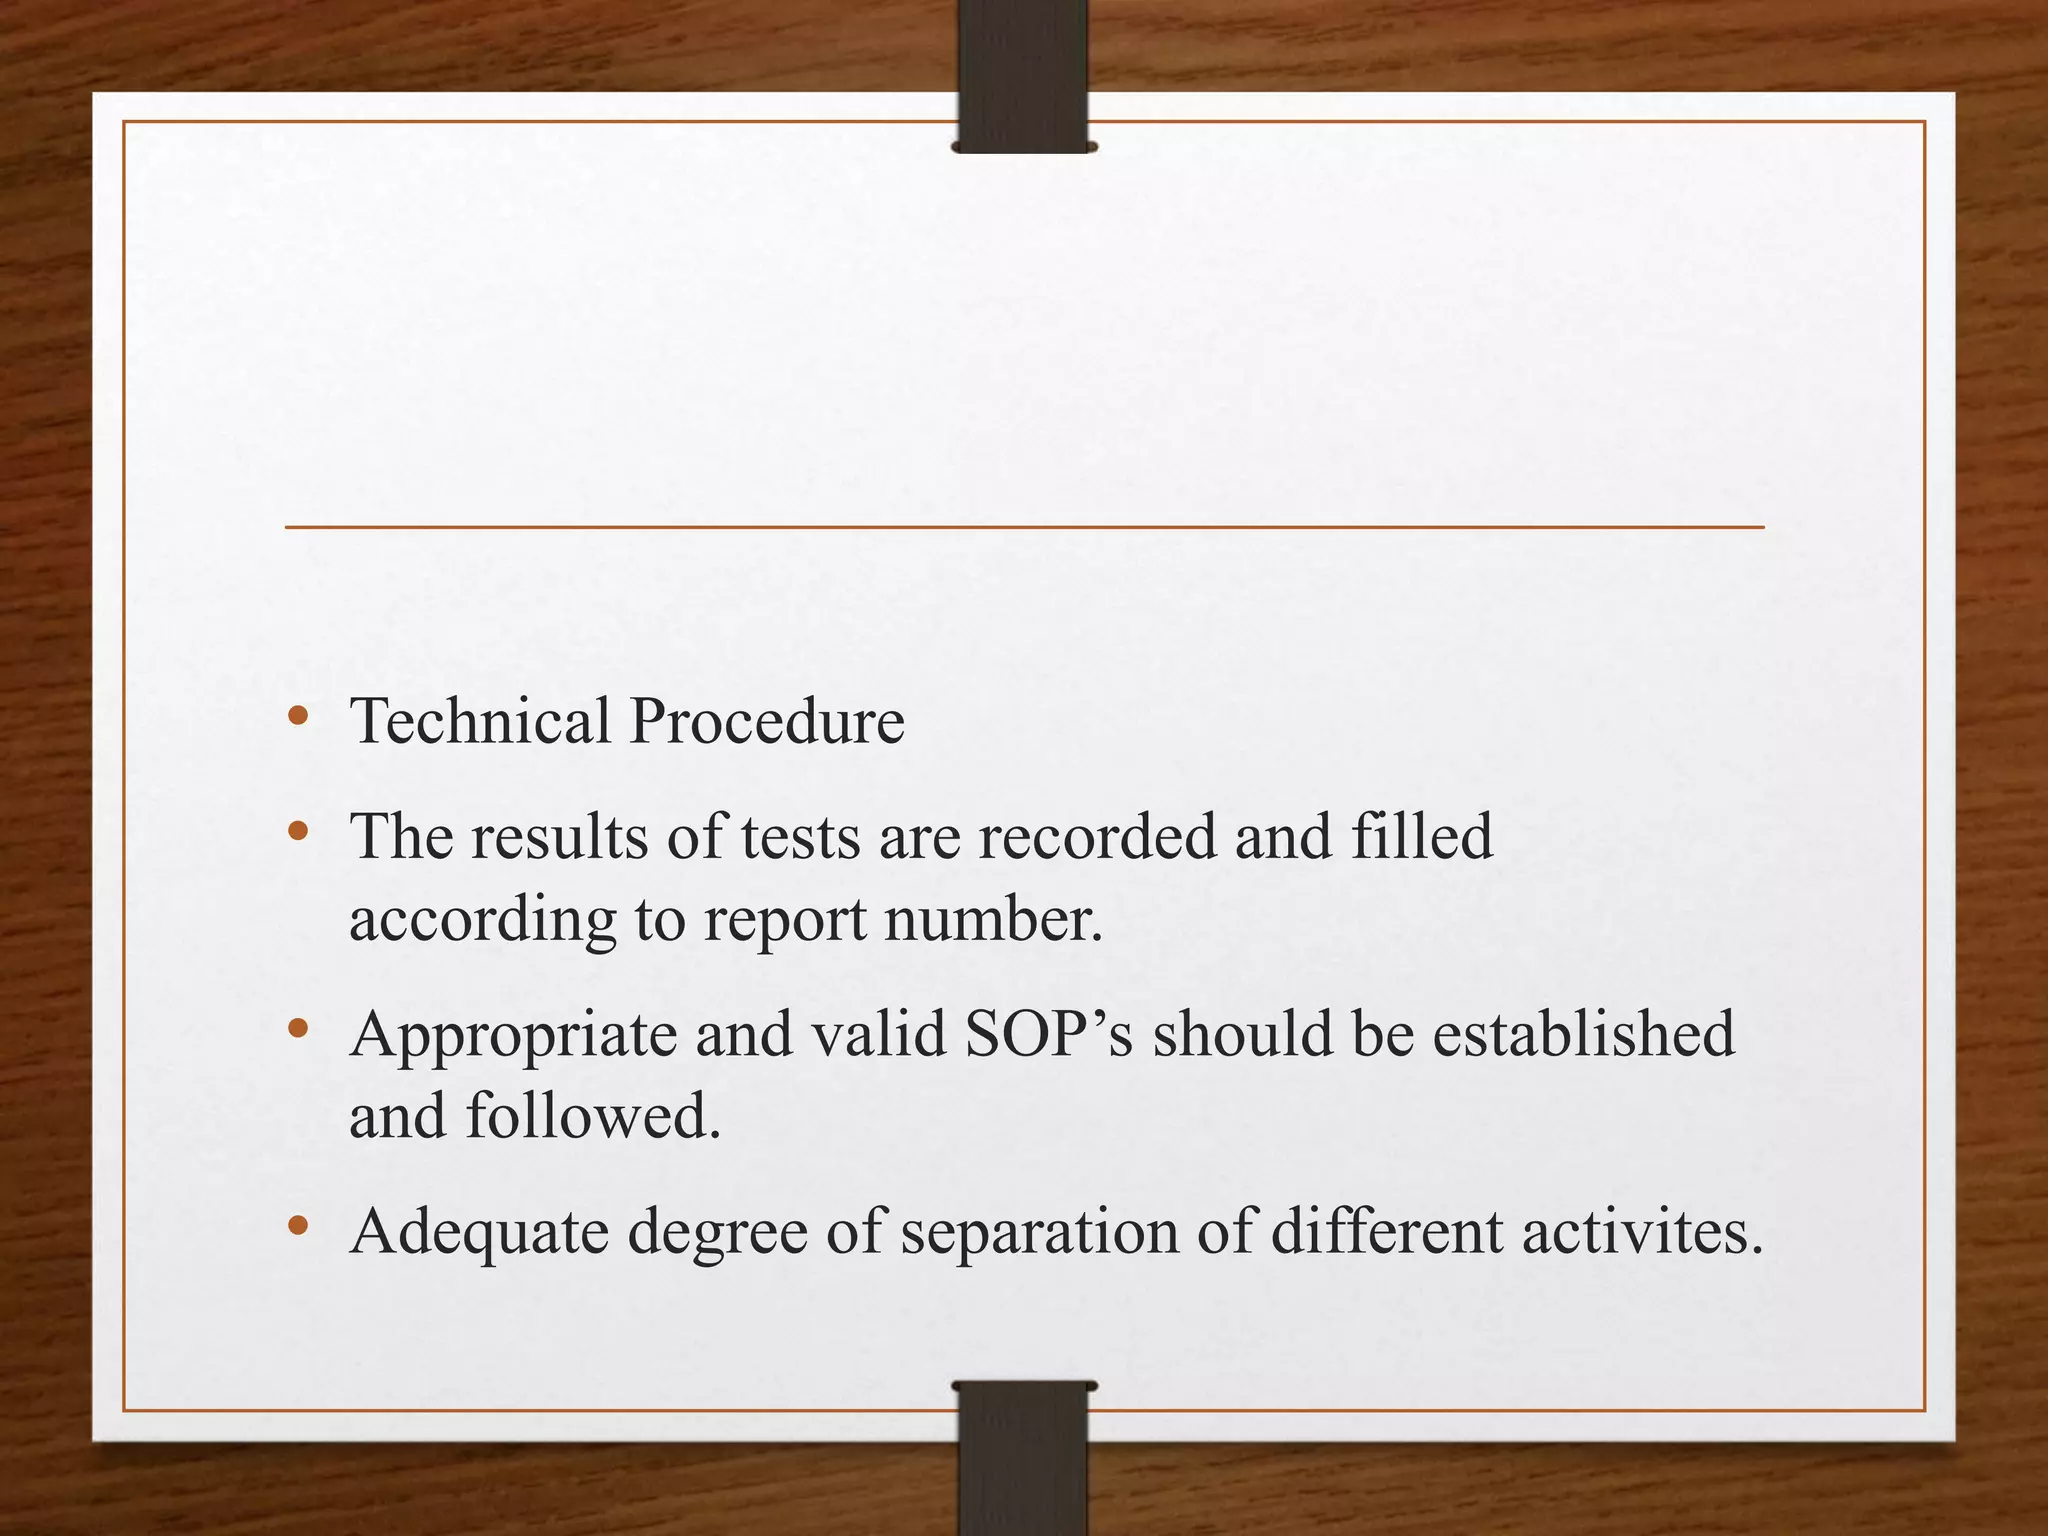
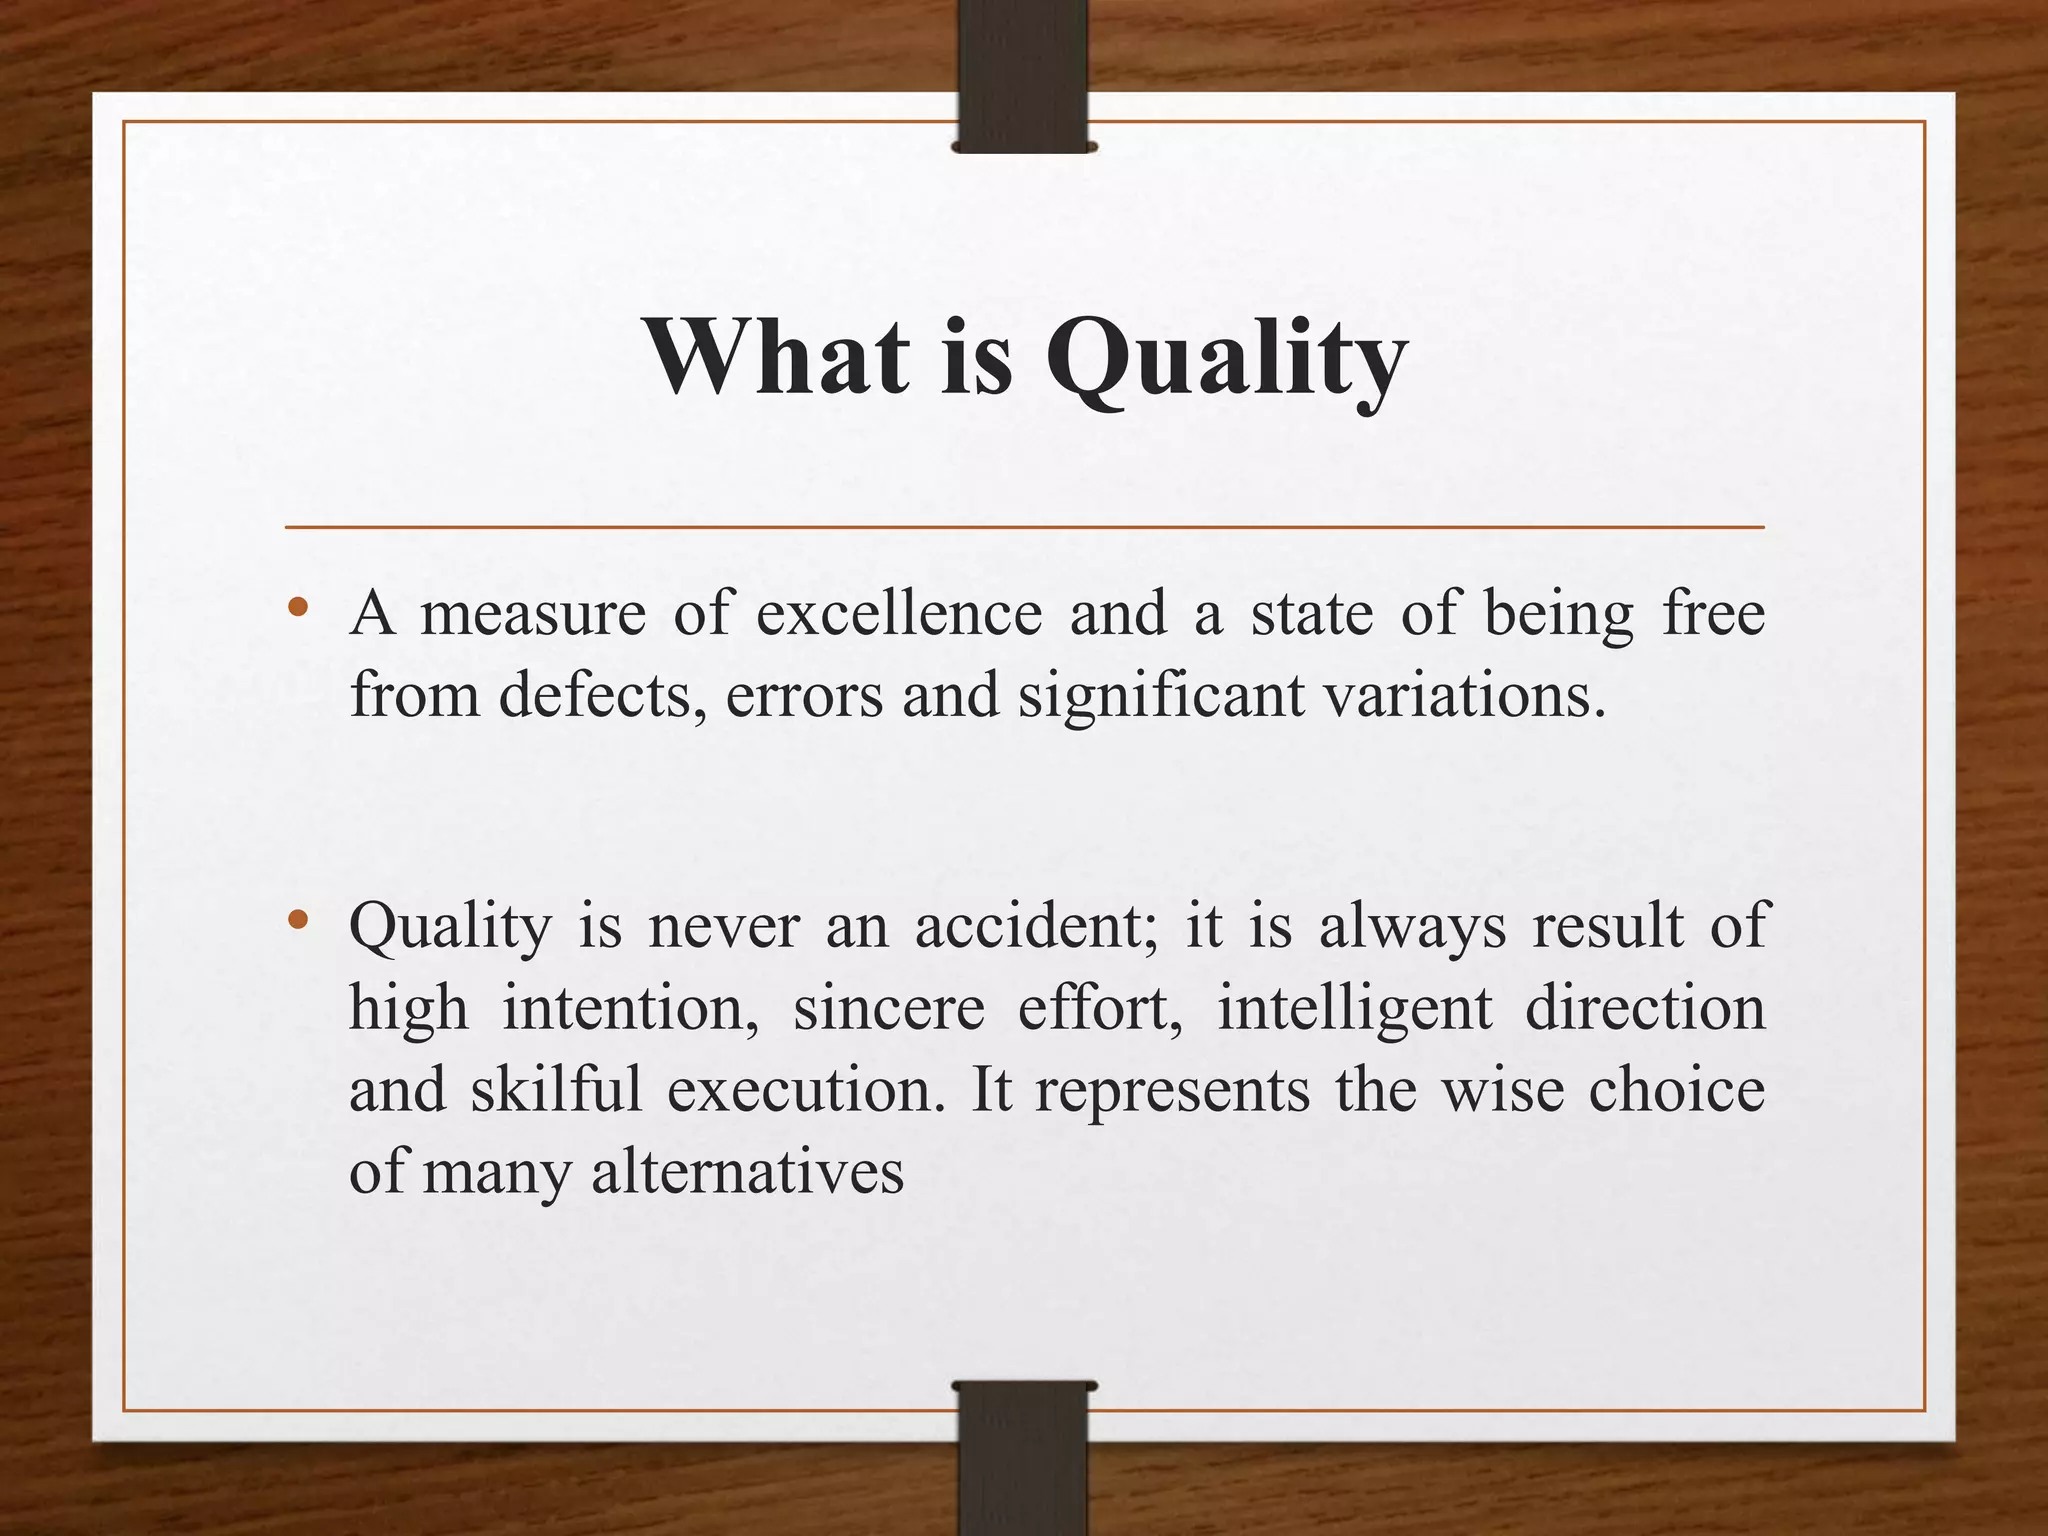
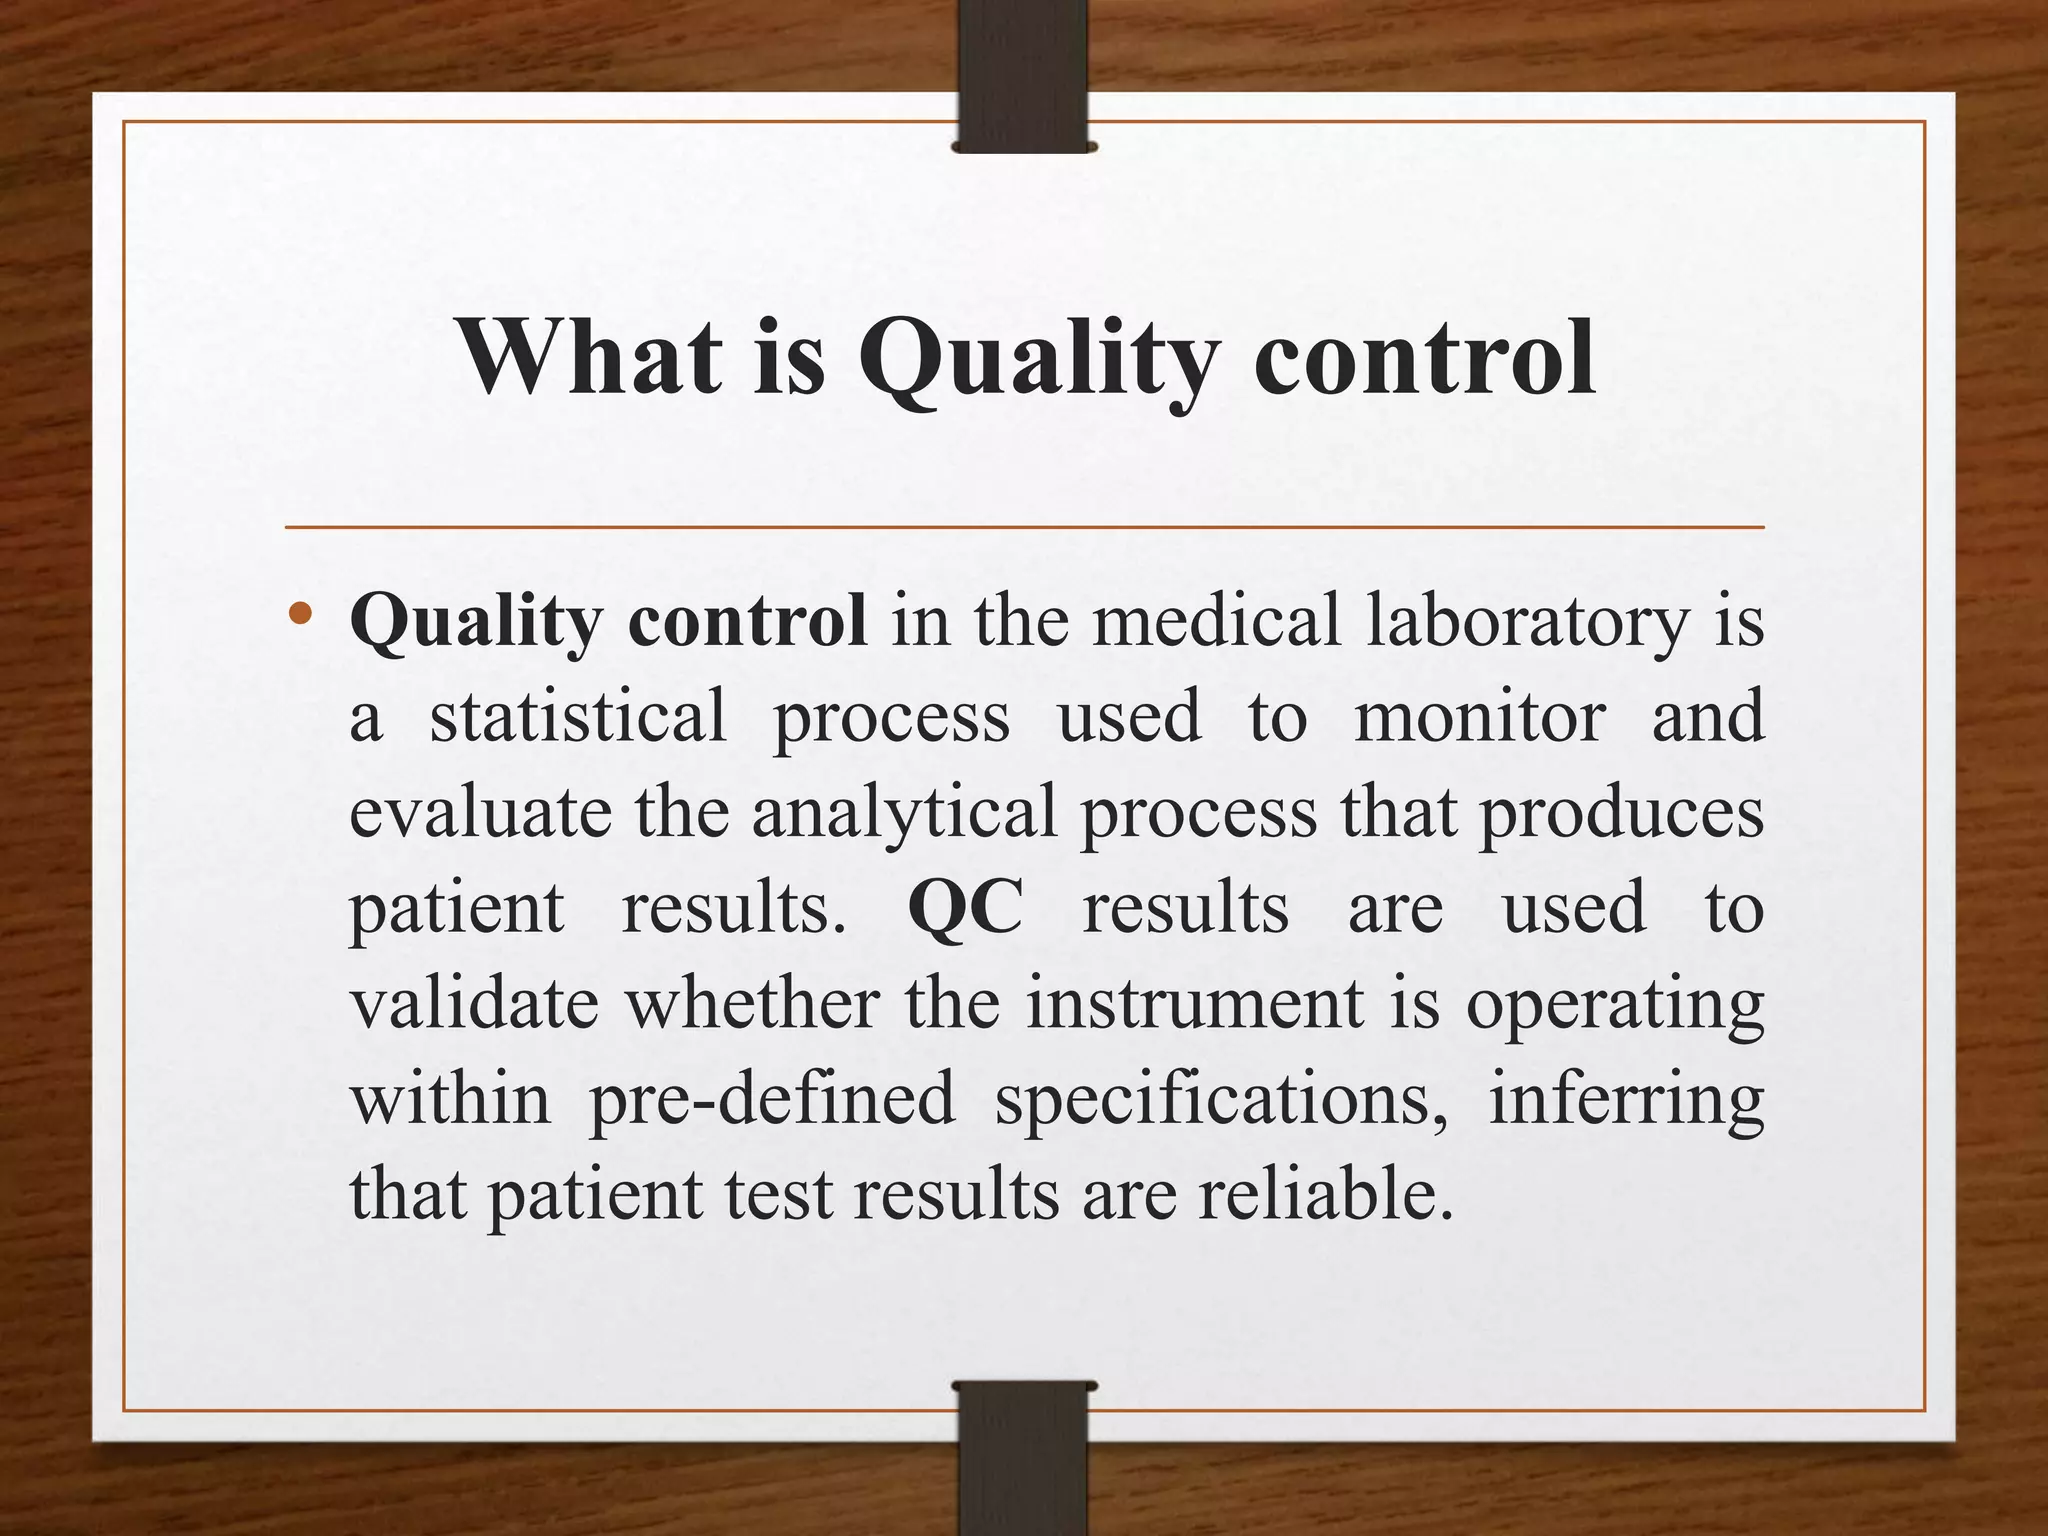
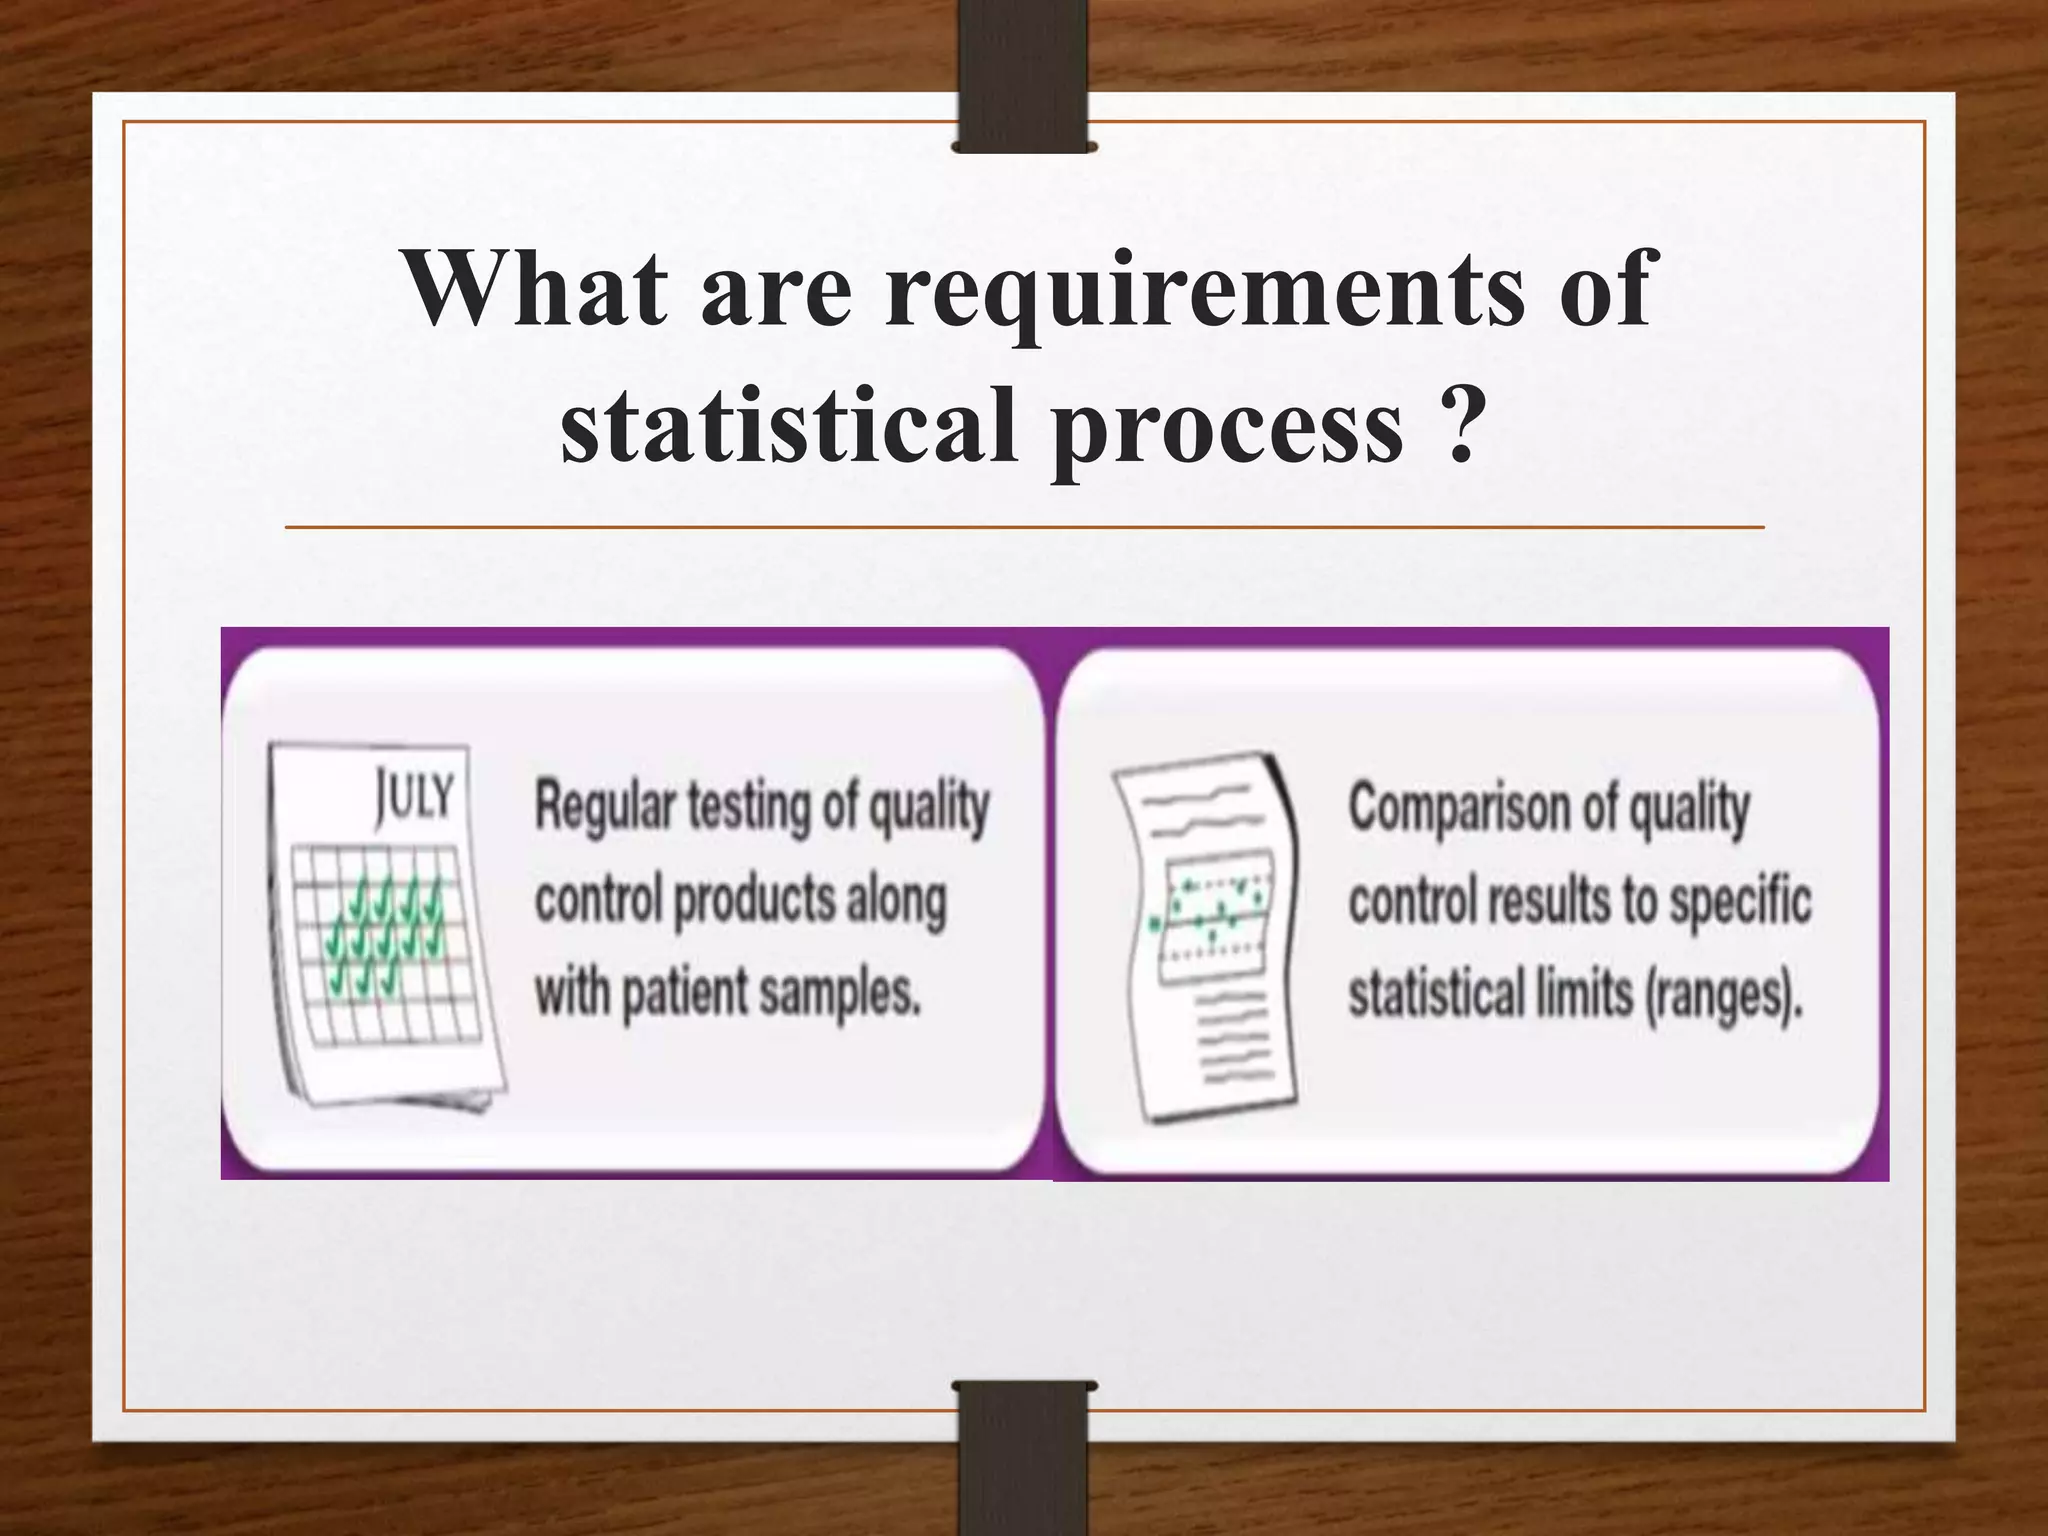
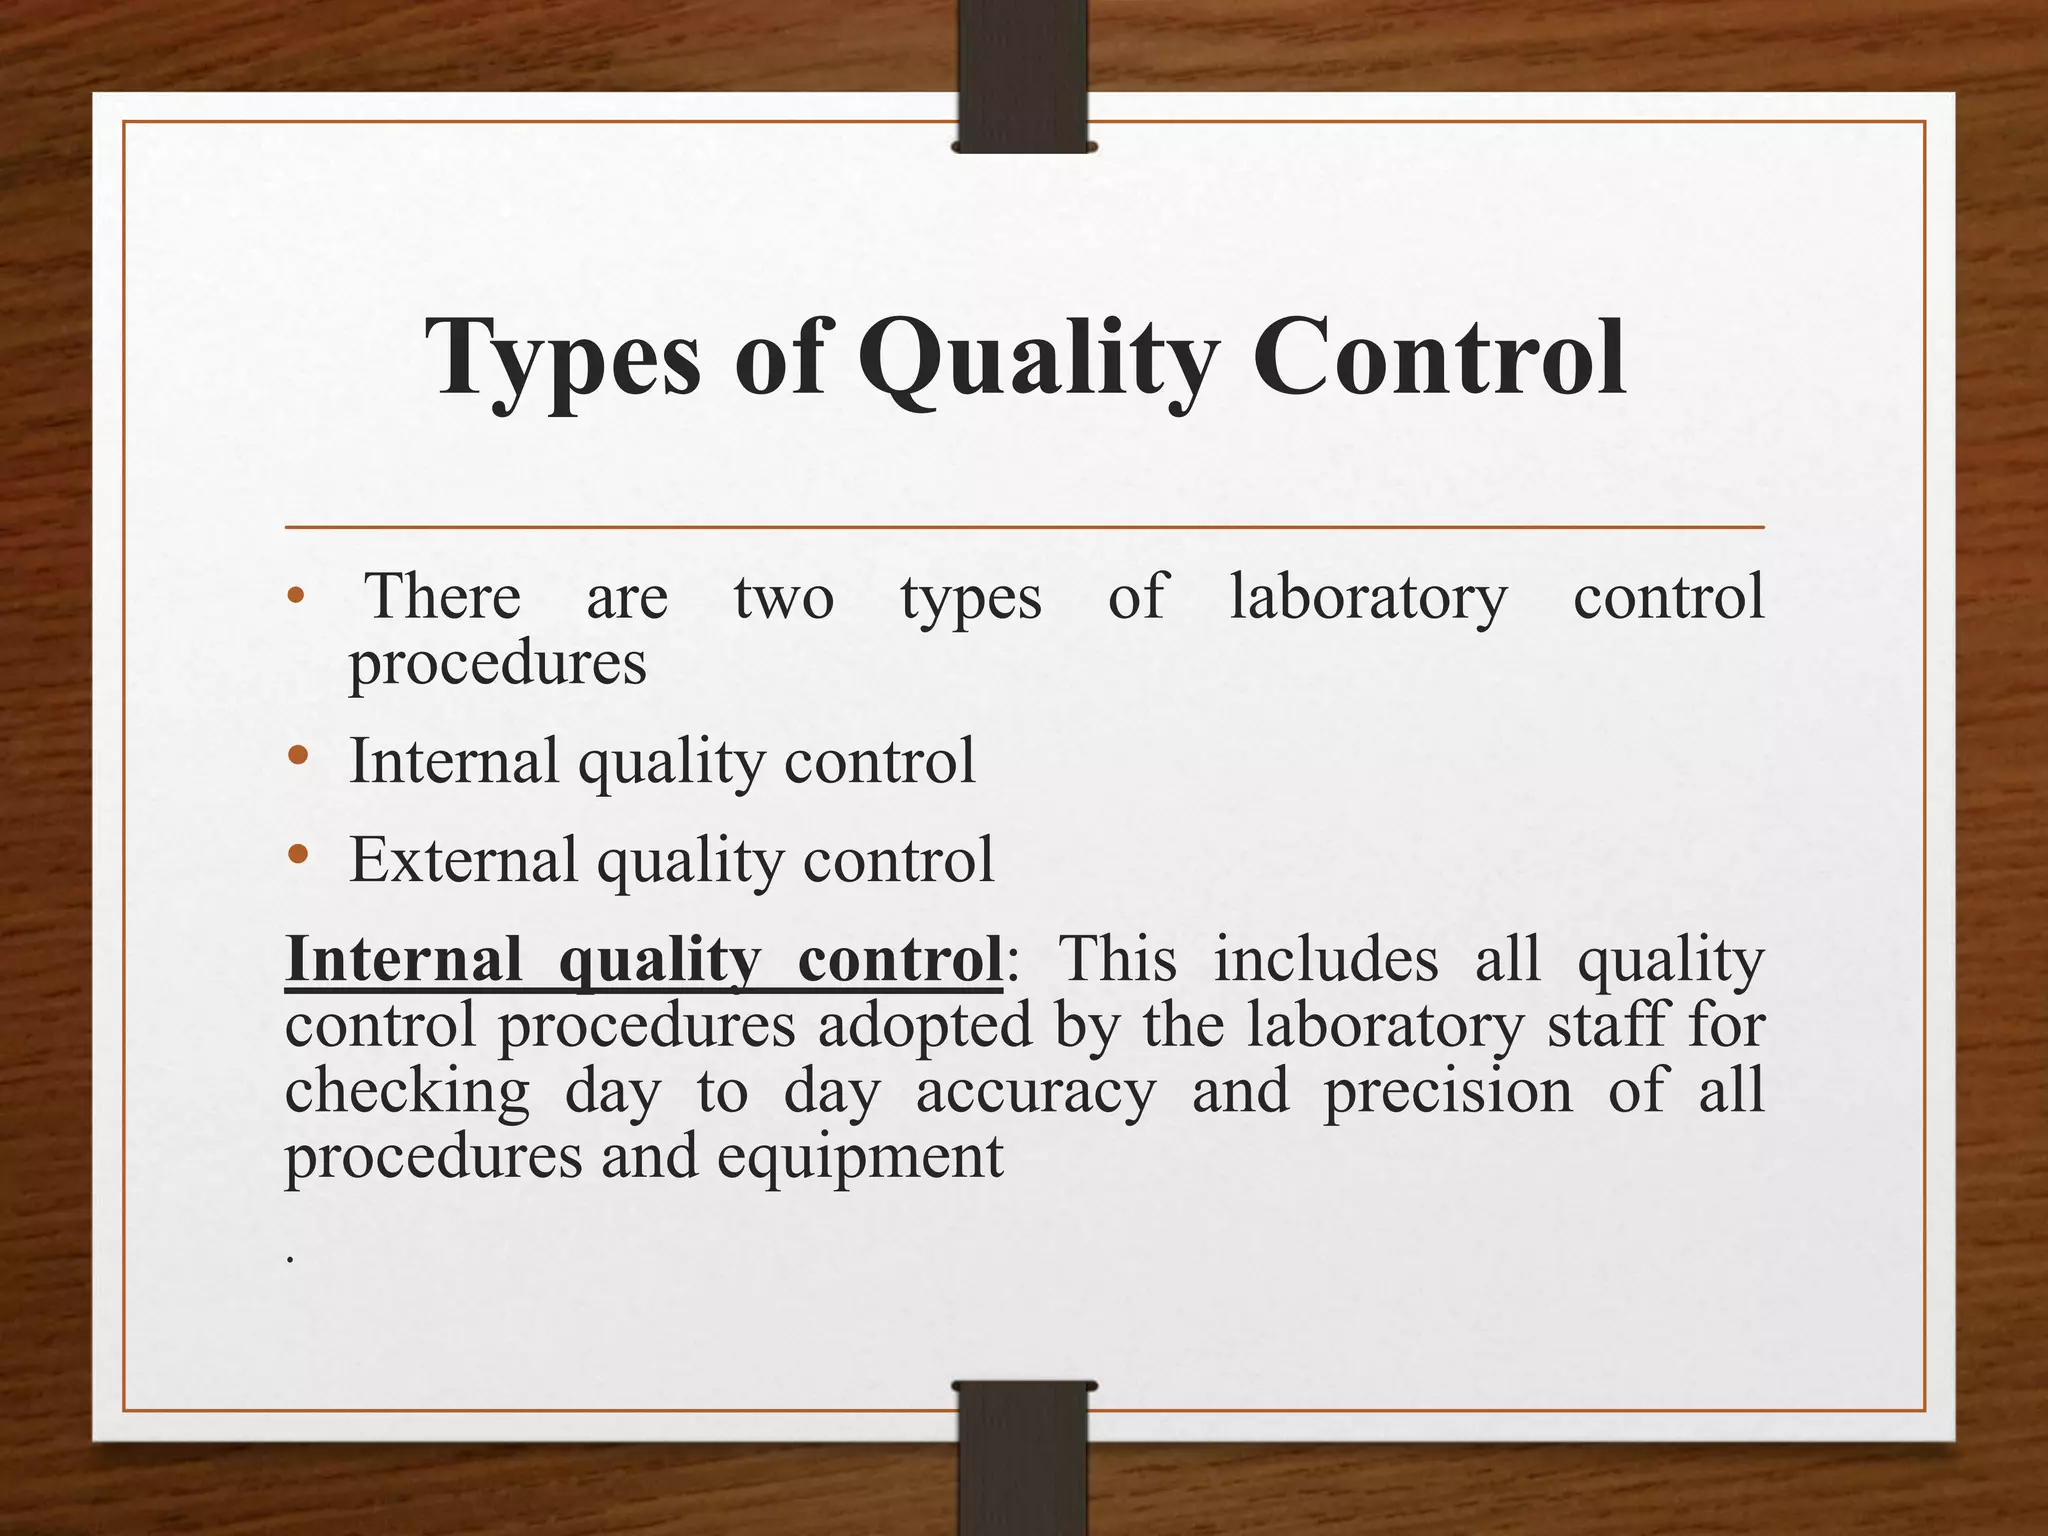
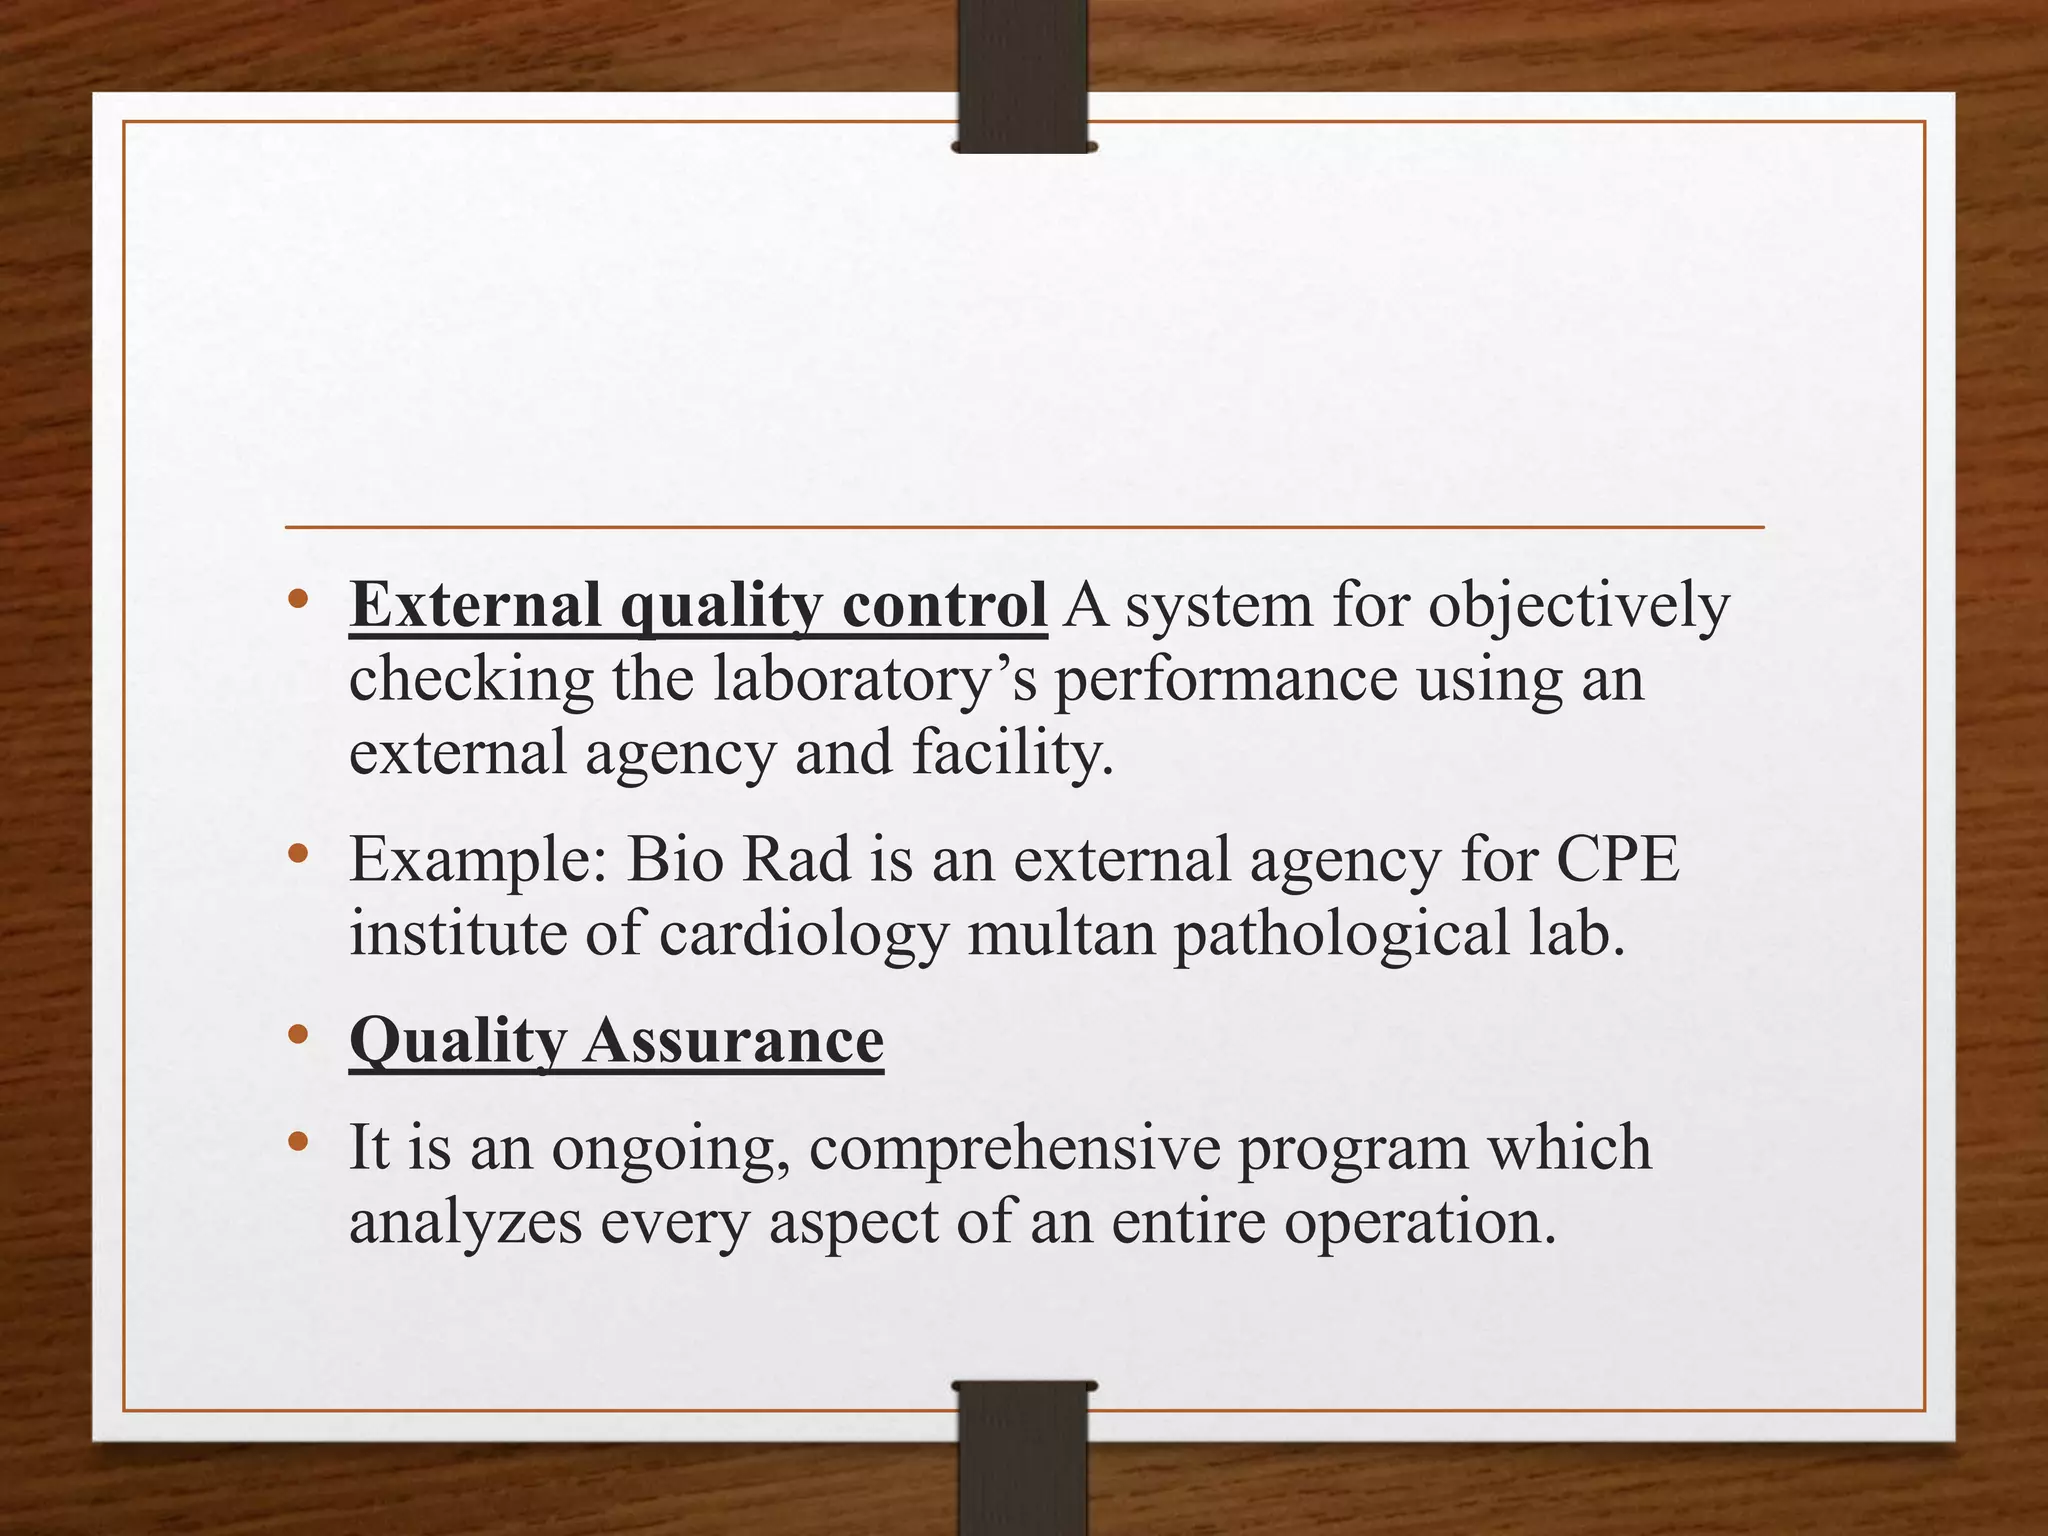
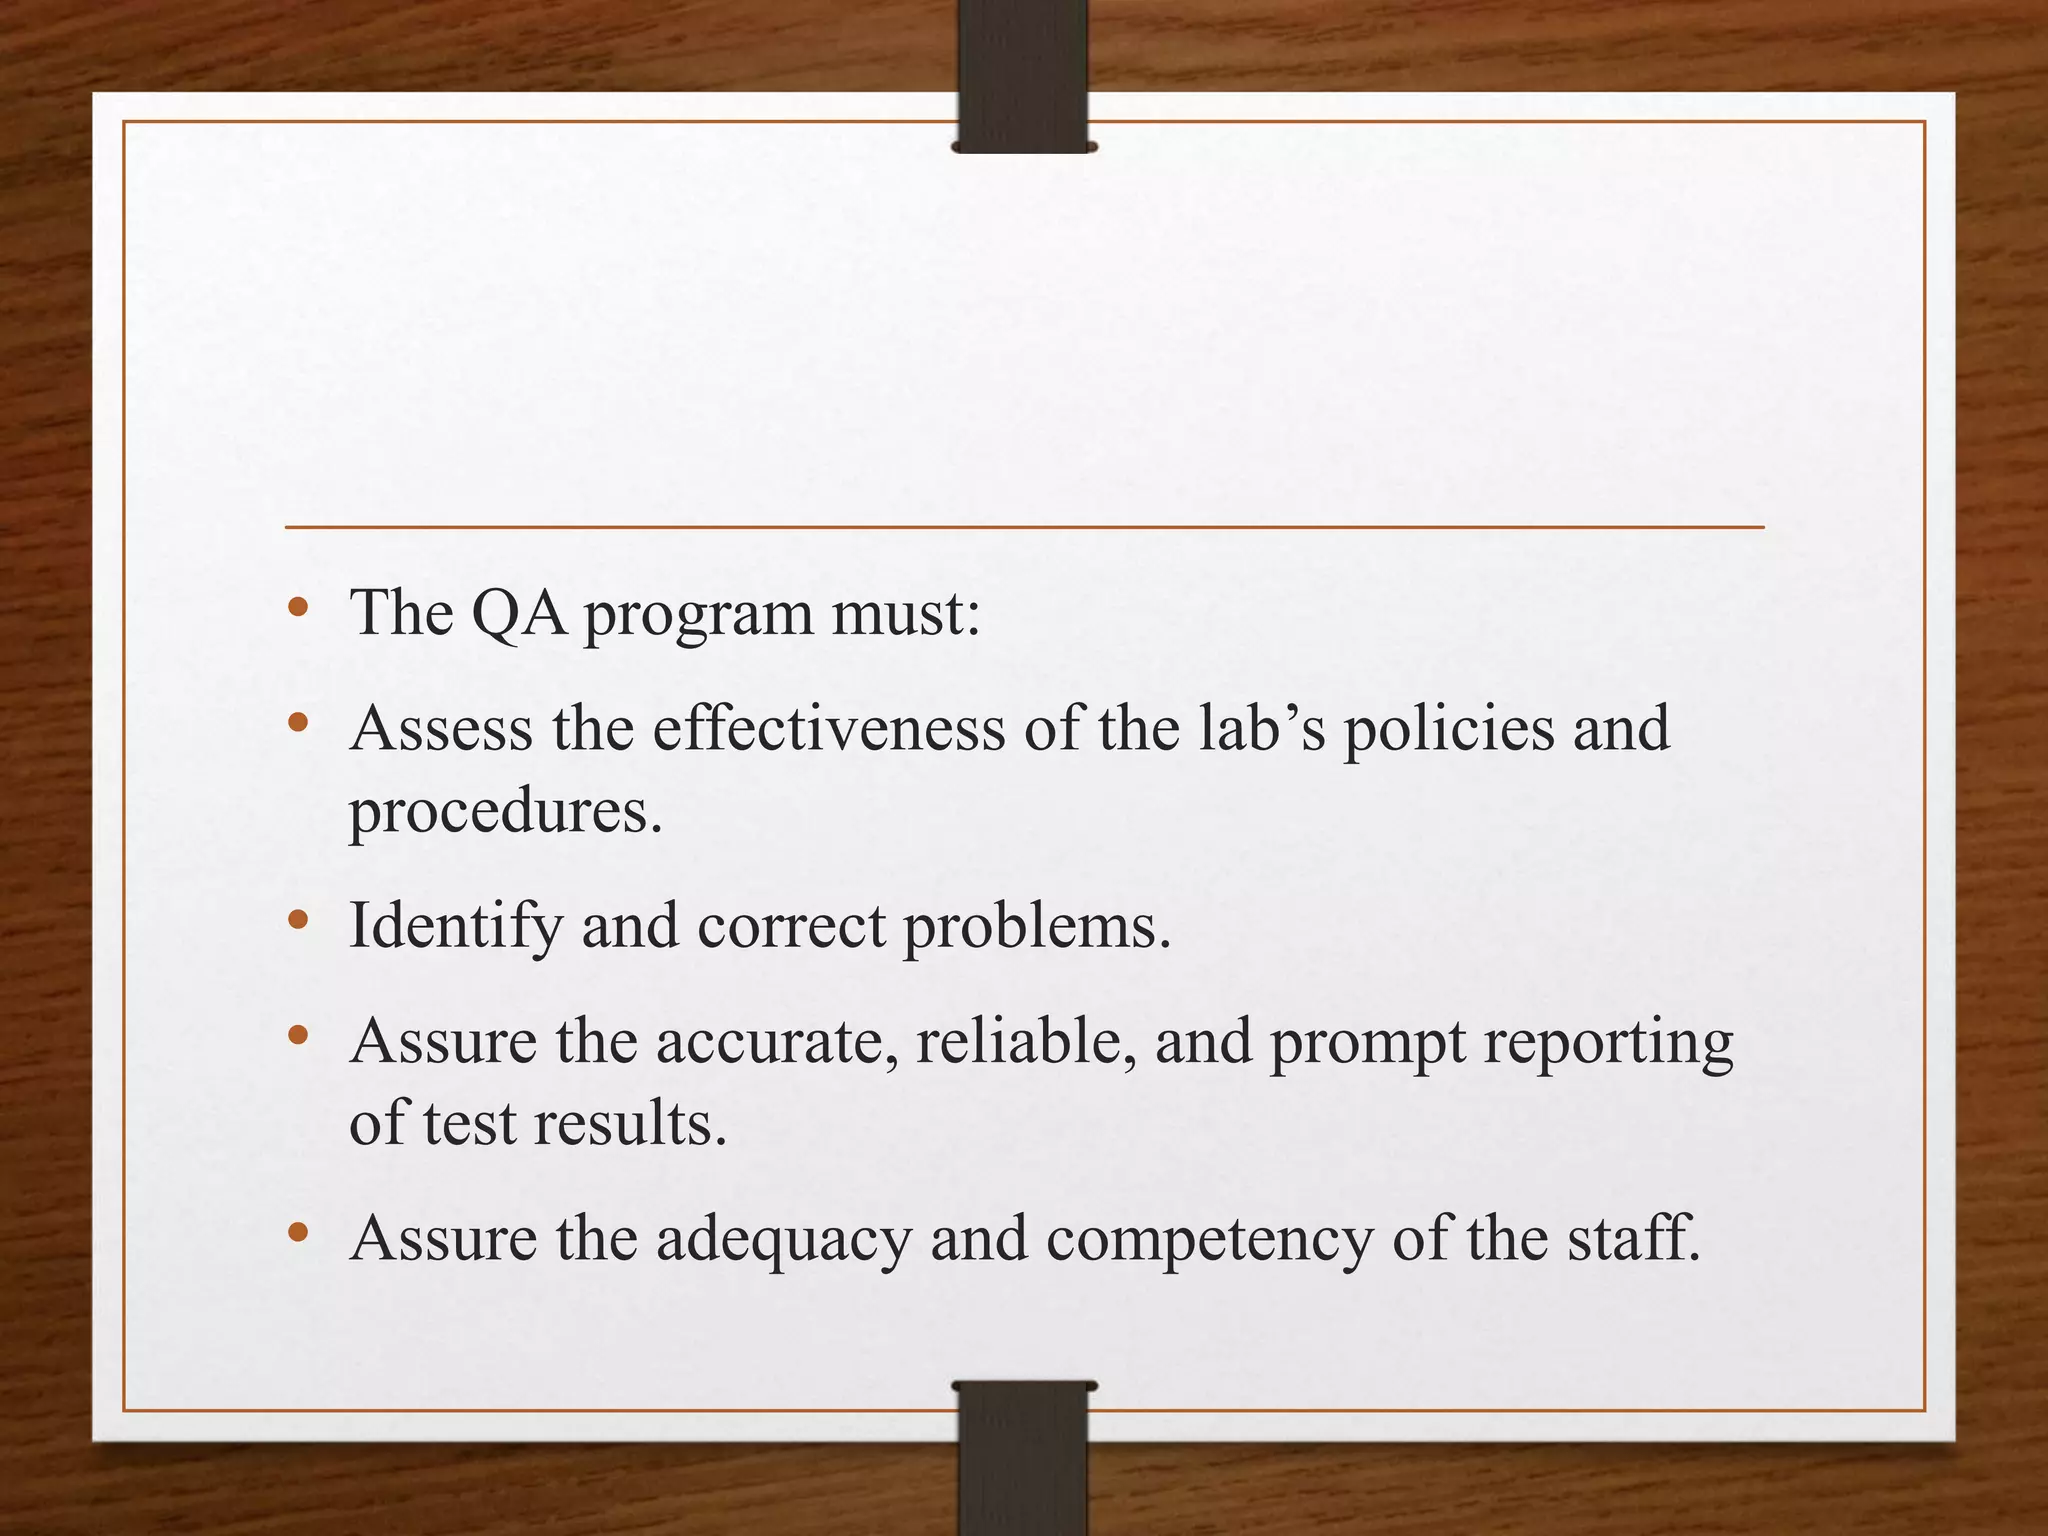
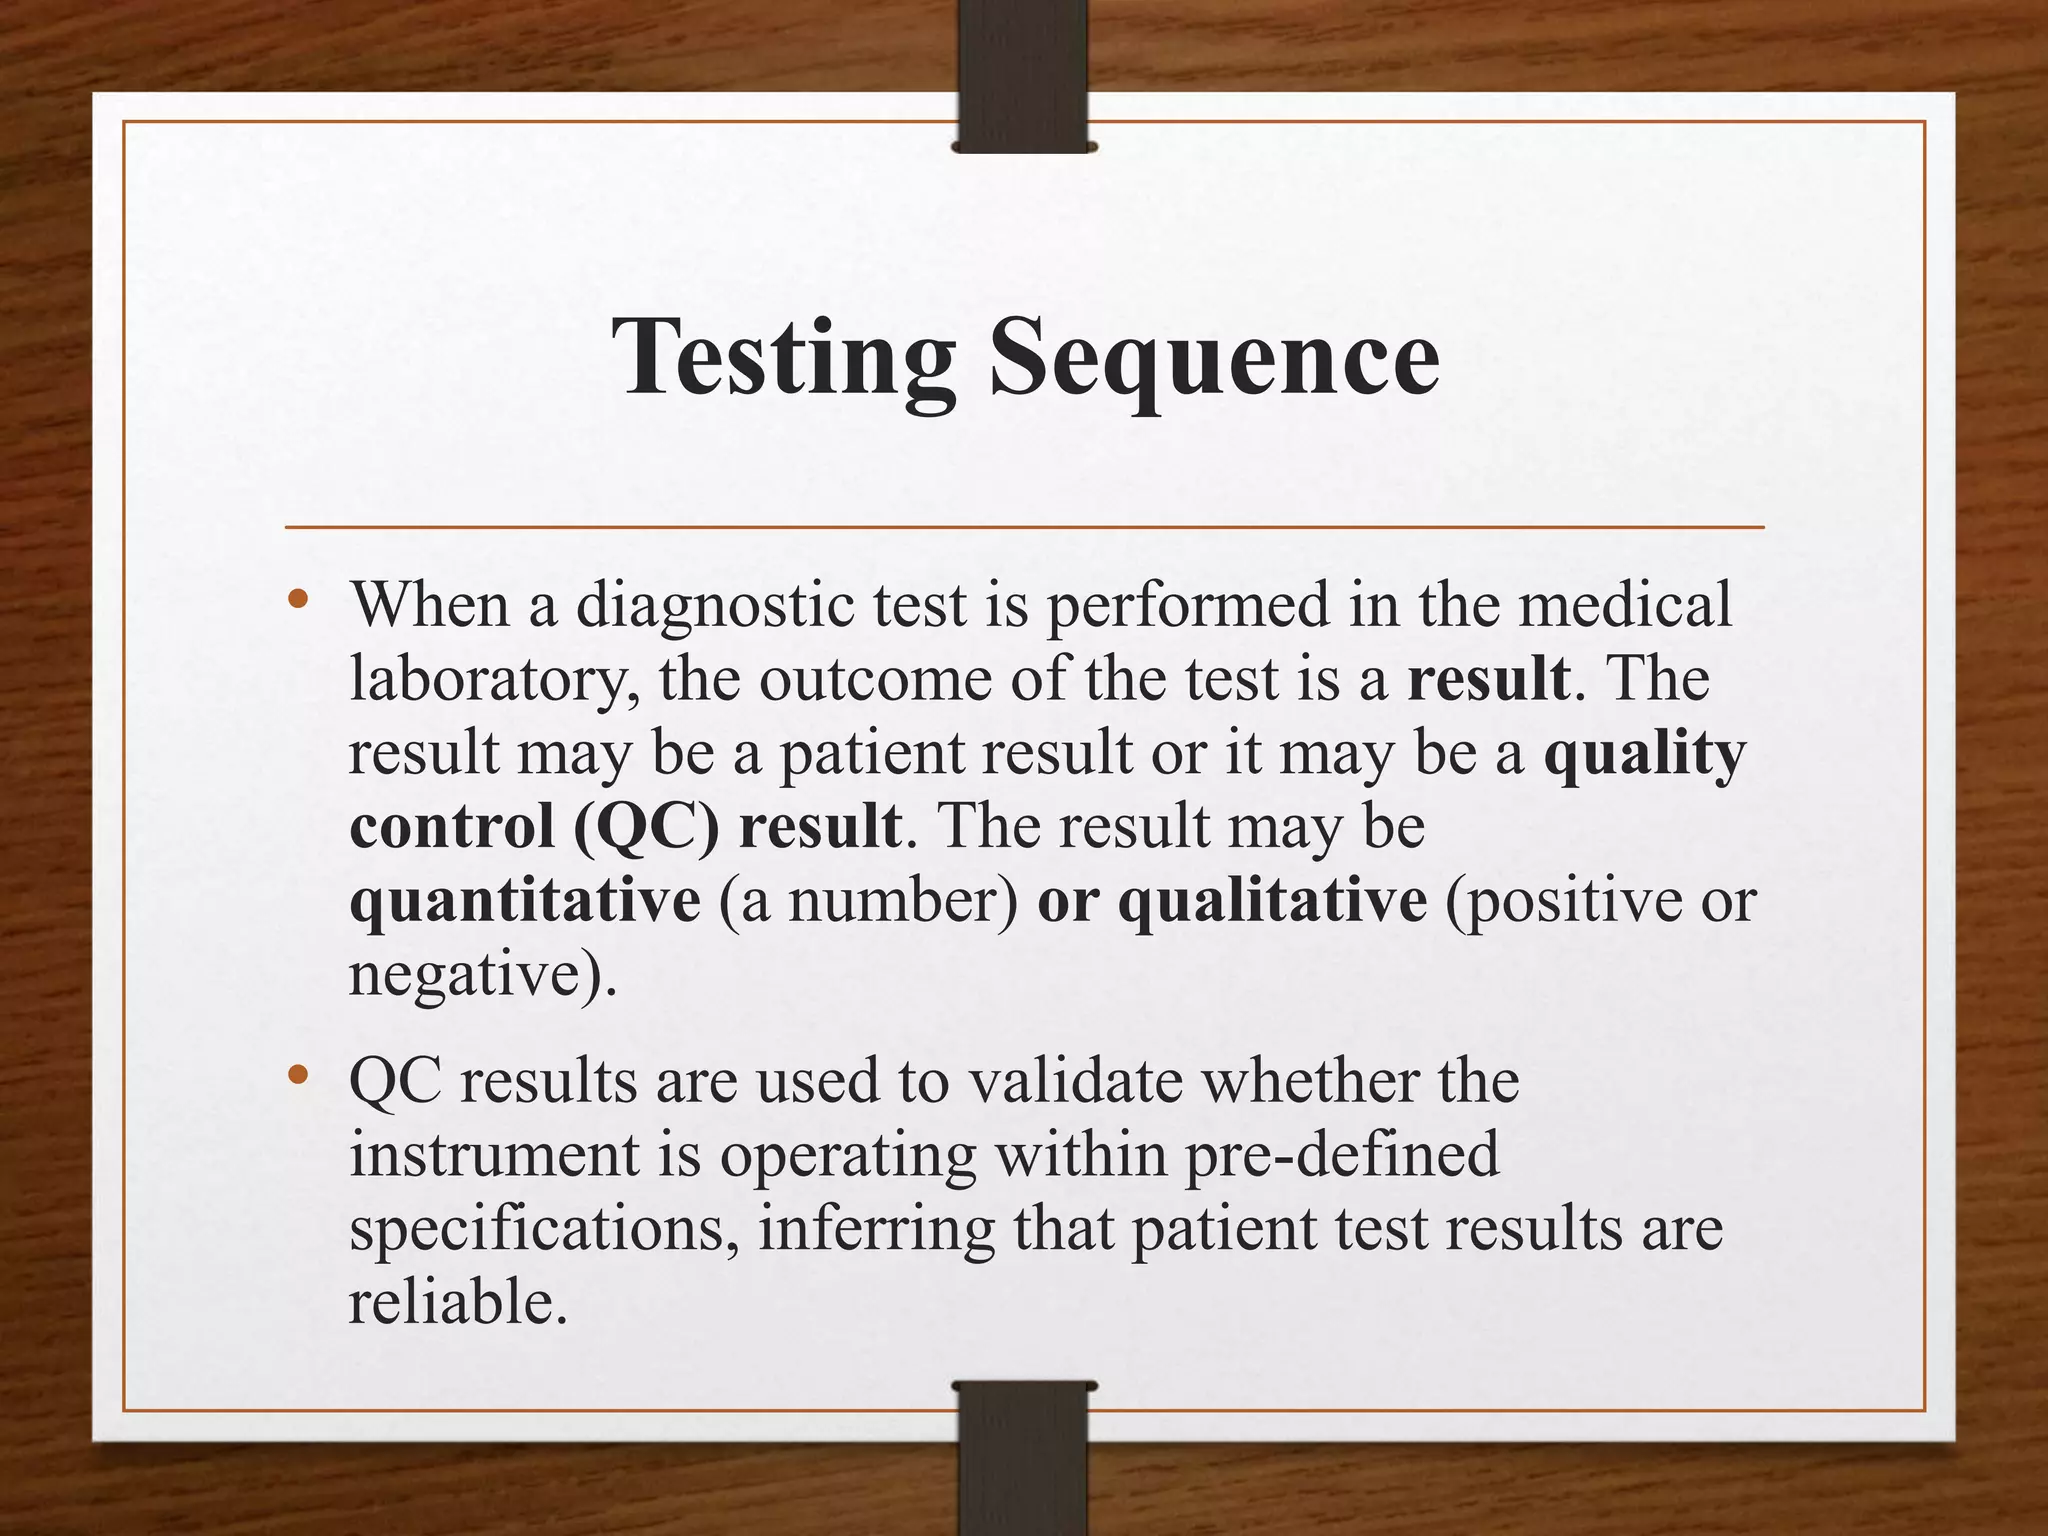
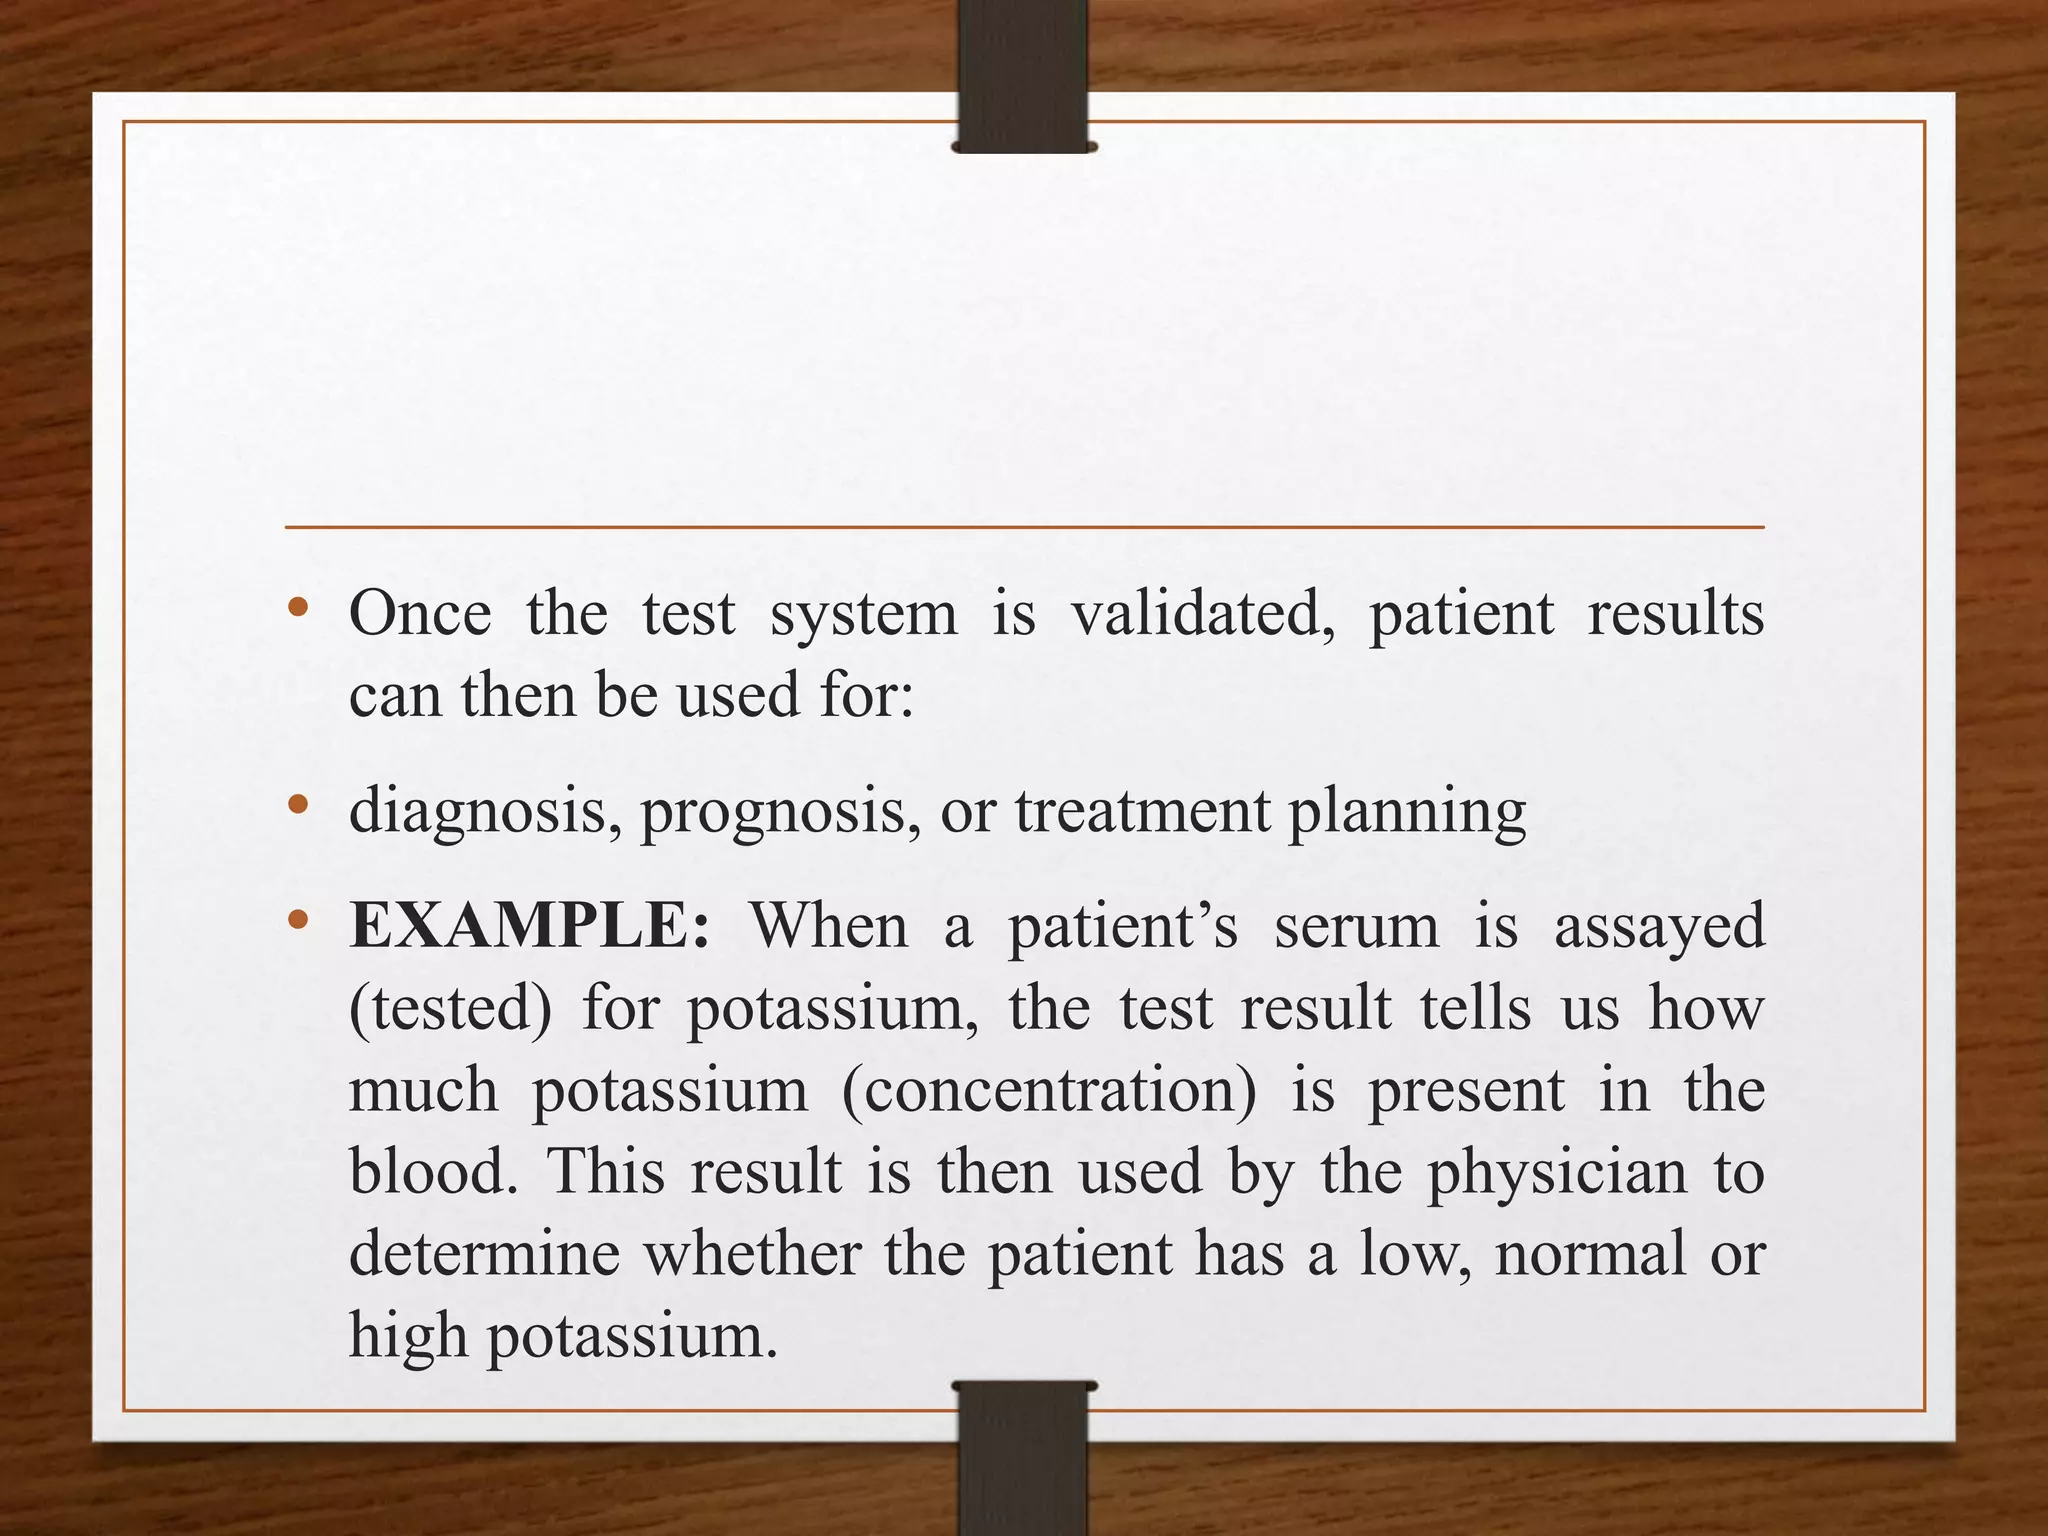
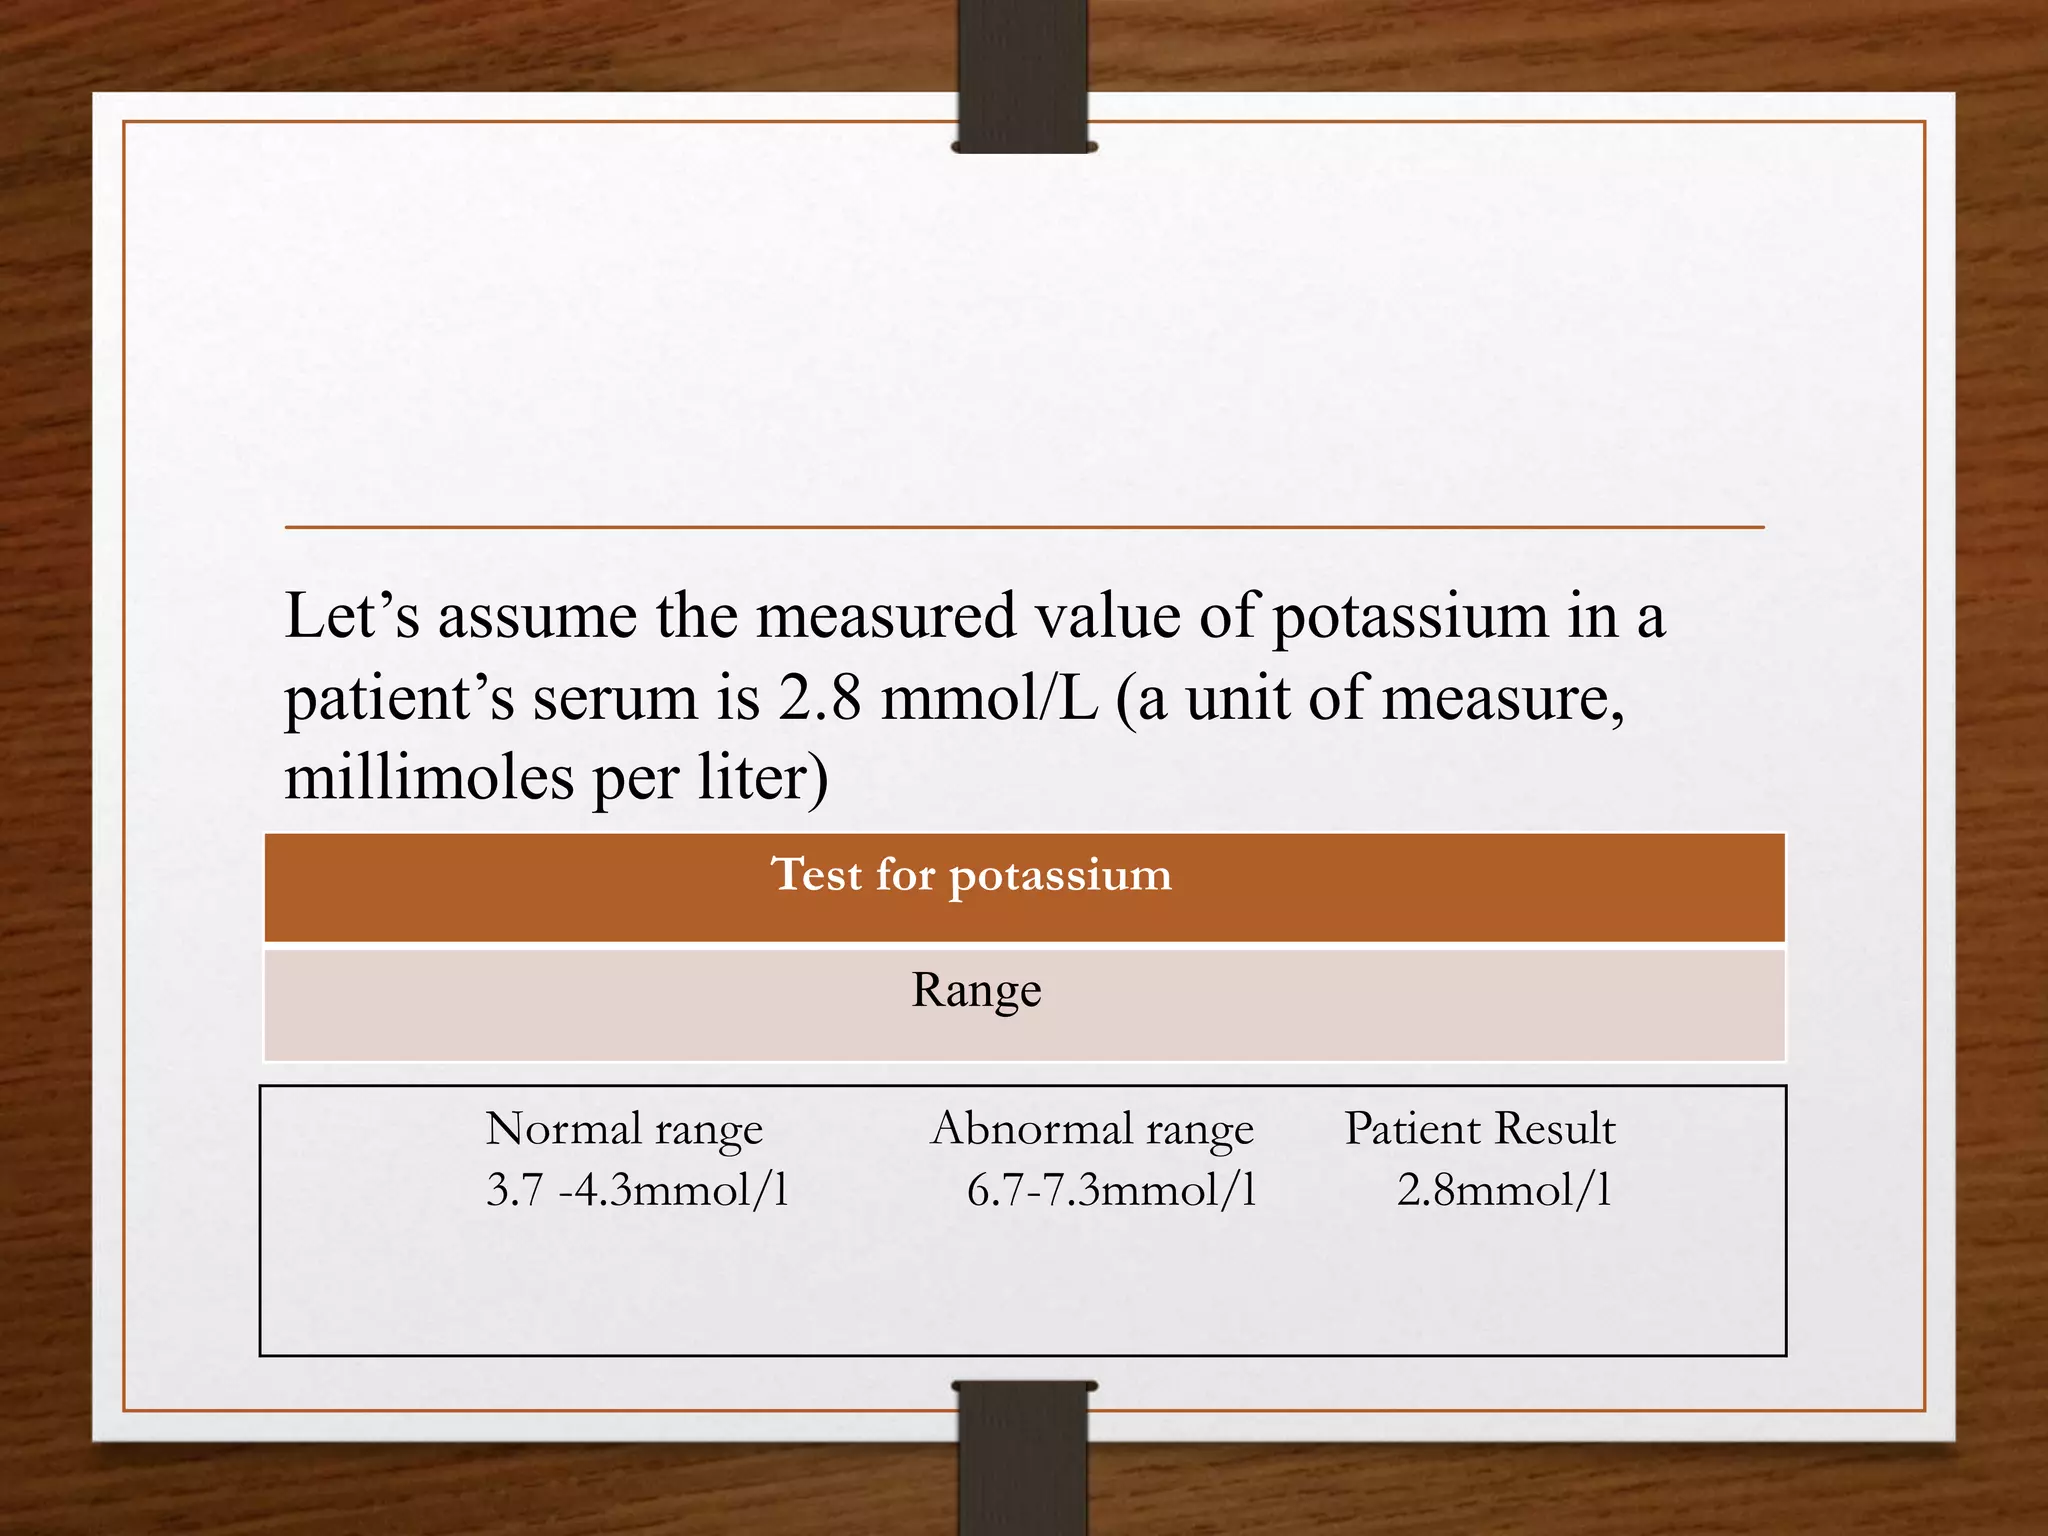
This document discusses quality control in pathological laboratories. It defines quality as being free from defects and errors. Quality control monitors and evaluates analytical testing processes to ensure reliable patient results. There are two types of quality control: internal quality control performed within the lab, and external quality control performed by an outside agency. Quality assurance involves assessing all aspects of the testing process. Regular quality control using control samples is important to validate test systems and equipment are working properly so patient results can be accurately diagnosed and treated.


![Calculation and Use of QC
Statistics
• QC statistics for each test performed in the laboratory
are calculated from the QC database collected by
regular testing of control products.
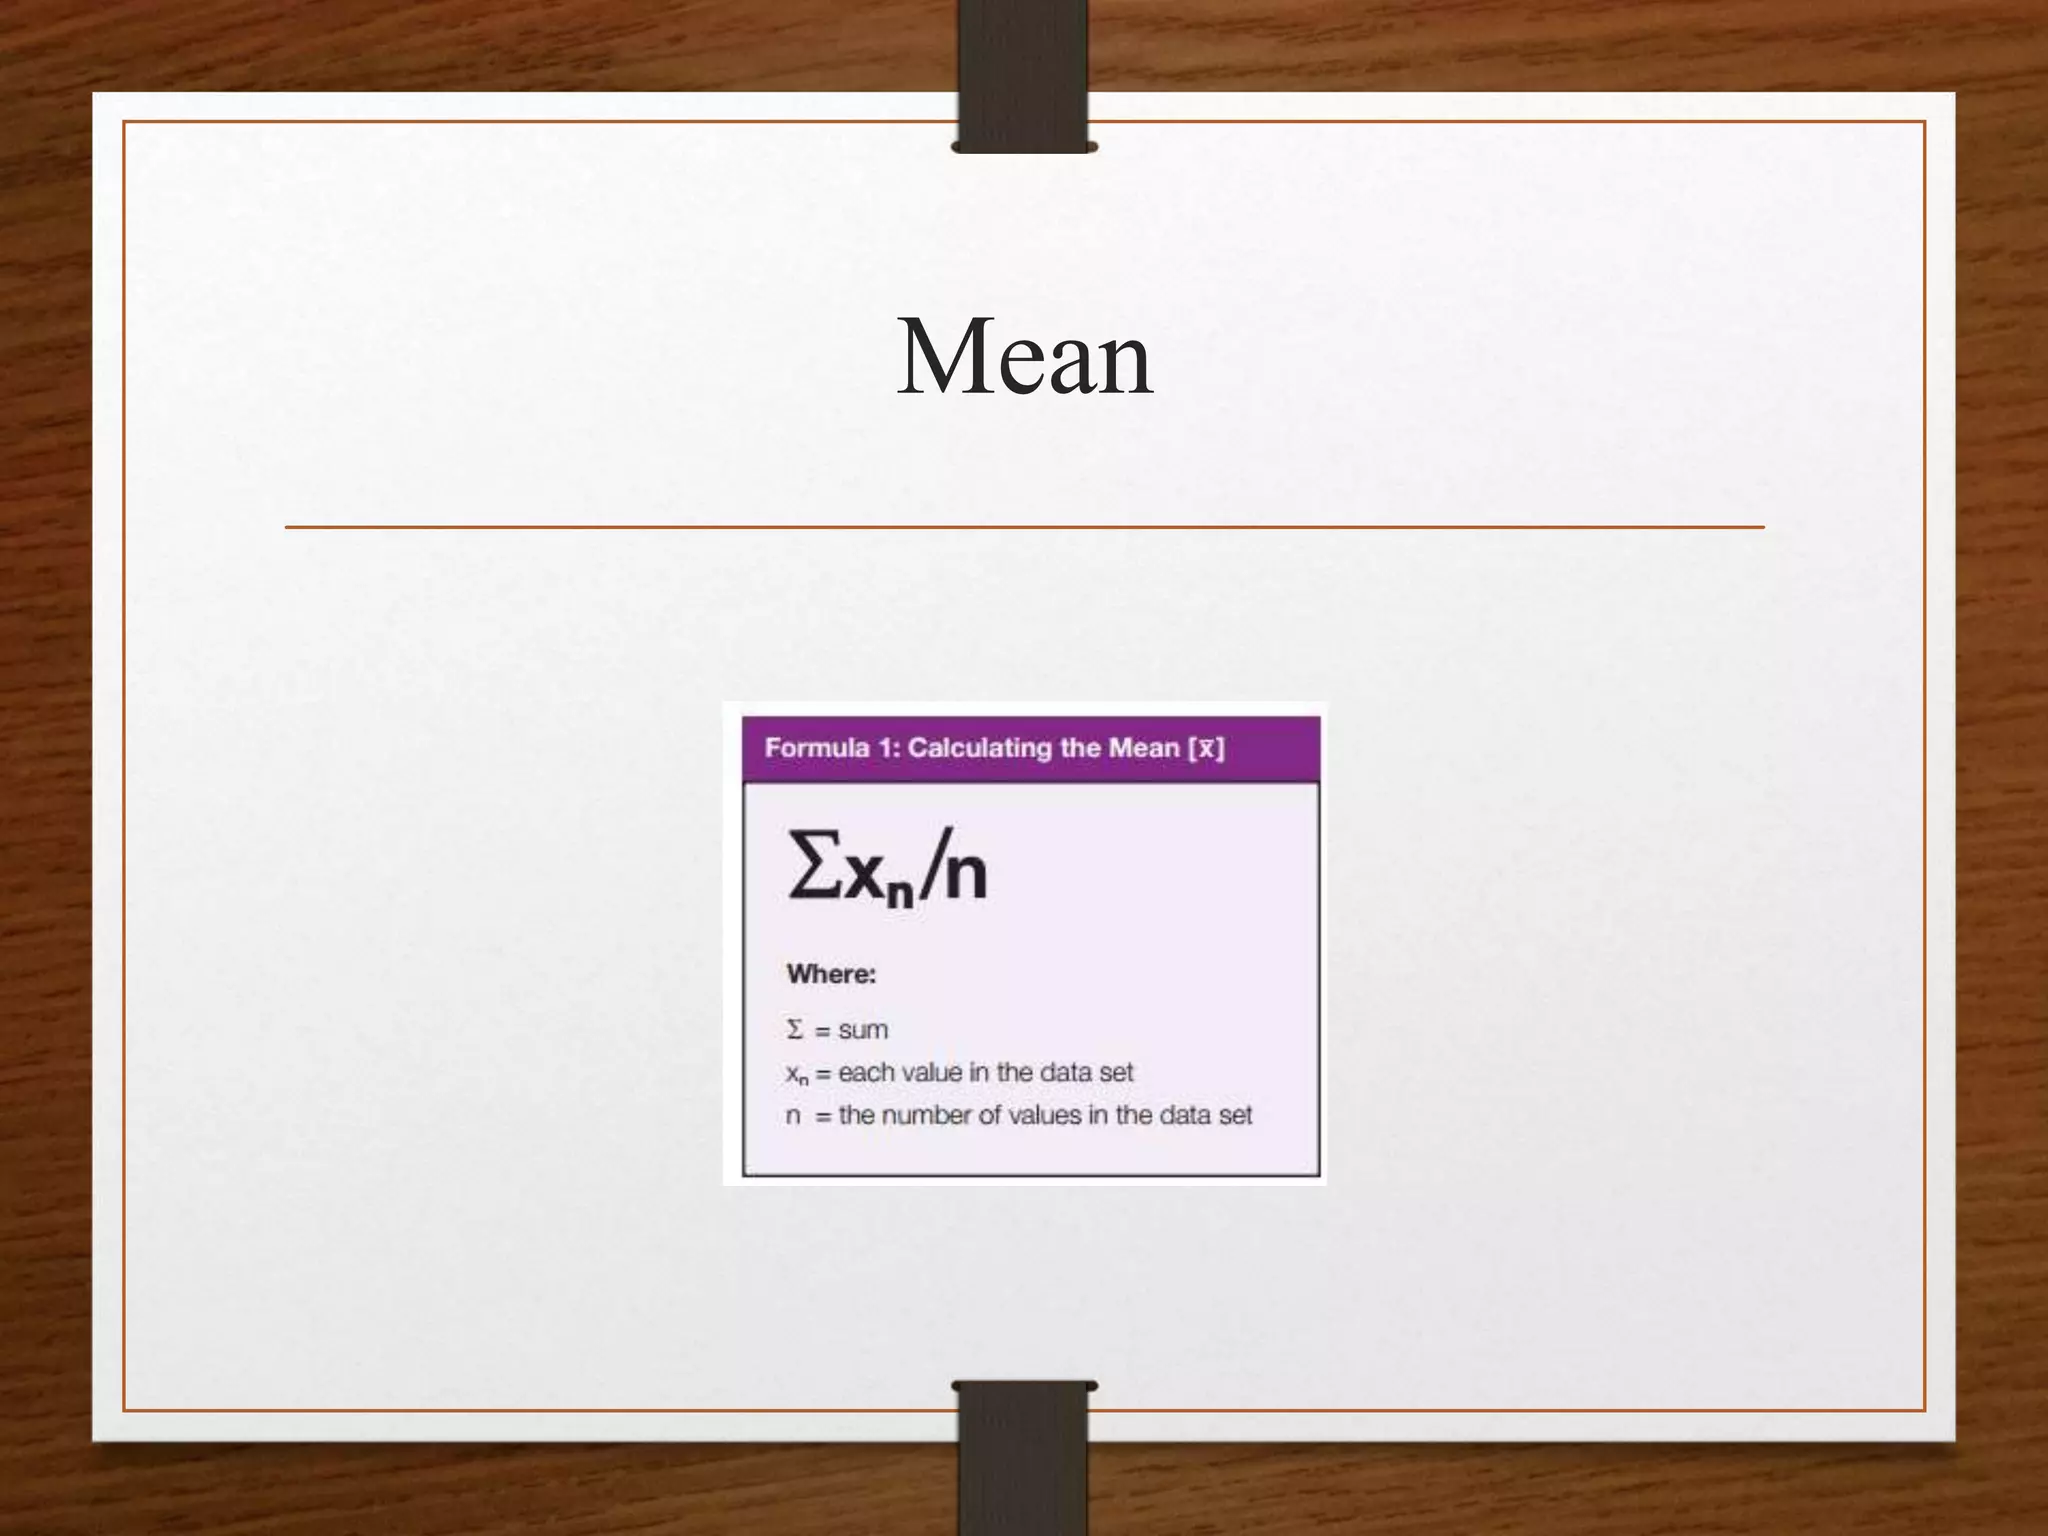
• The most fundamental statistics used by the laboratory
are the mean [x] and standard deviation [s].
• Mean
• The mean (or average) is the laboratory’s best estimate
of the analyte’s true value for a specific level of control.](https://image.slidesharecdn.com/qcpptcpe-170913185858/75/Quality-Control-in-Pathological-Laboratory-32-2048.jpg)
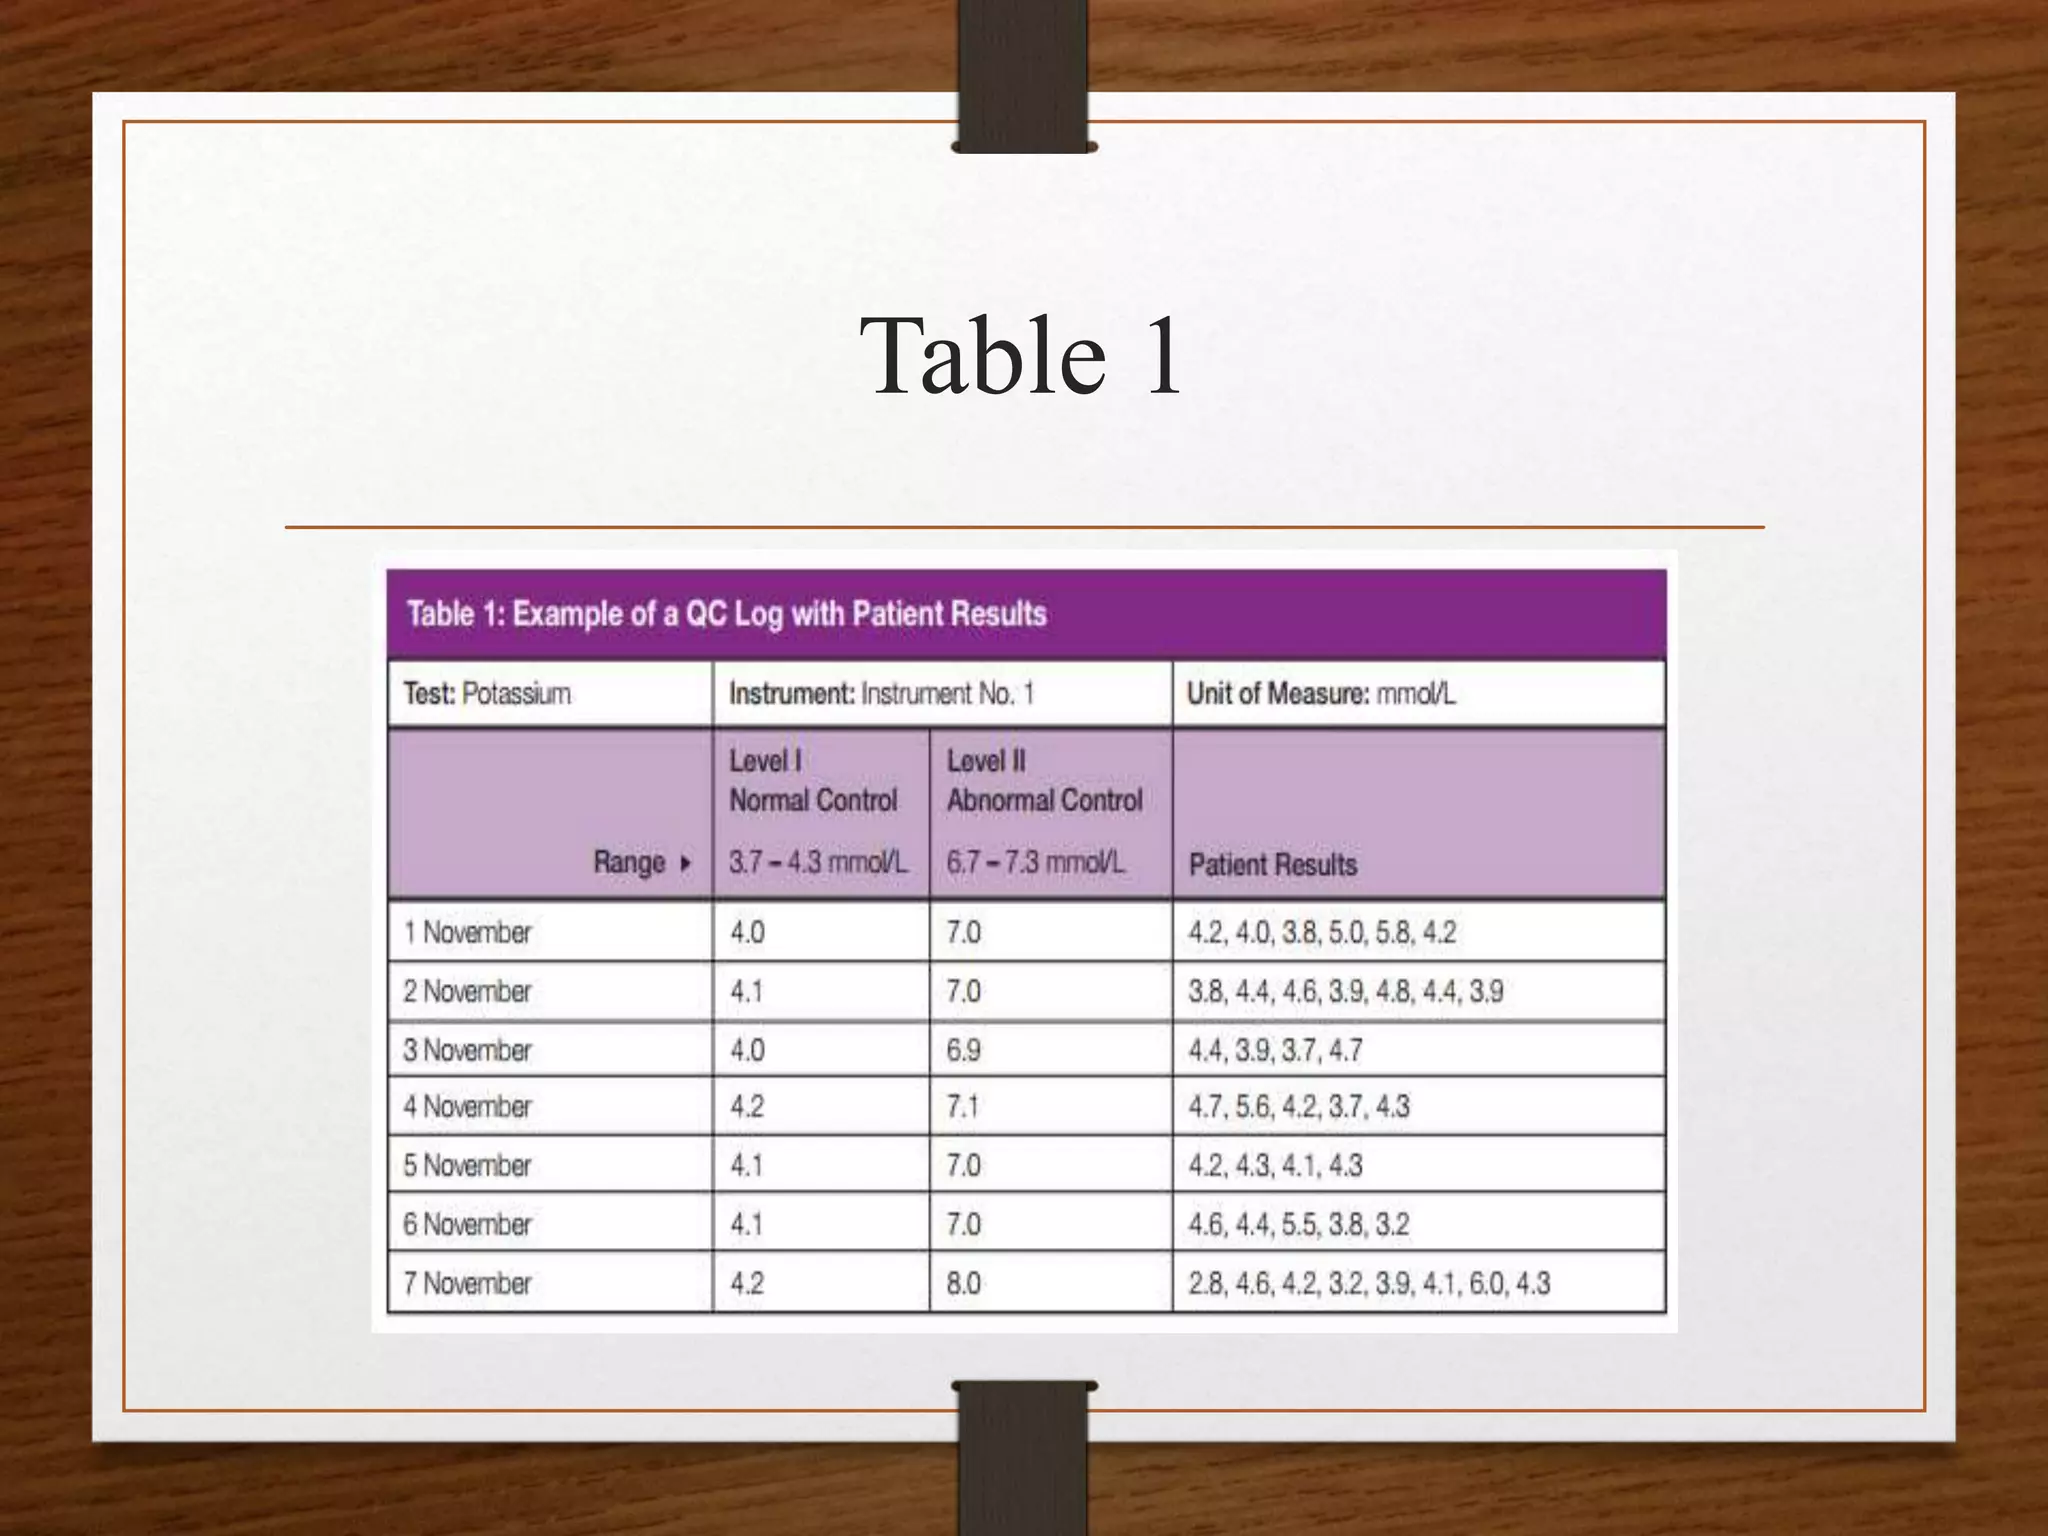
![• To calculate a mean for a specific level of control,
first, add all the values collected for that control.
Then divide the sum of these values by the total
number of values. For instance, to calculate the
mean for the normal control (Level I) in Table 1,
• find the sum of the data {4.0, 4.1, 4.0, 4.2, 4.1, 4.1,
4.2}. The sum [∑] is 28.7 mmol/L.
• The number of values is 7 (n = 7).](https://image.slidesharecdn.com/qcpptcpe-170913185858/75/Quality-Control-in-Pathological-Laboratory-34-2048.jpg)
![Calculating mean
• Therefore, the mean for the normal potassium
control in Table 1 from November 1–7 is 4.1
mmol/L (or 28.7 mmol/L divided by 7).
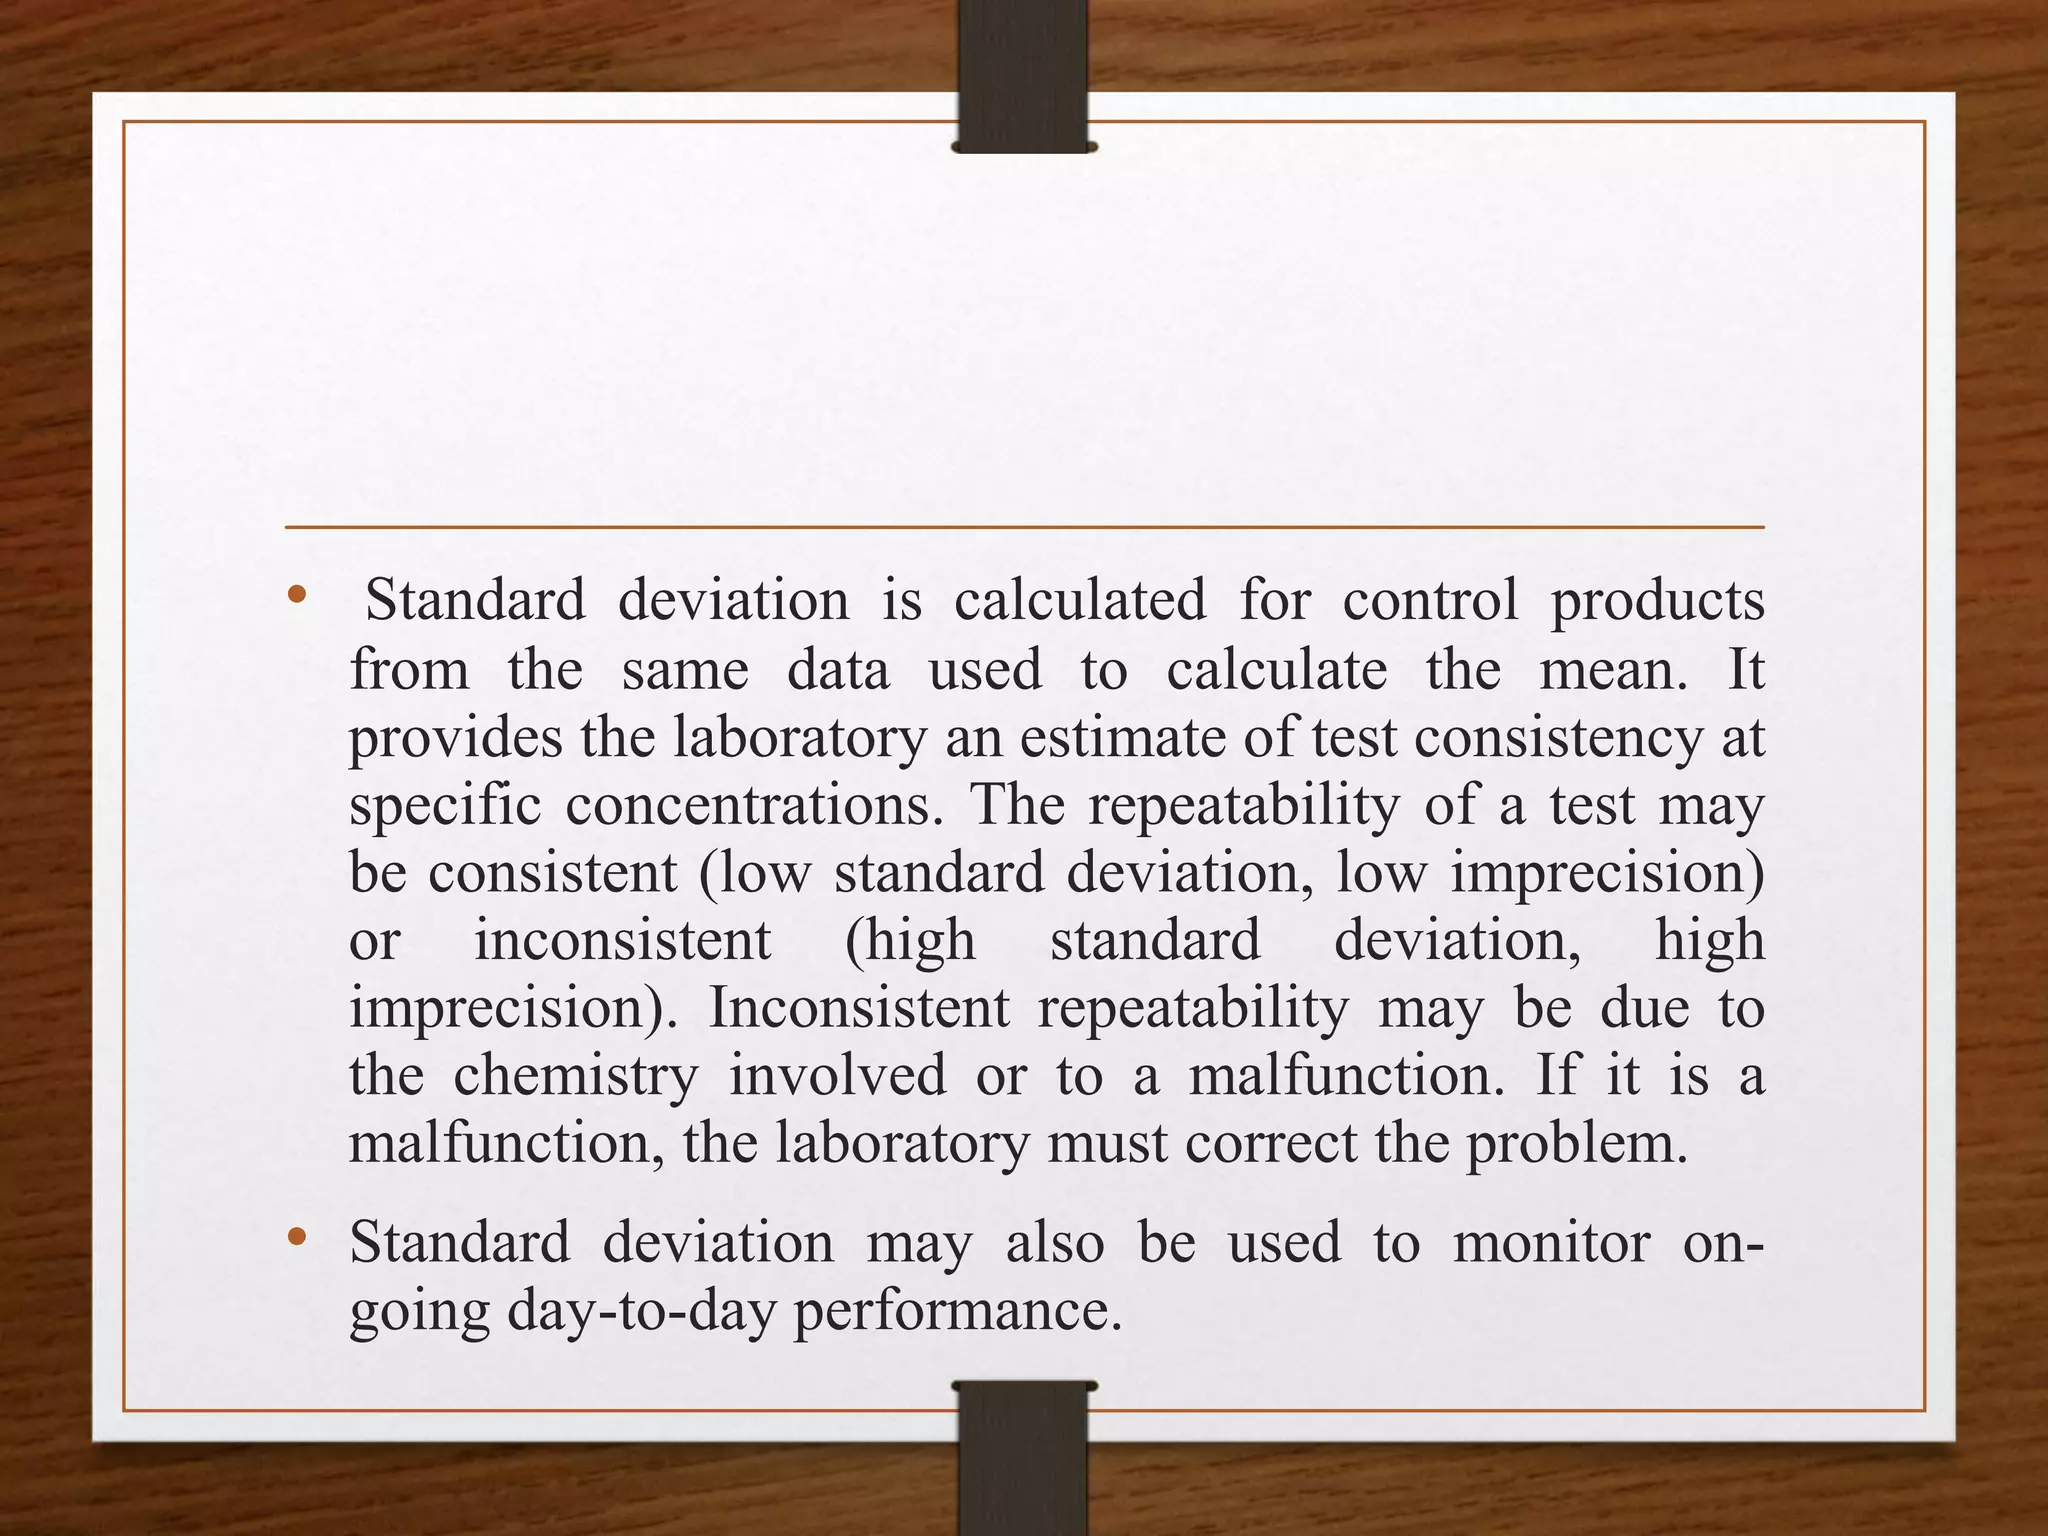
• Calculating a Standard Deviation [s]
• Standard deviation is a statistic that quantifies how
close numerical values (i.e., QC values) are in
relation to each other. The term precision is often
used interchangeably with standard deviation.
Another term, imprecision, is used to express how
far apart numerical values are from each other.](https://image.slidesharecdn.com/qcpptcpe-170913185858/75/Quality-Control-in-Pathological-Laboratory-35-2048.jpg)
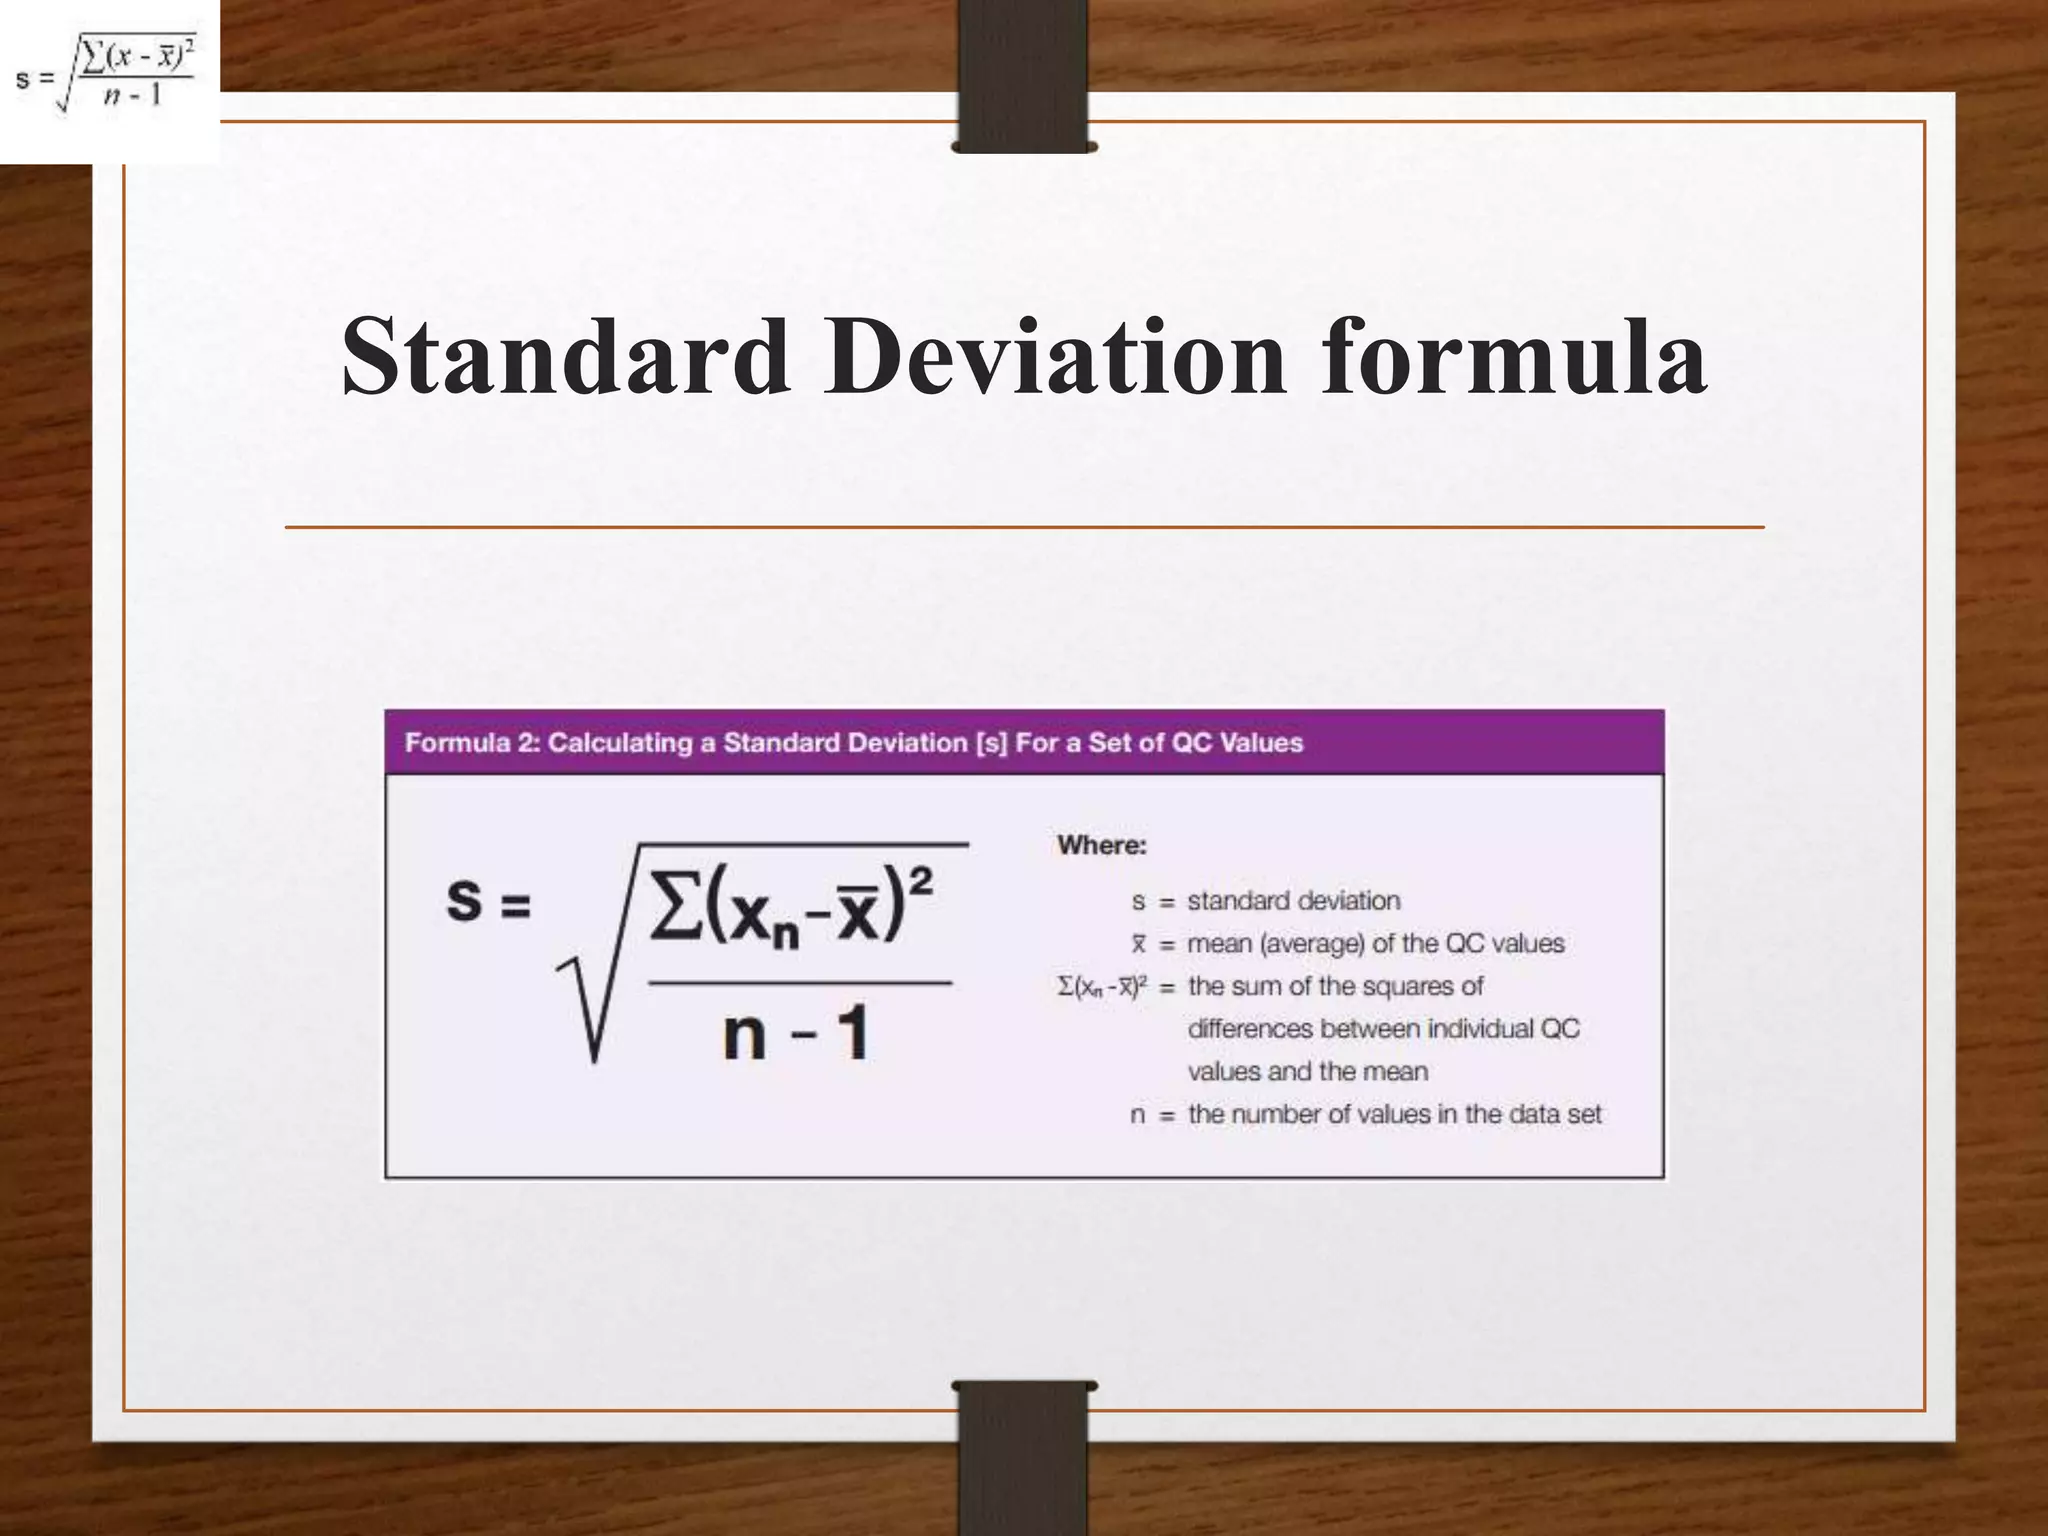
![• Calculate the standard deviation for the normal level of control (Level I)
in Table 1, begin by calculating the mean [ x ]:
• x = 4.0 + 4.1 + 4.0 + 4.2 + 4.1 + 4.1 + 4.2 mmol/L ÷ 7
• x = 28.7 mmol/L ÷ 7
• x = 4.1 mmol/L
• Calculate the standard deviation [s] as follows:
• s= √[{(4−4.1)2 + (4.1 – 4.1)2 +
(4−4.1)2+(4.2−4.1)2+(4.1−4.1)2+(4.2−4.1)2}/6]
• s= √[{(−0.1)2 + ( 0.0)2 + (−0.1)2+(0.1)2+(0.0)2+(0.1)2}/6]
• s =√[ 𝟎. 𝟎𝟏 + 𝟎. 𝟎 + 𝟎. 𝟎𝟏 + 𝟎. 𝟎𝟏 + 𝟎. 𝟎 + 𝟎. 𝟎 + 𝟎. 𝟎𝟏 ÷ 𝟔]
• s = √[𝟎. 𝟎𝟒 ÷ 𝟔]
• s = 0.082 0r 0.1 rounded](https://image.slidesharecdn.com/qcpptcpe-170913185858/75/Quality-Control-in-Pathological-Laboratory-39-2048.jpg)