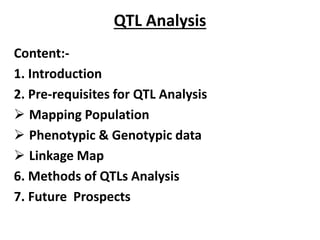
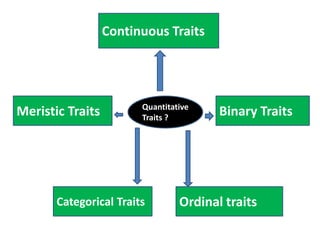
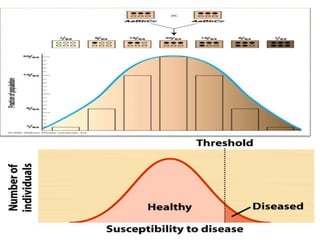
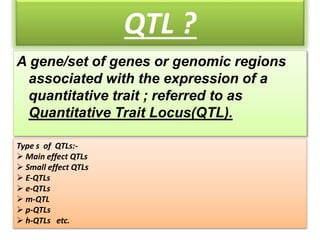
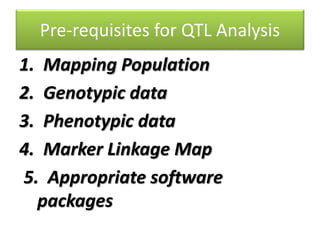
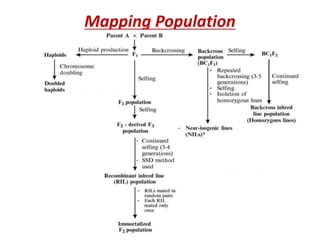
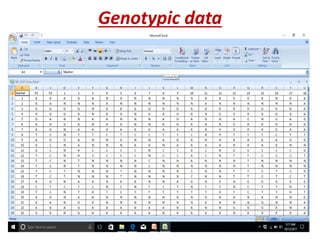
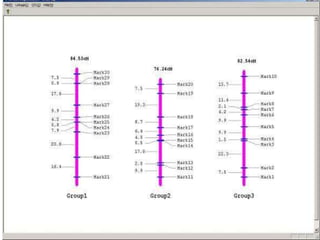
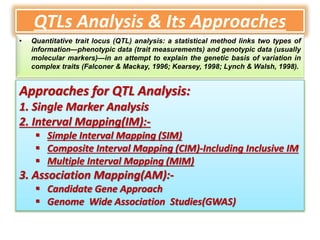
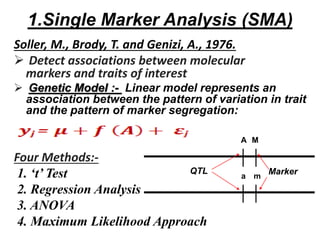
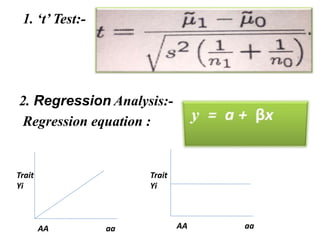
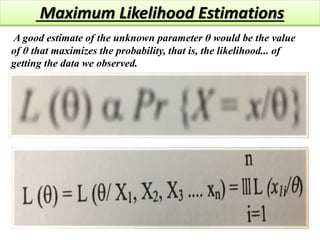
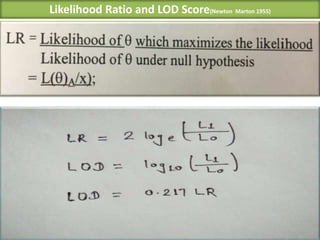
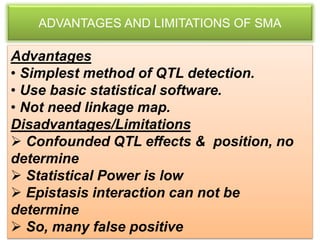
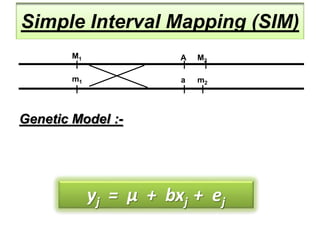
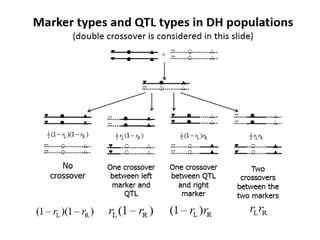
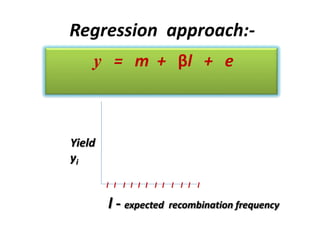
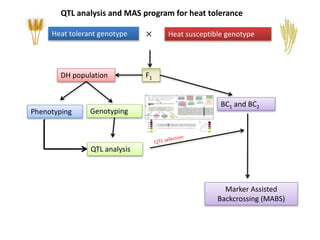
QTL Analysis for Heat Tolerance on Wheat
QTL Analysis
Content:-
1. Introduction
2. Pre-requisites for QTL Analysis
 Mapping Population
 Phenotypic & Genotypic data
 Linkage Map
6. Methods of QTLs Analysis
7. Future Prospects
Continuous Traits
Quantitative
Traits ?
Meristic Traits
Categorical Traits Ordinal traits
Binary Traits
QTL ?
A gene/set of genes or genomic regions
associated with the expression of a
quantitative trait ; referred to as
Quantitative Trait Locus(QTL).
Type s of QTLs:-
 Main effect QTLs
 Small effect QTLs
 E-QTLs
 e-QTLs
 m-QTL
 p-QTLs
 h-QTLs etc.
Pre-requisites for QTL Analysis
1. Mapping Population
2. Genotypic data
3. Phenotypic data
4. Marker Linkage Map
5. Appropriate software
packages
Mapping Population
Genotypic data
Marker Linkage Map
QTLs Analysis & Its Approaches
• Quantitative trait locus (QTL) analysis: a statistical method links two types of
information—phenotypic data (trait measurements) and genotypic data (usually
molecular markers)—in an attempt to explain the genetic basis of variation in
complex traits (Falconer & Mackay, 1996; Kearsey, 1998; Lynch & Walsh, 1998).
Approaches for QTL Analysis:
1. Single Marker Analysis
2. Interval Mapping(IM):-
 Simple Interval Mapping (SIM)
 Composite Interval Mapping (CIM)-Including Inclusive IM
 Multiple Interval Mapping (MIM)
3. Association Mapping(AM):-
 Candidate Gene Approach
 Genome Wide Association Studies(GWAS)
Bulk Segregant Analysis
1.Single Marker Analysis (SMA)
Soller, M., Brody, T. and Genizi, A., 1976.
 Detect associations between molecular
markers and traits of interest
 Genetic Model :- Linear model represents an
association between the pattern of variation in trait
and the pattern of marker segregation:
Four Methods:-
1. ‘t’ Test
2. Regression Analysis
3. ANOVA
4. Maximum Likelihood Approach
A
a
M
m
QTL Marker
1. ‘t’ Test:-
2. Regression Analysis:-
Regression equation :
Trait
Yi
AA aa AA aa
Trait
Yi
Maximum Likelihood Estimations
A good estimate of the unknown parameter θ would be the value
of θ that maximizes the probability, that is, the likelihood... of
getting the data we observed.
Likelihood Ratio and LOD Score(Newton Marton 1955)
ADVANTAGES AND LIMITATIONS OF SMA
Advantages
• Simplest method of QTL detection.
• Use basic statistical software.
• Not need linkage map.
Disadvantages/Limitations
 Confounded QTL effects & position, no
determine
 Statistical Power is low
 Epistasis interaction can not be
determine
 So, many false positive
Simple Interval Mapping (SIM)
Genetic Model :-
yj = μ + bxj + ej
M1 A
m1 a
M2
m2
Regression approach:-
y = m + βl + e
Yield
yi
l l l l l l l l l l l l
l - expected recombination frequency
Composite Interval Mapping
 Use most significant markers as Cofactors
 CIM: Refinement of SIM
 CIM: Combining interval mapping with multiple
regression approach
 Power of QTL detection is increased, reduction of
bias in the estimation of QTL position and effects.
Genetic Model :-
yj= μ + bxij+ ∑bkxjk + ej
Inclusive Composite Interval Mapping(ICIM)
Two Locus Analysis
Multiple Interval Mapping(MIM)
Linkage Analysis & Association Mapping
Heat tolerant genotype Heat susceptible genotype×
F1DH population
BC1 and BC2
Phenotyping Genotyping
QTL analysis
Marker Assisted
Backcrossing (MABS)
QTL analysis and MAS program for heat tolerance
THANK YOU

qtls analysis

  • 2.
    QTL Analysis forHeat Tolerance on Wheat
  • 3.
    QTL Analysis Content:- 1. Introduction 2.Pre-requisites for QTL Analysis  Mapping Population  Phenotypic & Genotypic data  Linkage Map 6. Methods of QTLs Analysis 7. Future Prospects
  • 4.
    Continuous Traits Quantitative Traits ? MeristicTraits Categorical Traits Ordinal traits Binary Traits
  • 6.
    QTL ? A gene/setof genes or genomic regions associated with the expression of a quantitative trait ; referred to as Quantitative Trait Locus(QTL). Type s of QTLs:-  Main effect QTLs  Small effect QTLs  E-QTLs  e-QTLs  m-QTL  p-QTLs  h-QTLs etc.
  • 8.
    Pre-requisites for QTLAnalysis 1. Mapping Population 2. Genotypic data 3. Phenotypic data 4. Marker Linkage Map 5. Appropriate software packages
  • 9.
  • 10.
  • 11.
  • 15.
    QTLs Analysis &Its Approaches • Quantitative trait locus (QTL) analysis: a statistical method links two types of information—phenotypic data (trait measurements) and genotypic data (usually molecular markers)—in an attempt to explain the genetic basis of variation in complex traits (Falconer & Mackay, 1996; Kearsey, 1998; Lynch & Walsh, 1998). Approaches for QTL Analysis: 1. Single Marker Analysis 2. Interval Mapping(IM):-  Simple Interval Mapping (SIM)  Composite Interval Mapping (CIM)-Including Inclusive IM  Multiple Interval Mapping (MIM) 3. Association Mapping(AM):-  Candidate Gene Approach  Genome Wide Association Studies(GWAS)
  • 16.
  • 17.
    1.Single Marker Analysis(SMA) Soller, M., Brody, T. and Genizi, A., 1976.  Detect associations between molecular markers and traits of interest  Genetic Model :- Linear model represents an association between the pattern of variation in trait and the pattern of marker segregation: Four Methods:- 1. ‘t’ Test 2. Regression Analysis 3. ANOVA 4. Maximum Likelihood Approach A a M m QTL Marker
  • 18.
    1. ‘t’ Test:- 2.Regression Analysis:- Regression equation : Trait Yi AA aa AA aa Trait Yi
  • 19.
    Maximum Likelihood Estimations Agood estimate of the unknown parameter θ would be the value of θ that maximizes the probability, that is, the likelihood... of getting the data we observed.
  • 20.
    Likelihood Ratio andLOD Score(Newton Marton 1955)
  • 21.
    ADVANTAGES AND LIMITATIONSOF SMA Advantages • Simplest method of QTL detection. • Use basic statistical software. • Not need linkage map. Disadvantages/Limitations  Confounded QTL effects & position, no determine  Statistical Power is low  Epistasis interaction can not be determine  So, many false positive
  • 22.
    Simple Interval Mapping(SIM) Genetic Model :- yj = μ + bxj + ej M1 A m1 a M2 m2
  • 24.
    Regression approach:- y =m + βl + e Yield yi l l l l l l l l l l l l l - expected recombination frequency
  • 25.
    Composite Interval Mapping Use most significant markers as Cofactors  CIM: Refinement of SIM  CIM: Combining interval mapping with multiple regression approach  Power of QTL detection is increased, reduction of bias in the estimation of QTL position and effects. Genetic Model :- yj= μ + bxij+ ∑bkxjk + ej Inclusive Composite Interval Mapping(ICIM)
  • 26.
    Two Locus Analysis MultipleInterval Mapping(MIM)
  • 28.
    Linkage Analysis &Association Mapping
  • 29.
    Heat tolerant genotypeHeat susceptible genotype× F1DH population BC1 and BC2 Phenotyping Genotyping QTL analysis Marker Assisted Backcrossing (MABS) QTL analysis and MAS program for heat tolerance
  • 31.