Download as PDF, PPTX

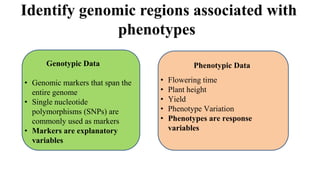
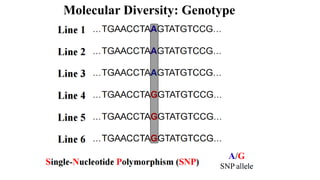
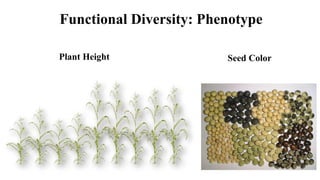
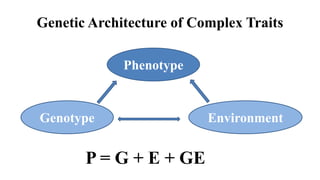

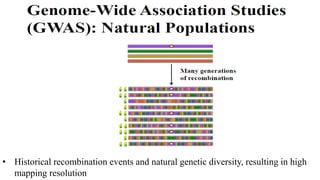
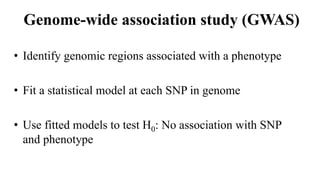
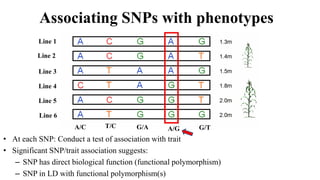
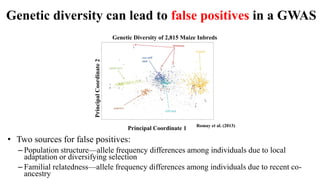


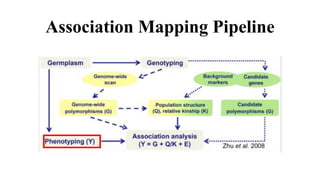
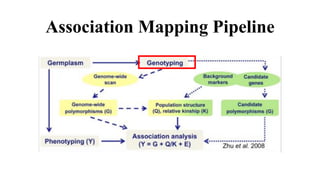
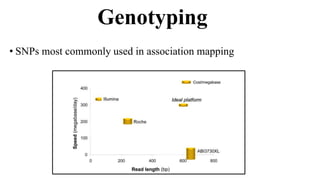
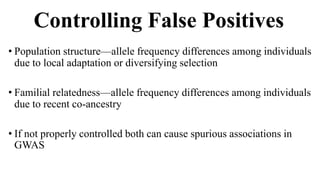
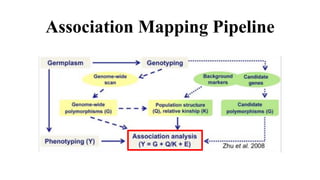
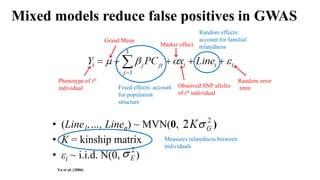
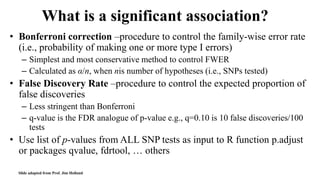
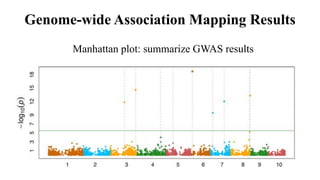
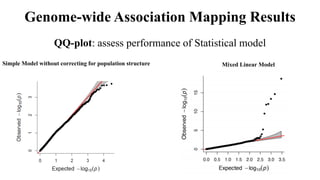
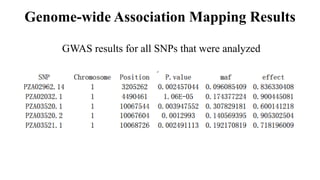


Genome-wide association mapping identifies genomic regions associated with phenotypes by analyzing phenotypic and genotypic data. Phenotypic data includes traits like flowering time and yield, while genotypic data consists of genetic markers spanning the genome. Single nucleotide polymorphisms (SNPs) are commonly used markers. Association mapping fits statistical models to test for association between each SNP and the phenotype. Accounting for population structure and relatedness through mixed models reduces false positives. Significant associations between SNPs and traits suggest the SNP directly affects the trait or is linked to a causal variant. Results are visualized through Manhattan plots and QQ-plots.