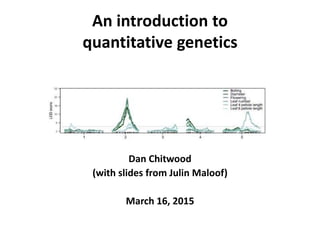
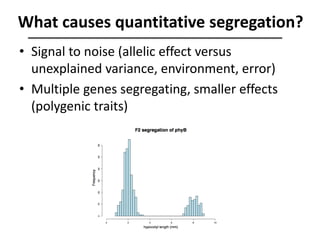
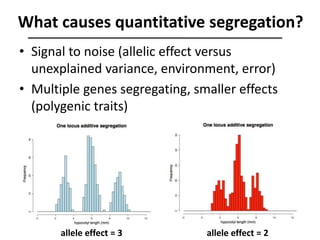
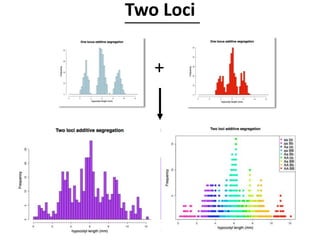
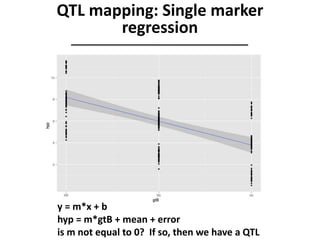
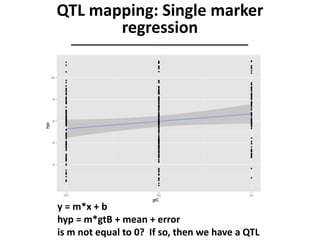
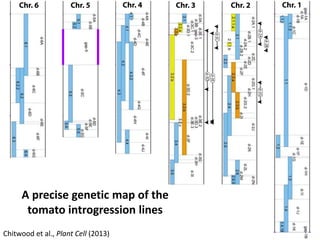
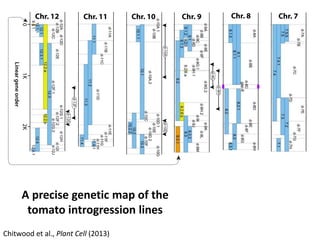
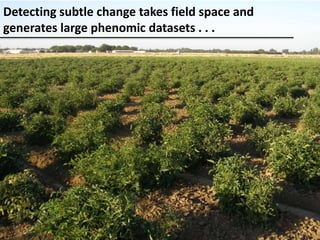
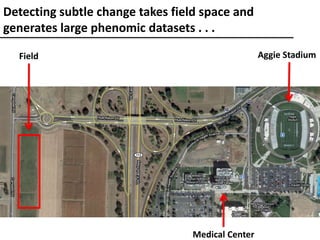
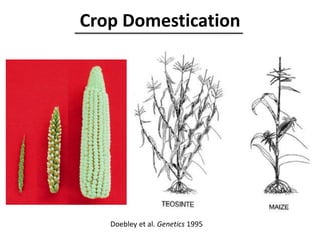
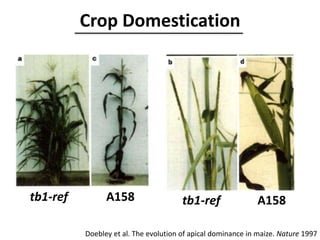
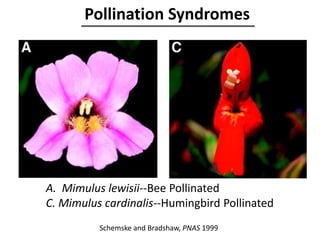
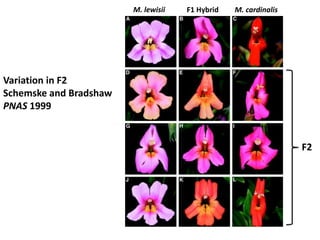
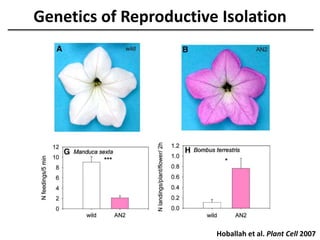
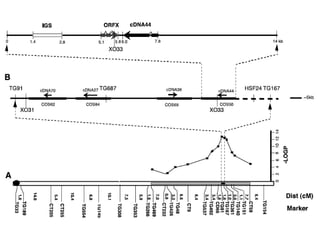
An introduction to
quantitative genetics
Dan Chitwood
(with slides from Julin Maloof)
March 16, 2015
What is a QTL?
• QTL
– Quantitative Trait Locus
– A genetic locus that contributes to quantitative
variation in a trait
• What is a quantitative trait? What contributes
to the concept of “trait?”
– Genes?
– Environment?
– Cross/allele/species background?
– The researcher?
Is hypocotyl length a quantitative
trait? No?
Qualitative: can classify
as tall or shortWT phyB
Is hypocotyl length a quantitative
trait? Yes?
Segregation Ler x Cvi RIL
Quantitative: must
measure (quantify)
differences
What causes quantitative segregation?
• Signal to noise (allelic effect versus
unexplained variance, environment, error)
• Multiple genes segregating, smaller effects
(polygenic traits)
What causes quantitative segregation?
• Signal to noise (allelic effect versus
unexplained variance, environment, error)
• Multiple genes segregating, smaller effects
(polygenic traits)
allele effect = 3 allele effect = 2
Two Loci
+
Why study development with QTL?
• Micro-evolution
– what makes two strains/populations/species
different?
– (Teosinte/Maize; Mimmulus; etc)
• Plant Breeding
– Fruit shattering
– Flowering
– etc.
• Human Disease
• Different spectrum of loci than available through
forward genetics
Single marker regression
• Simplified version:
– Phenotype all individuals
QTL mapping: Single marker
regression
Marker “A” is linked to a hypocotyl QTL Marker “C” is unlinked
• Simplified version:
– Phenotype all individuals
– Genotype all individuals
– Look for correlation
QTL mapping: Single marker
regression
-Repeat, analyzing correlation to trait for 100s of
makers
-Limitations:
-Confounding: can not separate QTL effect (size)
and location of the QTL (relative to the marker).
-Does not account for effect of other contributing
loci/markers
QTL mapping: Single marker
regression
y = m*x + b
hyp = m*gtB + mean + error
is m not equal to 0? If so, then we have a QTL
QTL mapping: Single marker
regression
y = m*x + b
hyp = m*gtB + mean + error
is m not equal to 0? If so, then we have a QTL
QTL mapping: Single marker
regression
Simple interval mapping
QTL mapping: recombination
increases variance
• The QTL “Q” may be some distance from
marker “B”
• Parent genotypes: B-Q and b-q
• Progeny genotypes: B-Q, b-q, B-q, b-Q
• genotype at QTL: Q or q
• Solution:
– Interval mapping
Simple Interval Mapping
(SIM; Lander and Botstein)
• Evaluate intervals between markers rather than
markers themselves
• Conceptually:
– Parents: B-Q-D and b-q-d
– Progeny:
• B-Q-D and b-q-d
• b-q-D b-Q-D B-Q-d B-q-d
• very rare: B-q-D b-Q-d
– Use B-D and b-d to estimate allelic effect size of QTL
– Use recombinants to estimate whether QTL is closer to B or
D
– LOD score: Likelihood of linkage. Log10 of ratio of likelihood
of linkage / likelihood unlinked
Simple Interval Mapping
(SIM; Lander and Botstein)
• Evaluate intervals between markers rather than markers
themselves
• In reality
– The position of the QTL in the interval is evaluated by maximum likelihood.
– At each position in the interval an iterative algorithm is used to determine
the most likely model given the data.
– The likelihood of a model with the QTL is compared to the null model (no
QTL).
– These two likelihoods are compared to give a LOD score
• LOD score = log10(Likelihood with QTL/Likelihood no QTL)
– what does a LOD score of 2 indicate?
Composite interval mapping
QTL mapping: other loci increase variance
Problem with SIM: Linked and unlinked QTL affect the analysis
QTL mapping: composite interval
mapping (Zeng; Jansen and Stam)
Simplifying and ignoring the “interval” issue:
hyp = mean + m1*gtB + m2*gtA* + error
Composite Interval
Partial CIM
Simple Interval Mapping
Zeng, Genetics, 1994
Comparison of QTL methods
Practicalities of QTL experiments
Practicalities—Backcross Population
Practicalities—F2 population
Practicalities:
RIL population
Practicalities: experimental design
Design:
Randomization,
Replication,
Measurer effects,
Positional effects,
Environmental effects
y = m*x + b
hyp = m*gtB +mean + error
is m not equal to 0? If so, then we have a QTL
QTL mapping: Single marker
regression
J. MaloofPhotos: Charlie Rick, TGRC
Solanum pennellii
(Peruvian desert)
Solanum lycopersicum
(cultivated)
Desert tomato
Cactus
Single marker regression, sort of:
Tomato introgression lines
Single marker regression, sort of:
Tomato introgression lines
X
Backcross,
marker-assisted
selection
Self
…
Look for
phenotypic
differences
S. lycopersicum
(domesticated)
S. pennellii
(desert)
Single marker regression, sort of:
Tomato introgression lines
Ravi Kumar
Aashish Ranjan
Mike Covington
RNA-Seq (genic polymorphisms) RESCAN (genic/non-genic polymorphisms)
Genotyping using next-generation sequencing
Kumar et al., Front. Plant Sci. 2012
A precise genetic map of the
tomato introgression lines
Chitwood et al., Plant Cell (2013)
A precise genetic map of the
tomato introgression lines
Chitwood et al., Plant Cell (2013)
Detecting subtle change takes field space and
generates large phenomic datasets . . .
Field Aggie Stadium
Medical Center
Detecting subtle change takes field space and
generates large phenomic datasets . . .
Detecting subtle change takes field space and
generates large phenomic datasets . . .
Detecting subtle change takes field space and
generates large phenomic datasets . . .
A QTL
Network . . .
Introgression
Lines
Classic examples of
QTL experiments
Doebley et al. Genetics 1995
Crop Domestication
Crop Domestication
tb1-ref tb1-refA158 A158
Doebley et al. The evolution of apical dominance in maize. Nature 1997
A. Mimulus lewisii--Bee Pollinated
C. Mimulus cardinalis--Humingbird Pollinated
Schemske and Bradshaw, PNAS 1999
Pollination Syndromes
Variation in F2
Schemske and Bradshaw
PNAS 1999
M. lewisii M. cardinalisF1 Hybrid
F2
• Measure visitation rates in F2 population
• Look for correlation between floral QTL and
visitation
• One QTL increases carotenoids -> decreases
bee visitation 80%
• Another QTL increases nectar 3-fold, double
hummingbird visits (indpendent of color)
Which Traits affect pollinator visitation?
Genetics of Reproductive Isolation
• 12 Traits…47 QTL
• 9/12 Traits had “major” QTL
• Therefore, major QTL can play a role in
speciation.
– Contrasts with a very polygenic, additive small effect
loci view of evolution
Genetics of Reproductive Isolation
Kuhlemeier Lab
Genetics of Reproductive Isolation
Hoballah et al. Plant Cell 2007
Genetics of Reproductive Isolation
Hoballah et al. Plant Cell 2007
Frary et al. Science 2000
Crop Breeding
S. pimpinellifolium S. lycopersicum
Transgenic for
S. pennellii fw2.2
candidate
Fruit Weight
• Cross wild to domesticated
• 11 fruit mass QTL
• fw2.2 largest effect, modifying fruit size up to
30%
• Create NIL and backcross
• Large allele in domesticated partially recessive
• Transgenics with wild allele have smaller fruit
• Structural homology to ras oncogene
Developmental effect of fw2.2?
• What makes 2 alleles different?
• Expression: temporal expression different
• Phenotypic effect: Reduced cell division in
carpels
Real QTL effects are often “wimpy”
--ie, polygenic, small
effects
--Contrasts with tb1 and
pollinator shifts
Drastic differences in fruit and leaf phenotypes
between wild and domesticated tomato species
How do we measure leaf shape?
Elliptical Fourier Shape Descriptors
How do we measure leaf shape?
Elliptical Fourier Shape Descriptors
-2 SD +2 SD Overlay
PC1
44.4%
S.penn
(desert)
S.lyco
(dom.)
How do we measure shape?
Elliptical Fourier Shape Descriptors
-2 SD +2 SD Overlay
PC1
44.4%
PC2
13.0%
How do we measure shape?
Elliptical Fourier Shape Descriptors
-2 SD +2 SD Overlay
PC1
44.4%
PC2
13.0%
PC3
6.9%
PC4
6.6%
PC5
4.1%
-5.00E-02
-4.00E-02
-3.00E-02
-2.00E-02
-1.00E-02
0.00E+00
1.00E-02
2.00E-02
3.00E-02
4.00E-02
5.00E-02
-0.55 -0.45 -0.35 -0.25 -0.15 -0.05 0.05
S.lyco
(dom.)
The genetic basis of natural variation
in leaflet morphology: an example
PC1
PC2
-5.00E-02
-4.00E-02
-3.00E-02
-2.00E-02
-1.00E-02
0.00E+00
1.00E-02
2.00E-02
3.00E-02
4.00E-02
5.00E-02
-0.55 -0.45 -0.35 -0.25 -0.15 -0.05 0.05
S.penn
(desert)
IL4-3
S.lyco
(dom.)
PC1
PC2
The genetic basis of natural variation
in leaflet morphology: an example
-5.00E-02
-4.00E-02
-3.00E-02
-2.00E-02
-1.00E-02
0.00E+00
1.00E-02
2.00E-02
3.00E-02
4.00E-02
5.00E-02
-0.55 -0.45 -0.35 -0.25 -0.15 -0.05 0.05
S.penn
(desert)
IL4-3
S.lyco
(dom.)
PC1
PC2
The genetic basis of natural variation
in leaflet morphology: an example
How to explain shape
differences between tomatoes?
--Polygenic trait or epistasis
--Additive effects?
QTL Advances
The Punctate phenotype:
An example of bulk-segregant approaches
with next-generation sequencing
S. pennellii, low magnification S. penn., high magnification
The Punctate locus lies on chromosome 10
S. lycopersicumIL10-3, chrom. 10
The Punctate locus lies on chromosome 10
IL10-3, chrom. 10
The Punctate locus lies on chromosome 10
IL10-3, chrom. 10
Chromosomes
1 2 3 4 5 6 7 8 9 10 11 12
Chromosome 10
The Punctate locus lies on chromosome 10
IL10-3, chrom. 10
Chromosomes
1 2 3 4 5 6 7 8 9 10 11 12
Chromosome 10
2.65 Mbp; ~300 genes
X
…
S. lycopersicum
(domesticated)
S. pennellii
(desert)
Backcrossed
Introgression Lines (BILs)
Backcrosses
Self
BIL-460
BIL-430
BIL-263
BIL-274
BIL-202
BIL-040
BIL-218
BIL-176
BIL-466
BIL-405
BIL-057
BIL-194
BIL-376
BIL-232
BIL-127
BIL-347
1 2 3 4 5 6 7 8 9 10 11 12Chromosome
Genotypes of Punctate BILs share chrom. 10 region
Aashish Ranjan
BIL-224
BIL-067
BIL-039
BIL-215
BIL-176
BIL-031
BIL-427
BIL-007
BIL-003
BIL-289
BIL-422
BIL-433
BIL-066
BIL-439
BIL-275
BIL-360
BIL-046
Genotypes of Punctate BILs share chrom. 10 region
1 2 3 4 5 6 7 8 9 10 11 12Chromosome
Aashish Ranjan
On the Pn interval are four related MYBs,
one of which is is Anthocyanin 1 (ANT1)
“MYB250” ANT1 “MYB270” Heavy metal-associated
domain gene
“MYB290”
S. lycopersicum:
Aashish Ranjan
This et al. TAG 2007
Foumier-Level et al. Genetics 2009
. . . but berry color in grape is also caused
by a set of tandemly duplicated MYBs!
MYBA2 MYBA1
V. vinifera:
MYBA3
Relatedness of Vitis, Solanum, and
Arabidopsis MYBs
Relatedness of Vitis, Solanum, and
Arabidopsis MYBs
V. vinifera (Grape)
S. lycopersicum (Tomato)
Arabidopsis
Quattrocchio et al. Plant Cell 2006
The Arabidopsis MYB homolog also
affects trichome pigmentation
Dissertation of Antonio Gonzalez
35S:MYB114
MYB113 MYB114 PAP2/MYB90
Arabidopsis
Evolution at work:
from berries to trichomes
V. vinifera (Grape)
S. lycopersicum (Tomato)Arabidopsis
• 4,523 eQTL for 4,066 genes
A QTL
Network . . .
Introgression
Lines
IL4-3
Gene expression as phenotype: eQTL, cis- and trans-
relationships, and transcriptional networks
IL4-3:
I
II
III
IV
VVI
VII
VIII
IX
X
XI
XII
S. pennellii (desert)
S. lycopersicum (domesticated)
Gene expression as phenotype: eQTL, cis- and trans-
relationships, and transcriptional networks
S. pennellii (desert)
S. lycopersicum (domesticated)
IL4-3:
IV
Differentially expressed:
IL4-3 <-> S. lycopersicum
cis- regulation
Gene expression as phenotype: eQTL, cis- and trans-
relationships, and transcriptional networks
S. pennellii (desert)
S. lycopersicum (domesticated)
IL4-3:
IV
Differentially expressed:
IL4-3 <-> S. lycopersicum
cis- regulation
trans-regulation
Adaxial Abaxial
S.lyco.
(domesticated)
S.penn.
(desert)
Another phenotype of IL4-3:
Increased pavement cell size
Pavement cell
size:
The molecular mechanisms
underlying cellular natural variation
Histone H3A, Histone H3B,
Histone H2B, MCM3, MCM4,
MCM5,
ssDNA replication binding
protein,
Cyclin B1, Cyclin B2,
CDC20
Up-regulated
genes:
The molecular mechanisms
underlying cellular natural variation
Histone H3A, Histone H3B,
Histone H2B, MCM3, MCM4,
MCM5,
ssDNA replication binding
protein,
Cyclin B1, Cyclin B2,
CDC20
Cell cycle
Up-regulated
genes:
Sig. GO terms,
trans-regulated
genes:
The molecular mechanisms
underlying cellular natural variation
Histone H3A, Histone H3B,
Histone H2B, MCM3, MCM4,
MCM5,
ssDNA replication binding
protein,
Cyclin B1, Cyclin B2,
CDC20
Cell cycle
E2F
binding
site
Up-regulated
genes:
Sig. GO terms,
trans-regulated
genes:
Promoter motifs,
trans-regulated
genes
CDS
E2F promotes endoreduplication
G1
SG2
M
E2F
Mitosis
Endocycle
E2F promotes endoreduplication
0
0.5
1
1.5
2
2.5
3
3.5
4
4.5
SKP2A expression is reduced
in S. penn. and IL4-3
G1
SG2
M
SKP2A E2F
Mitosis
Endocycle
Expressionlevel
Lauren Headland

QTL lecture for Bio4025