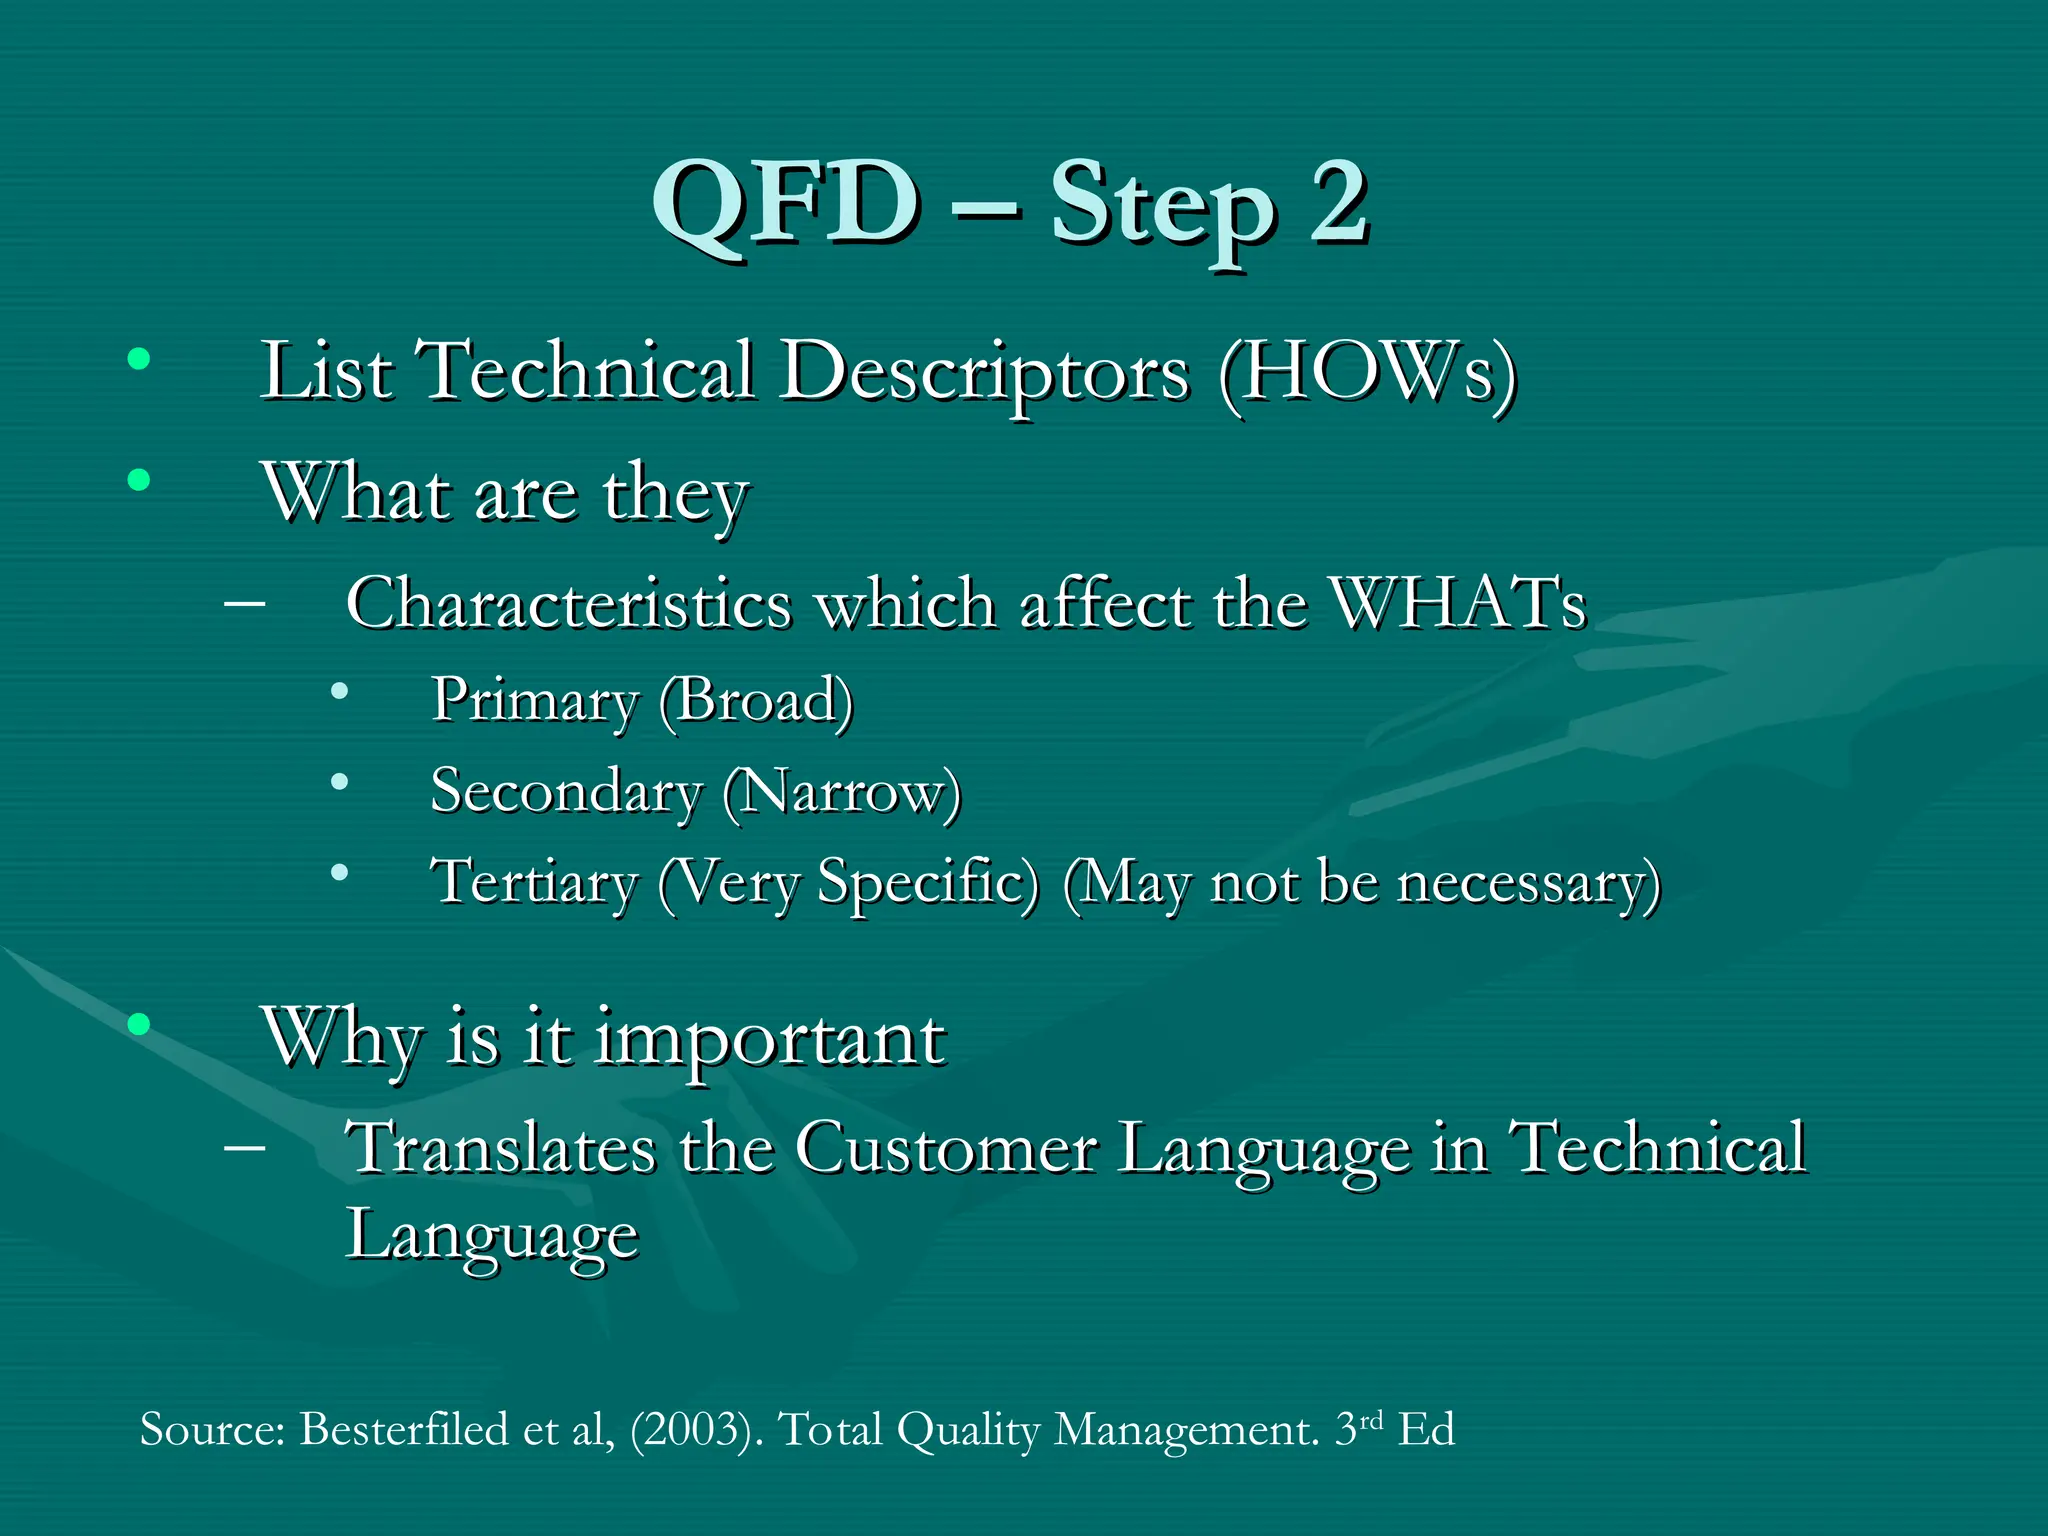
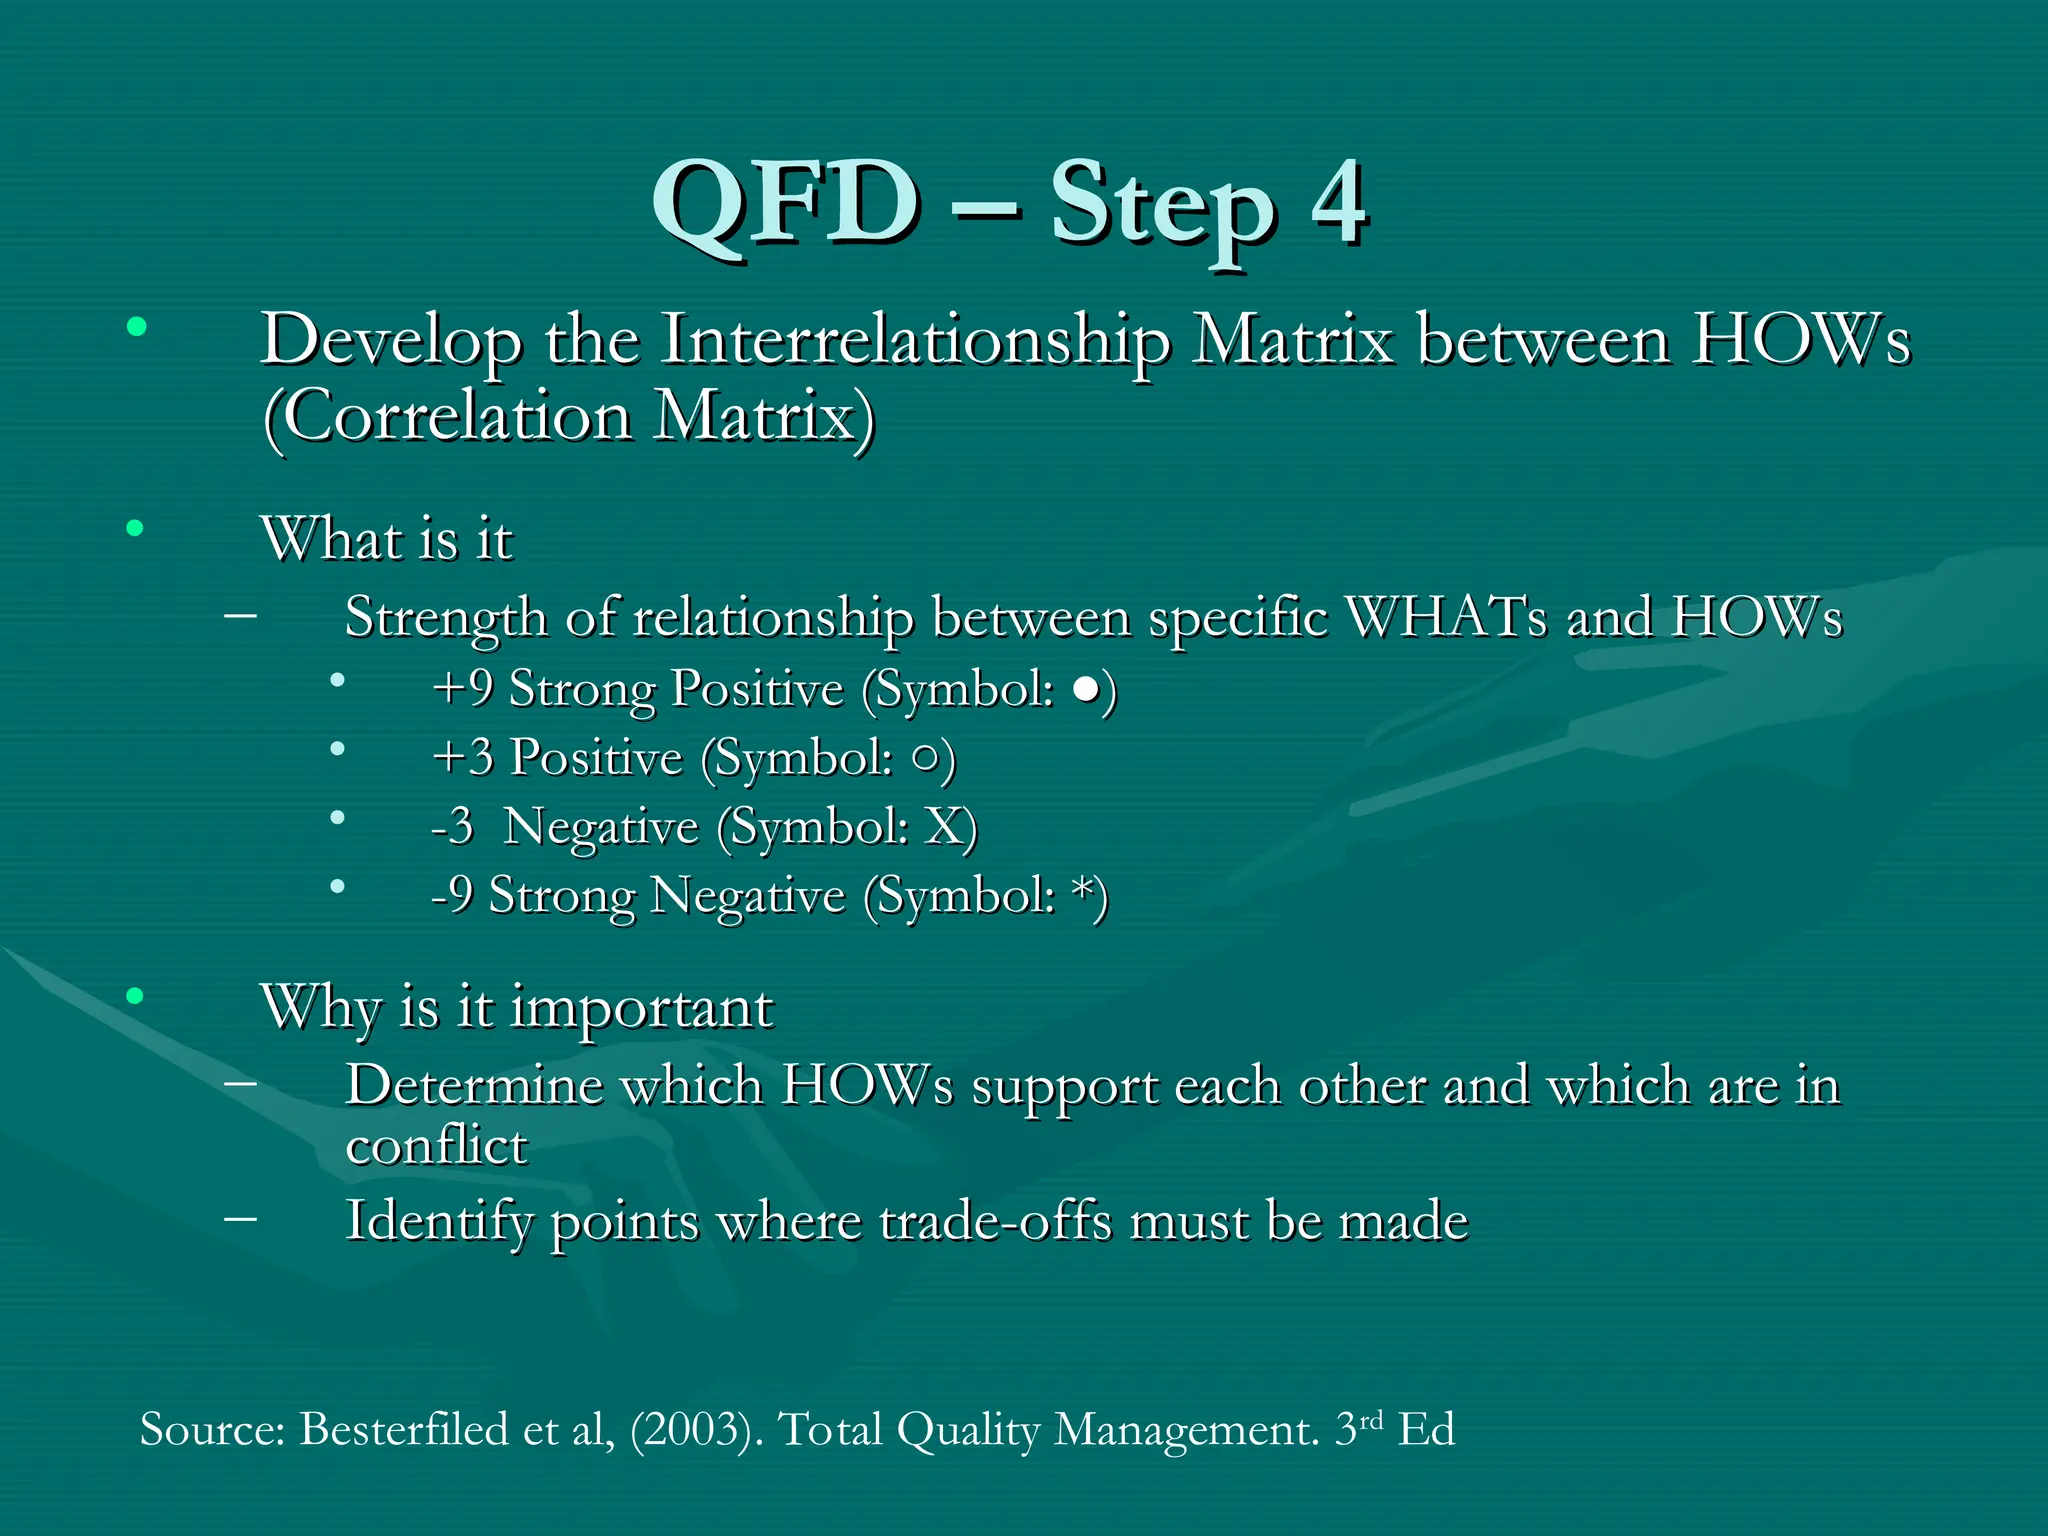
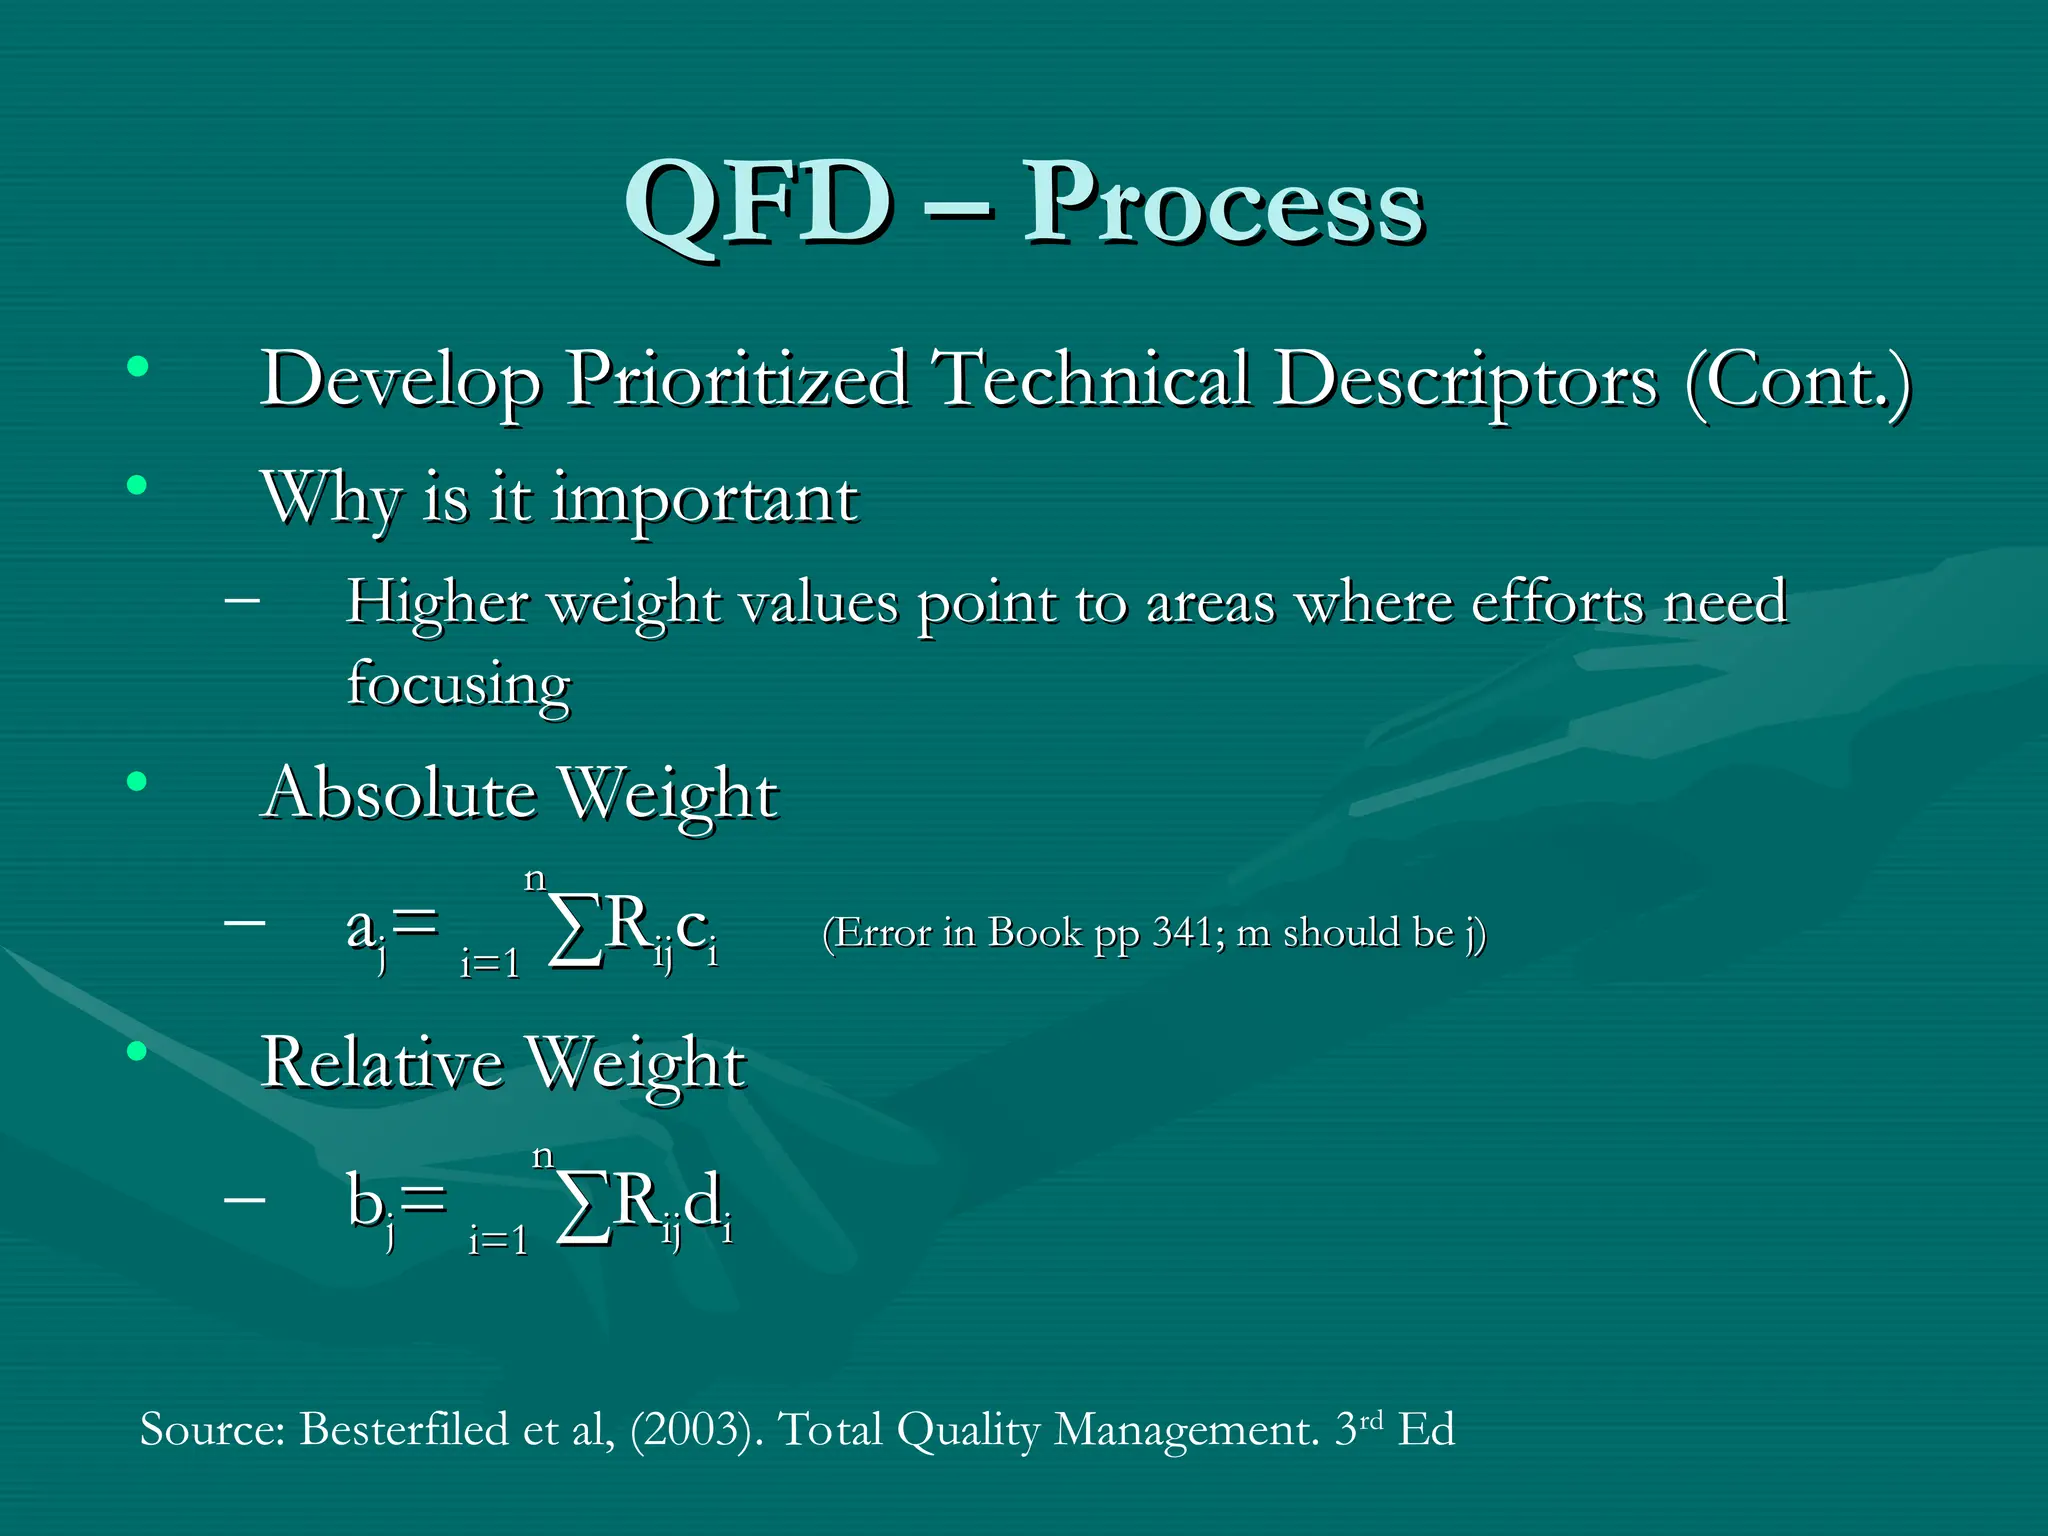
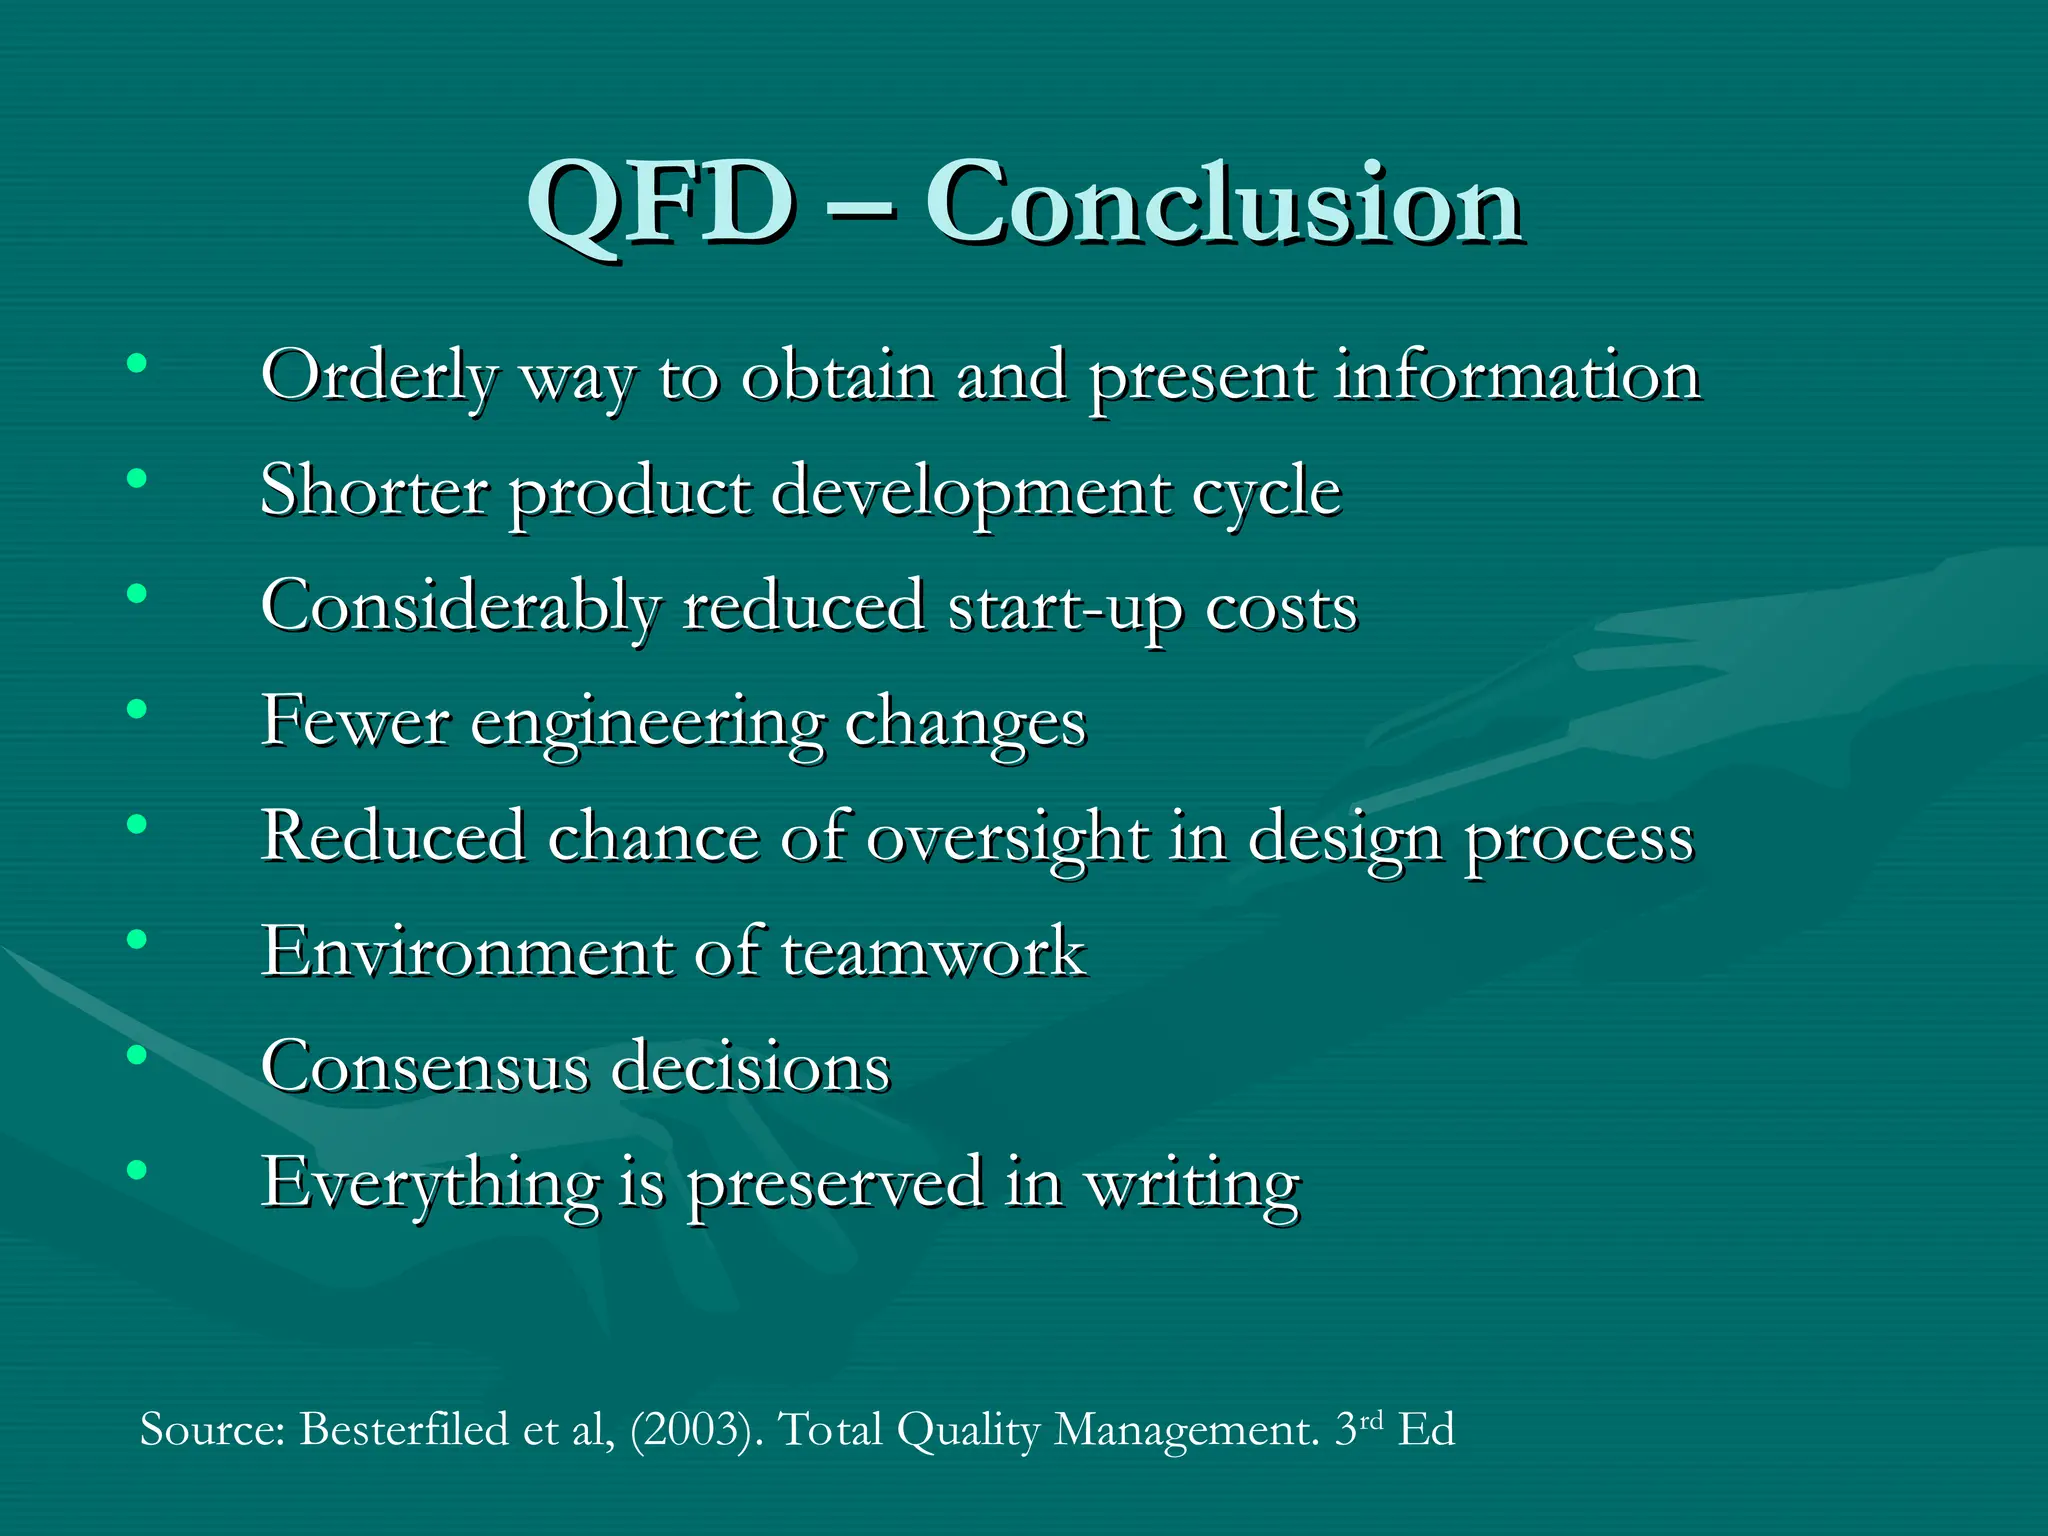
Quality Functional
Quality Functional
Deployment (QFD)
Deployment (QFD)
Using Teamwork for the Customer
Chapter 12
Chapter 12
Kipp Reynolds
Kipp Reynolds
February 28, 2007
February 28, 2007
QFD – Definition
QFD – Definition
• “
“Planning tool used to fulfill customer
Planning tool used to fulfill customer
expectation”
expectation”
• Team Based
Team Based
– Cross Functional
Cross Functional
• Voice of the Customer
Voice of the Customer
– Expectations
Expectations
– Requirements
Requirements
Source: Besterfiled et al, (2003). Total Quality Management. 3rd
Ed
QFD – Uses
QFD – Uses
• Product Planning
Product Planning
• Part Development
Part Development
• Process Planning
Process Planning
• Production Planning
Production Planning
• Service Industries
Service Industries
Source: Besterfiled et al, (2003). Total Quality Management. 3rd
Ed
QFD – Benefits
QFD – Benefits
• Improved Customer Satisfaction
Improved Customer Satisfaction
– Identifies Basic Needs (Customer Requirements)
Identifies Basic Needs (Customer Requirements)
– Focus on areas where most improvement is needed
Focus on areas where most improvement is needed
• Reduces Implementation Time
Reduces Implementation Time
– Decrease design changes
Decrease design changes
• Promote Teamwork
Promote Teamwork
• Provides Documentation
Provides Documentation
– Data for future designs
Data for future designs
• Figure 12-1 pp. 318
Figure 12-1 pp. 318
Source: Besterfiled et al, (2003). Total Quality Management. 3rd
Ed
QFD – Information Sources
• Customer Information comes from a combination of
Customer Information comes from a combination of
three pairs of sources
– Solicited or Unsolicited
Solicited or Unsolicited
– Quantitative or Qualitative
Quantitative or Qualitative
– Structured or Random
Structured or Random
• Figure 12-2 pp. 320
Figure 12-2 pp. 320
• Use an Affinity Diagram (Chp. 17)
Use an Affinity Diagram (Chp. 17)
– Organizes information into logical groups
Organizes information into logical groups
Source: Besterfiled et al, (2003). Total Quality Management. 3rd
Ed
QFD – Construction of the House
• QFD is also called the “House of Quality”
QFD is also called the “House of Quality”
– Because it looks like a house
Because it looks like a house
• Walls
Walls
• Roof
Roof
• Ceiling
Ceiling
• Floor
Floor
• Interior
Interior
• Like any house construction, following the plans
Like any house construction, following the plans
(steps) correctly will result in a good strong
house (Quality).
house (Quality).
Source: Besterfiled et al, (2003). Total Quality Management. 3rd
Ed
QFD – Plans (Steps)
QFD – Plans (Steps)
• Sevens Steps to Constructing the
Sevens Steps to Constructing the
House of Quality
House of Quality
1.
1. List Customer Requirements (WHATs)
List Customer Requirements (WHATs)
2.
2. List Technical Descriptors (HOWs)
List Technical Descriptors (HOWs)
3.
3. Develop a Relationship Matrix between WHATs and
Develop a Relationship Matrix between WHATs and
HOWs
HOWs
4.
4. Develop the Interrelationship Matrix between HOWs
Develop the Interrelationship Matrix between HOWs
5.
5. Competitive Assessment
Competitive Assessment
6.
6. Develop Prioritized Customer Requirements
Develop Prioritized Customer Requirements
7.
7. Develop Prioritized Technical Descriptors
Develop Prioritized Technical Descriptors
Source: Besterfiled et al, (2003). Total Quality Management. 3rd
Ed
QFD – Step 1
QFD – Step 1
• List Customer Requirements (WHATs)
List Customer Requirements (WHATs)
• What are they
What are they
– Customer Expectations or Requirements
Customer Expectations or Requirements
• Primary (Broad)
Primary (Broad)
• Secondary (Narrow)
Secondary (Narrow)
• Tertiary (Very Specific) (May not be necessary)
Tertiary (Very Specific) (May not be necessary)
• Why is it important
Why is it important
– Basis for everything which comes after
Basis for everything which comes after
– Miss this and product/service will not be successful
Miss this and product/service will not be successful
Source: Besterfiled et al, (2003). Total Quality Management. 3rd
Ed
QFD – Step 2
QFD – Step 2
• List Technical Descriptors (HOWs)
List Technical Descriptors (HOWs)
• What are they
What are they
– Characteristics which affect the WHATs
Characteristics which affect the WHATs
• Primary (Broad)
Primary (Broad)
• Secondary (Narrow)
Secondary (Narrow)
• Tertiary (Very Specific) (May not be necessary)
Tertiary (Very Specific) (May not be necessary)
• Why is it important
Why is it important
– Translates the Customer Language in Technical
Translates the Customer Language in Technical
Language
Language
Source: Besterfiled et al, (2003). Total Quality Management. 3rd
Ed
QFD – Step 3
QFD – Step 3
• Develop a Relationship Matrix between WHATs and
Develop a Relationship Matrix between WHATs and
HOWs
HOWs
• What is it
What is it
– Strength of relationship between specific WHATs and HOWs
Strength of relationship between specific WHATs and HOWs
• +9 Strong (Symbol: ●)
+9 Strong (Symbol: ●)
• +3 Medium (Symbol: ○)
+3 Medium (Symbol: ○)
• +1 Weak (Symbol:
+1 Weak (Symbol: Δ
Δ)
)
• 0 Not Applicable (No Symbol
0 Not Applicable (No Symbol)
)
• Why is it important
Why is it important
– Determine trade-offs between conflicting characteristics
Determine trade-offs between conflicting characteristics
– Determines absolute weight at the bottom of the house
Determines absolute weight at the bottom of the house
Source: Besterfiled et al, (2003). Total Quality Management. 3rd
Ed
QFD – Step 4
QFD – Step 4
• Develop the Interrelationship Matrix between HOWs
Develop the Interrelationship Matrix between HOWs
(Correlation Matrix)
• What is it
What is it
– Strength of relationship between specific WHATs and HOWs
Strength of relationship between specific WHATs and HOWs
• +9 Strong Positive (Symbol: ●)
+9 Strong Positive (Symbol: ●)
• +3 Positive (Symbol: ○)
+3 Positive (Symbol: ○)
• -3 Negative (Symbol: X)
-3 Negative (Symbol: X)
• -9 Strong Negative (Symbol: *)
-9 Strong Negative (Symbol: *)
• Why is it important
Why is it important
– Determine which HOWs support each other and which are in
Determine which HOWs support each other and which are in
conflict
conflict
– Identify points where trade-offs must be made
Identify points where trade-offs must be made
Source: Besterfiled et al, (2003). Total Quality Management. 3rd
Ed
QFD – Step 5
QFD – Step 5
• Competitive Assessment
Competitive Assessment
• What is it
What is it
– How you rank on the WHATs compared to your
How you rank on the WHATs compared to your
competitors
competitors
– How you rank on the HOWs compared to your
How you rank on the HOWs compared to your
competitors
competitors
• Each is on a scale 1 (worst) – 5 (best)
Each is on a scale 1 (worst) – 5 (best)
– Must be congruence between WHATs and HOWs
Must be congruence between WHATs and HOWs
• Why is it important
Why is it important
– Determine if customer requirements are being met
Determine if customer requirements are being met
– Focus on areas of needed improvement
Focus on areas of needed improvement
Source: Besterfiled et al, (2003). Total Quality Management. 3rd
Ed
QFD – Step 6
QFD – Step 6
• Develop Prioritized Customer Requirements
Develop Prioritized Customer Requirements
• What is it
What is it
– Provides Absolute Numeric values to WHATs
Provides Absolute Numeric values to WHATs
• Importance to the customer
Importance to the customer
– Each is on a scale of 1 (least) – 10 (most)
Each is on a scale of 1 (least) – 10 (most)
• Target Value
Target Value
– Each is on a scale 1 (worst) – 5 (best)
Each is on a scale 1 (worst) – 5 (best)
• Scale-up Factor
Scale-up Factor
– How much improvement is necessary to get to the Target Value (Calc)
How much improvement is necessary to get to the Target Value (Calc)
• Sales Point
Sales Point
– Each is on a scale of 1.0 (lowest) – 2.0 (highest)
Each is on a scale of 1.0 (lowest) – 2.0 (highest)
• Absolute Weight
Absolute Weight
– Calculation
Calculation
Source: Besterfiled et al, (2003). Total Quality Management. 3rd
Ed
QFD – Step 6
QFD – Step 6
• Develop Prioritized Customer Requirements (Cont.)
Develop Prioritized Customer Requirements (Cont.)
• Where does the data come from
Where does the data come from
– Customer
Customer
• Focus Groups
Focus Groups
• Why is it important
Why is it important
– Determines guide for the planning phase of product
Determines guide for the planning phase of product
development
development
Source: Besterfiled et al, (2003). Total Quality Management. 3rd
Ed
QFD – Step 7
QFD – Step 7
• Develop Prioritized Technical Descriptors
Develop Prioritized Technical Descriptors
• What is it
What is it
– Provides objectives for subsequent designs and means to
Provides objectives for subsequent designs and means to
objectively assess progress and minimize subjective opinions on
the HOWs.
the HOWs.
• Degree of Difficulty
Degree of Difficulty
– Each is on a scale of 1 (least) – 10 (most)
Each is on a scale of 1 (least) – 10 (most)
• Target Value
Target Value
– Each is on a scale 1 (worst) – 5 (best)
Each is on a scale 1 (worst) – 5 (best)
• Absolute Weight
Absolute Weight
– Calculation
Calculation
• Relative Weight
Relative Weight
– Calculation
Calculation
Source: Besterfiled et al, (2003). Total Quality Management. 3rd
Ed
QFD – Process
QFD – Process
• Develop Prioritized Technical Descriptors (Cont.)
Develop Prioritized Technical Descriptors (Cont.)
• Why is it important
Why is it important
– Higher weight values point to areas where efforts need
Higher weight values point to areas where efforts need
focusing
focusing
• Absolute Weight
Absolute Weight
– a
aj
j=
= i=1
i=1
n
n
∑R
∑Rij
ijc
ci
i (Error in Book pp 341; m should be j)
(Error in Book pp 341; m should be j)
• Relative Weight
Relative Weight
– b
bj
j=
= i=1
i=1
n
n
∑R
∑Rij
ijd
di
i
Source: Besterfiled et al, (2003). Total Quality Management. 3rd
Ed
QFD
QFD
•Just Kidding
Just Kidding
QFD – Process
QFD – Process
• Phase I
Phase I
– Product Planning
Product Planning
• Phase II
Phase II
– Part Development
Part Development
• Phase III
Phase III
– Process Planning
Process Planning
• Phase IV
Phase IV
– Production Planning
Production Planning
• HOWs from the previous Phase become WHATs in
HOWs from the previous Phase become WHATs in
the next Phase
the next Phase
Source: Besterfiled et al, (2003). Total Quality Management. 3rd
Ed
QFD – Conclusion
QFD – Conclusion
• Orderly way to obtain and present information
Orderly way to obtain and present information
• Shorter product development cycle
Shorter product development cycle
• Considerably reduced start-up costs
Considerably reduced start-up costs
• Fewer engineering changes
Fewer engineering changes
• Reduced chance of oversight in design process
Reduced chance of oversight in design process
• Environment of teamwork
Environment of teamwork
• Consensus decisions
Consensus decisions
• Everything is preserved in writing
Everything is preserved in writing
Source: Besterfiled et al, (2003). Total Quality Management. 3rd
Ed

introduction to Quality Functional Deployment (QFD).ppt

  • 1.
    Quality Functional Quality Functional Deployment(QFD) Deployment (QFD) Using Teamwork for the Customer Using Teamwork for the Customer Chapter 12 Chapter 12 Kipp Reynolds Kipp Reynolds February 28, 2007 February 28, 2007
  • 2.
    QFD – Definition QFD– Definition • “ “Planning tool used to fulfill customer Planning tool used to fulfill customer expectation” expectation” • Team Based Team Based – Cross Functional Cross Functional • Voice of the Customer Voice of the Customer – Expectations Expectations – Requirements Requirements Source: Besterfiled et al, (2003). Total Quality Management. 3rd Ed
  • 3.
    QFD – Uses QFD– Uses • Product Planning Product Planning • Part Development Part Development • Process Planning Process Planning • Production Planning Production Planning • Service Industries Service Industries Source: Besterfiled et al, (2003). Total Quality Management. 3rd Ed
  • 4.
    QFD – Benefits QFD– Benefits • Improved Customer Satisfaction Improved Customer Satisfaction – Identifies Basic Needs (Customer Requirements) Identifies Basic Needs (Customer Requirements) – Focus on areas where most improvement is needed Focus on areas where most improvement is needed • Reduces Implementation Time Reduces Implementation Time – Decrease design changes Decrease design changes • Promote Teamwork Promote Teamwork • Provides Documentation Provides Documentation – Data for future designs Data for future designs • Figure 12-1 pp. 318 Figure 12-1 pp. 318 Source: Besterfiled et al, (2003). Total Quality Management. 3rd Ed
  • 5.
    QFD – InformationSources QFD – Information Sources • Customer Information comes from a combination of Customer Information comes from a combination of three pairs of sources three pairs of sources – Solicited or Unsolicited Solicited or Unsolicited – Quantitative or Qualitative Quantitative or Qualitative – Structured or Random Structured or Random • Figure 12-2 pp. 320 Figure 12-2 pp. 320 • Use an Affinity Diagram (Chp. 17) Use an Affinity Diagram (Chp. 17) – Organizes information into logical groups Organizes information into logical groups Source: Besterfiled et al, (2003). Total Quality Management. 3rd Ed
  • 6.
    QFD – Constructionof the House QFD – Construction of the House • QFD is also called the “House of Quality” QFD is also called the “House of Quality” – Because it looks like a house Because it looks like a house • Walls Walls • Roof Roof • Ceiling Ceiling • Floor Floor • Interior Interior • Like any house construction, following the plans Like any house construction, following the plans (steps) correctly will result in a good strong (steps) correctly will result in a good strong house (Quality). house (Quality). Source: Besterfiled et al, (2003). Total Quality Management. 3rd Ed
  • 7.
    QFD – Plans(Steps) QFD – Plans (Steps) • Sevens Steps to Constructing the Sevens Steps to Constructing the House of Quality House of Quality 1. 1. List Customer Requirements (WHATs) List Customer Requirements (WHATs) 2. 2. List Technical Descriptors (HOWs) List Technical Descriptors (HOWs) 3. 3. Develop a Relationship Matrix between WHATs and Develop a Relationship Matrix between WHATs and HOWs HOWs 4. 4. Develop the Interrelationship Matrix between HOWs Develop the Interrelationship Matrix between HOWs 5. 5. Competitive Assessment Competitive Assessment 6. 6. Develop Prioritized Customer Requirements Develop Prioritized Customer Requirements 7. 7. Develop Prioritized Technical Descriptors Develop Prioritized Technical Descriptors Source: Besterfiled et al, (2003). Total Quality Management. 3rd Ed
  • 8.
    QFD – Step1 QFD – Step 1 • List Customer Requirements (WHATs) List Customer Requirements (WHATs) • What are they What are they – Customer Expectations or Requirements Customer Expectations or Requirements • Primary (Broad) Primary (Broad) • Secondary (Narrow) Secondary (Narrow) • Tertiary (Very Specific) (May not be necessary) Tertiary (Very Specific) (May not be necessary) • Why is it important Why is it important – Basis for everything which comes after Basis for everything which comes after – Miss this and product/service will not be successful Miss this and product/service will not be successful Source: Besterfiled et al, (2003). Total Quality Management. 3rd Ed
  • 9.
    QFD – Step2 QFD – Step 2 • List Technical Descriptors (HOWs) List Technical Descriptors (HOWs) • What are they What are they – Characteristics which affect the WHATs Characteristics which affect the WHATs • Primary (Broad) Primary (Broad) • Secondary (Narrow) Secondary (Narrow) • Tertiary (Very Specific) (May not be necessary) Tertiary (Very Specific) (May not be necessary) • Why is it important Why is it important – Translates the Customer Language in Technical Translates the Customer Language in Technical Language Language Source: Besterfiled et al, (2003). Total Quality Management. 3rd Ed
  • 10.
    QFD – Step3 QFD – Step 3 • Develop a Relationship Matrix between WHATs and Develop a Relationship Matrix between WHATs and HOWs HOWs • What is it What is it – Strength of relationship between specific WHATs and HOWs Strength of relationship between specific WHATs and HOWs • +9 Strong (Symbol: ●) +9 Strong (Symbol: ●) • +3 Medium (Symbol: ○) +3 Medium (Symbol: ○) • +1 Weak (Symbol: +1 Weak (Symbol: Δ Δ) ) • 0 Not Applicable (No Symbol 0 Not Applicable (No Symbol) ) • Why is it important Why is it important – Determine trade-offs between conflicting characteristics Determine trade-offs between conflicting characteristics – Determines absolute weight at the bottom of the house Determines absolute weight at the bottom of the house Source: Besterfiled et al, (2003). Total Quality Management. 3rd Ed
  • 11.
    QFD – Step4 QFD – Step 4 • Develop the Interrelationship Matrix between HOWs Develop the Interrelationship Matrix between HOWs (Correlation Matrix) (Correlation Matrix) • What is it What is it – Strength of relationship between specific WHATs and HOWs Strength of relationship between specific WHATs and HOWs • +9 Strong Positive (Symbol: ●) +9 Strong Positive (Symbol: ●) • +3 Positive (Symbol: ○) +3 Positive (Symbol: ○) • -3 Negative (Symbol: X) -3 Negative (Symbol: X) • -9 Strong Negative (Symbol: *) -9 Strong Negative (Symbol: *) • Why is it important Why is it important – Determine which HOWs support each other and which are in Determine which HOWs support each other and which are in conflict conflict – Identify points where trade-offs must be made Identify points where trade-offs must be made Source: Besterfiled et al, (2003). Total Quality Management. 3rd Ed
  • 12.
    QFD – Step5 QFD – Step 5 • Competitive Assessment Competitive Assessment • What is it What is it – How you rank on the WHATs compared to your How you rank on the WHATs compared to your competitors competitors – How you rank on the HOWs compared to your How you rank on the HOWs compared to your competitors competitors • Each is on a scale 1 (worst) – 5 (best) Each is on a scale 1 (worst) – 5 (best) – Must be congruence between WHATs and HOWs Must be congruence between WHATs and HOWs • Why is it important Why is it important – Determine if customer requirements are being met Determine if customer requirements are being met – Focus on areas of needed improvement Focus on areas of needed improvement Source: Besterfiled et al, (2003). Total Quality Management. 3rd Ed
  • 13.
    QFD – Step6 QFD – Step 6 • Develop Prioritized Customer Requirements Develop Prioritized Customer Requirements • What is it What is it – Provides Absolute Numeric values to WHATs Provides Absolute Numeric values to WHATs • Importance to the customer Importance to the customer – Each is on a scale of 1 (least) – 10 (most) Each is on a scale of 1 (least) – 10 (most) • Target Value Target Value – Each is on a scale 1 (worst) – 5 (best) Each is on a scale 1 (worst) – 5 (best) • Scale-up Factor Scale-up Factor – How much improvement is necessary to get to the Target Value (Calc) How much improvement is necessary to get to the Target Value (Calc) • Sales Point Sales Point – Each is on a scale of 1.0 (lowest) – 2.0 (highest) Each is on a scale of 1.0 (lowest) – 2.0 (highest) • Absolute Weight Absolute Weight – Calculation Calculation Source: Besterfiled et al, (2003). Total Quality Management. 3rd Ed
  • 14.
    QFD – Step6 QFD – Step 6 • Develop Prioritized Customer Requirements (Cont.) Develop Prioritized Customer Requirements (Cont.) • Where does the data come from Where does the data come from – Customer Customer • Focus Groups Focus Groups • Why is it important Why is it important – Determines guide for the planning phase of product Determines guide for the planning phase of product development development Source: Besterfiled et al, (2003). Total Quality Management. 3rd Ed
  • 15.
    QFD – Step7 QFD – Step 7 • Develop Prioritized Technical Descriptors Develop Prioritized Technical Descriptors • What is it What is it – Provides objectives for subsequent designs and means to Provides objectives for subsequent designs and means to objectively assess progress and minimize subjective opinions on objectively assess progress and minimize subjective opinions on the HOWs. the HOWs. • Degree of Difficulty Degree of Difficulty – Each is on a scale of 1 (least) – 10 (most) Each is on a scale of 1 (least) – 10 (most) • Target Value Target Value – Each is on a scale 1 (worst) – 5 (best) Each is on a scale 1 (worst) – 5 (best) • Absolute Weight Absolute Weight – Calculation Calculation • Relative Weight Relative Weight – Calculation Calculation Source: Besterfiled et al, (2003). Total Quality Management. 3rd Ed
  • 16.
    QFD – Process QFD– Process • Develop Prioritized Technical Descriptors (Cont.) Develop Prioritized Technical Descriptors (Cont.) • Why is it important Why is it important – Higher weight values point to areas where efforts need Higher weight values point to areas where efforts need focusing focusing • Absolute Weight Absolute Weight – a aj j= = i=1 i=1 n n ∑R ∑Rij ijc ci i (Error in Book pp 341; m should be j) (Error in Book pp 341; m should be j) • Relative Weight Relative Weight – b bj j= = i=1 i=1 n n ∑R ∑Rij ijd di i Source: Besterfiled et al, (2003). Total Quality Management. 3rd Ed
  • 17.
  • 18.
    QFD – Process QFD– Process • Phase I Phase I – Product Planning Product Planning • Phase II Phase II – Part Development Part Development • Phase III Phase III – Process Planning Process Planning • Phase IV Phase IV – Production Planning Production Planning • HOWs from the previous Phase become WHATs in HOWs from the previous Phase become WHATs in the next Phase the next Phase Source: Besterfiled et al, (2003). Total Quality Management. 3rd Ed
  • 19.
    QFD – Conclusion QFD– Conclusion • Orderly way to obtain and present information Orderly way to obtain and present information • Shorter product development cycle Shorter product development cycle • Considerably reduced start-up costs Considerably reduced start-up costs • Fewer engineering changes Fewer engineering changes • Reduced chance of oversight in design process Reduced chance of oversight in design process • Environment of teamwork Environment of teamwork • Consensus decisions Consensus decisions • Everything is preserved in writing Everything is preserved in writing Source: Besterfiled et al, (2003). Total Quality Management. 3rd Ed