Download as PDF, PPTX

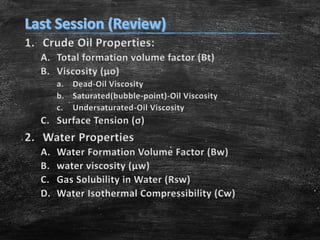


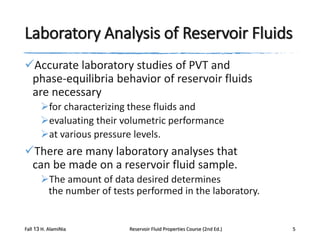
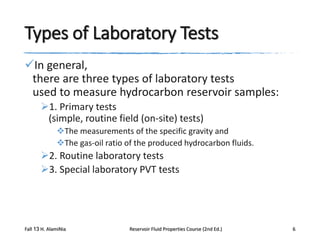
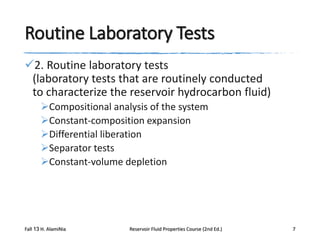
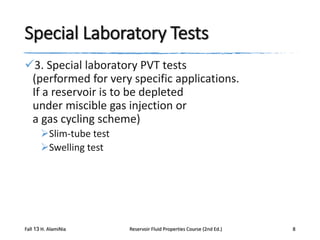

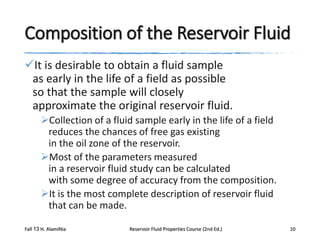


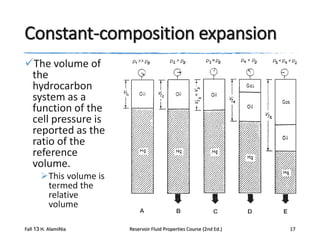

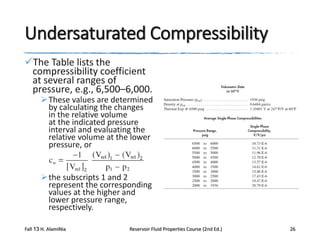


This document describes procedures for analyzing reservoir fluid properties in the laboratory, including crude oil properties, water properties, and various laboratory tests. It discusses measuring the total formation volume factor, viscosity, surface tension, and other properties of crude oil and water. It also describes primary tests conducted on-site, routine laboratory tests like compositional analysis and constant-composition expansion, and special laboratory PVT tests. The constant-composition expansion test measures saturation pressure and compressibility by reducing pressure in a cell and measuring volume changes. The results are used to calculate fluid densities and compressibility coefficients above the saturation pressure.