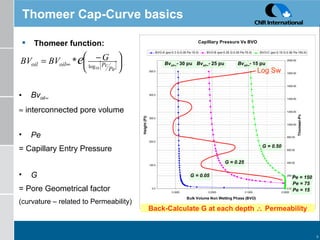
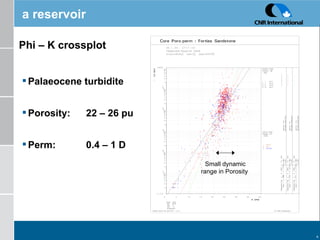
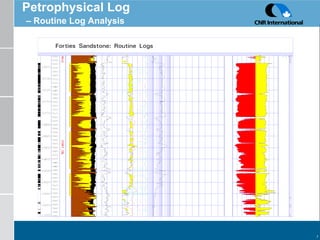
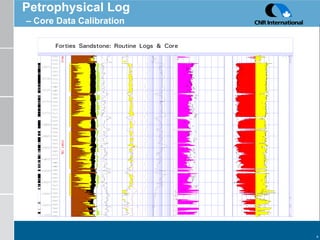
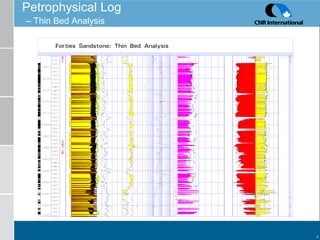
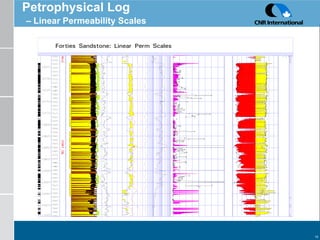
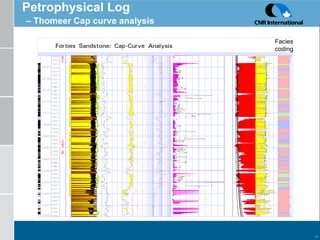
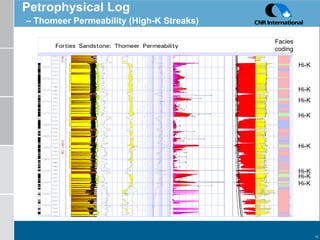
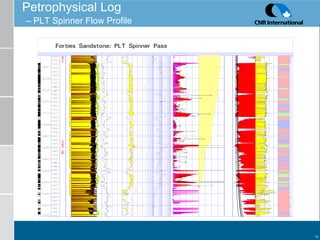
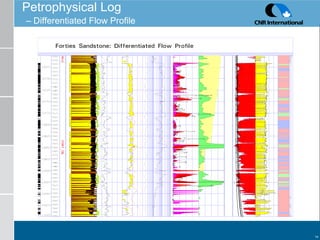
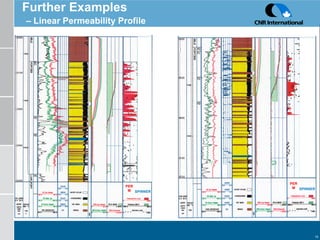
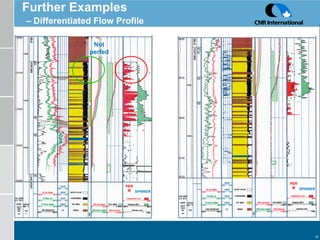
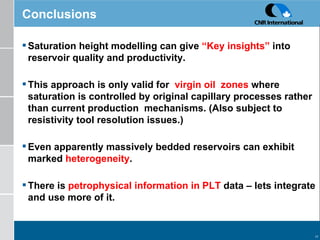
Permeability: from Cap Curve to Flowrate Graham Davis Chief Petrophysicist
Overview Saturation Height Functions Understand the reservoir controls on saturation distribution Thomeer Capillary Pressure Curve Analysis The “meaningful” co-efficients Step-by-step analysis workflow From cap-curve to flow profile Where to go from here………..? lets discuss!
Common Sat-Height(Pc) Functions Leverett-J Sigmoidal Polynomial Exponential Hyperbola Entry Height Trig-Tangent Thomeer Lambda
Thomeer Cap-Curve basics Thomeer function: Bv oil       interconnected pore volume Pe   = Capillary Entry Pressure G   = Pore Geometrical factor (curvature – related to Permeability) Bv oil  - 30 pu Bv oil  - 25 pu Bv oil  - 15 pu Pe = 150 G = 0.05 G = 0.25 G = 0.50 Back-Calculate G at each depth    Permeability Pe = 75 Pe = 15 Log Sw
a reservoir Palaeocene turbidite Porosity: 22 – 26 pu Perm: 0.4 – 1 D Phi – K crossplot Small dynamic range in Porosity
Petrophysical Log   – Routine Log Analysis
Petrophysical Log   – Core Data Calibration
Petrophysical Log   – Thin Bed Analysis
Petrophysical Log   – Linear Permeability Scales
Petrophysical Log   – Thomeer Cap curve analysis Facies coding
Petrophysical Log   – Thomeer Permeability (High-K Streaks) Hi-K Hi-K Hi-K Hi-K Hi-K Hi-K Hi-K Hi-K Facies coding
Petrophysical Log   – PLT Spinner Flow Profile
Petrophysical Log   – Differentiated Flow Profile
Further Examples   – Linear Permeability Profile PERM SPINNER PERM SPINNER
Further Examples   – Differentiated Flow Profile PERM SPINNER PERM SPINNER Not perfed
Conclusions Saturation height modelling can give  “Key insights”  into reservoir quality and productivity. This approach is only valid for  virgin oil  zones  where saturation is controlled by original capillary processes rather than current production  mechanisms. (Also subject to resistivity tool resolution issues.) Even apparently massively bedded reservoirs can exhibit marked  heterogeneity . There is  petrophysical information in PLT  data – lets integrate and use more of it.
The Premium Value, Defined Growth Independent   The Future Clearly Defined St. Magnus House,   Guild Street, Aberdeen   AB11 6NJ www.cnrl.com

Permeability From Cap Curve To Flowrate

  • 1.
    Permeability: from CapCurve to Flowrate Graham Davis Chief Petrophysicist
  • 2.
    Overview Saturation HeightFunctions Understand the reservoir controls on saturation distribution Thomeer Capillary Pressure Curve Analysis The “meaningful” co-efficients Step-by-step analysis workflow From cap-curve to flow profile Where to go from here………..? lets discuss!
  • 3.
    Common Sat-Height(Pc) FunctionsLeverett-J Sigmoidal Polynomial Exponential Hyperbola Entry Height Trig-Tangent Thomeer Lambda
  • 4.
    Common Sat-Height(Pc) FunctionsLeverett-J Sigmoidal Polynomial Exponential Hyperbola Entry Height Trig-Tangent Thomeer Lambda
  • 5.
    Thomeer Cap-Curve basicsThomeer function: Bv oil   interconnected pore volume Pe = Capillary Entry Pressure G = Pore Geometrical factor (curvature – related to Permeability) Bv oil  - 30 pu Bv oil  - 25 pu Bv oil  - 15 pu Pe = 150 G = 0.05 G = 0.25 G = 0.50 Back-Calculate G at each depth  Permeability Pe = 75 Pe = 15 Log Sw
  • 6.
    a reservoir Palaeoceneturbidite Porosity: 22 – 26 pu Perm: 0.4 – 1 D Phi – K crossplot Small dynamic range in Porosity
  • 7.
    Petrophysical Log – Routine Log Analysis
  • 8.
    Petrophysical Log – Core Data Calibration
  • 9.
    Petrophysical Log – Thin Bed Analysis
  • 10.
    Petrophysical Log – Linear Permeability Scales
  • 11.
    Petrophysical Log – Thomeer Cap curve analysis Facies coding
  • 12.
    Petrophysical Log – Thomeer Permeability (High-K Streaks) Hi-K Hi-K Hi-K Hi-K Hi-K Hi-K Hi-K Hi-K Facies coding
  • 13.
    Petrophysical Log – PLT Spinner Flow Profile
  • 14.
    Petrophysical Log – Differentiated Flow Profile
  • 15.
    Further Examples – Linear Permeability Profile PERM SPINNER PERM SPINNER
  • 16.
    Further Examples – Differentiated Flow Profile PERM SPINNER PERM SPINNER Not perfed
  • 17.
    Conclusions Saturation heightmodelling can give “Key insights” into reservoir quality and productivity. This approach is only valid for virgin oil zones where saturation is controlled by original capillary processes rather than current production mechanisms. (Also subject to resistivity tool resolution issues.) Even apparently massively bedded reservoirs can exhibit marked heterogeneity . There is petrophysical information in PLT data – lets integrate and use more of it.
  • 18.
    The Premium Value,Defined Growth Independent The Future Clearly Defined St. Magnus House, Guild Street, Aberdeen AB11 6NJ www.cnrl.com