Download as PDF, PPTX


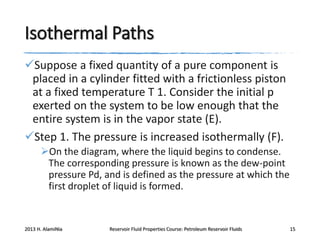
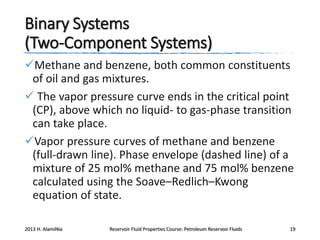
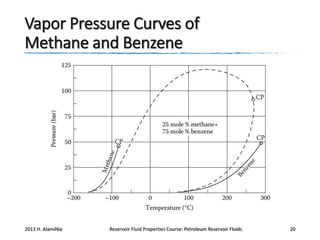
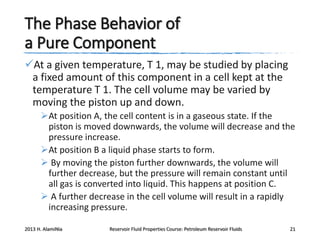

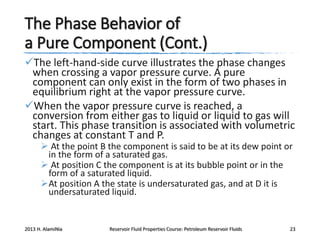


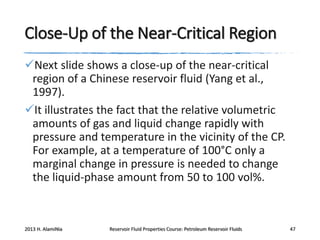


The document provides an overview of a course on reservoir fluid properties. It covers the following topics: 1. An introduction to petroleum engineering and the importance of understanding reservoir fluids. 2. The formation and extraction of petroleum, including drilling and production. 3. The constituents of reservoir fluids including hydrocarbon components like methane, paraffins, naphthenes and aromatics. It also discusses non-hydrocarbon components like water, nitrogen and carbon dioxide. 4. The phase behavior of pure components and mixtures, including phase envelopes and using pressure-temperature and pressure-volume diagrams to illustrate behavior.


![5G Explained! A High Level Overview [Introduction]](https://cdn.slidesharecdn.com/ss_thumbnails/5gexplainedahighleveloverview-260119165306-cc137a3e-thumbnail.jpg?width=640&height=640&fit=bounds)


