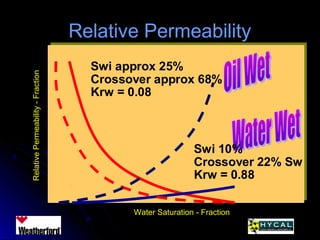
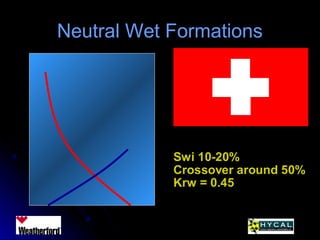
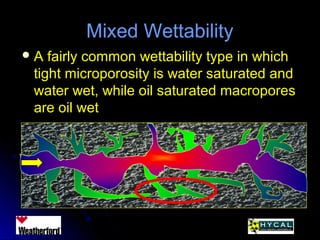
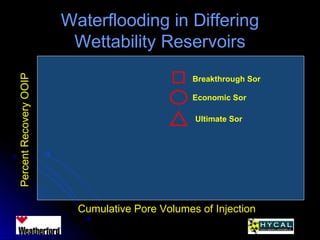
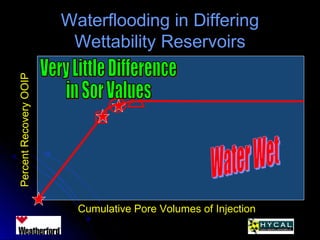
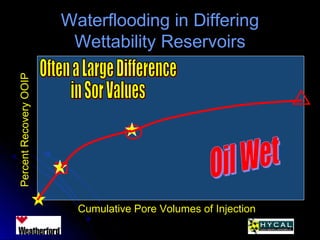
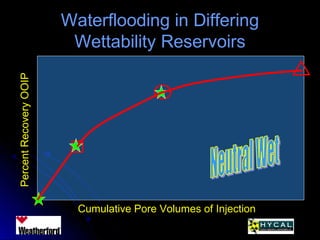
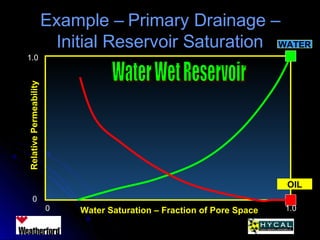
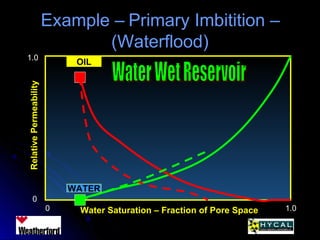
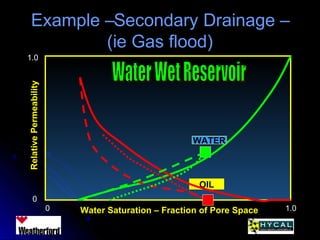
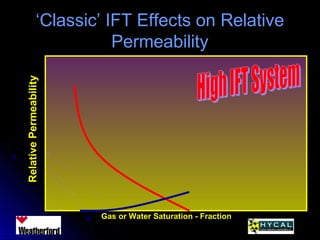
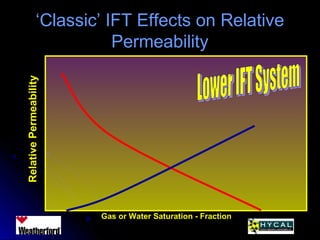
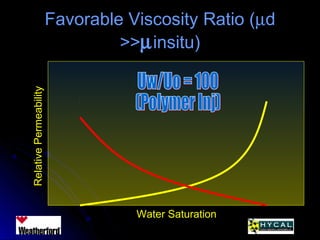
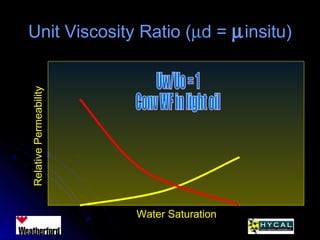
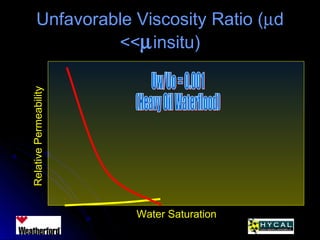
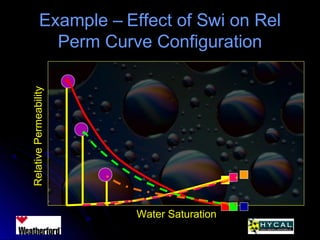
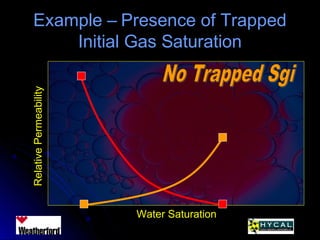
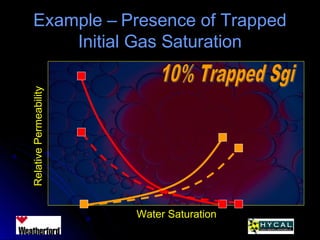
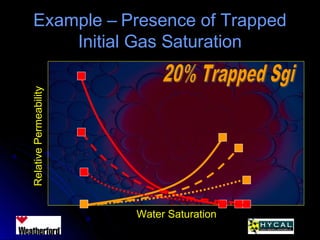
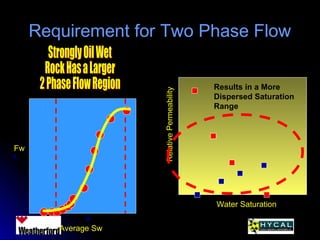
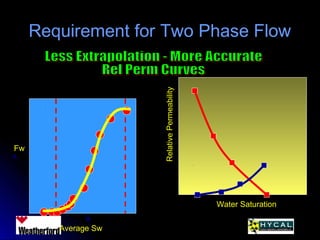
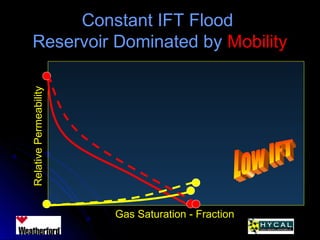
The document discusses relative permeability, which describes the ability of fluids to flow through porous media in the presence of other fluids. It covers factors that affect relative permeability like fluid saturations, rock properties, wettability, and pressure. Different wettability types can impact relative permeability curves and residual saturations. Mobility ratios also influence waterflood performance. Proper representation and measurement of relative permeability is important for reservoir evaluation and optimization.
All hydrocarbon reservoirs are surrounded by water-bearing rocks called aquifers which they effect on reservoir performance. it's a key role for production evaluation and therefore it should be managed.
calculating reservoir pressure, knowing Depth of gas-oil. oil water interface, GOC AND WOC, numeric method to calculate interface. importance of isobaric maps in estimating reservoir pressure.
Reservoir simulation modeling of the surfactant flooding using Schlumberger Petrel Simulation modeling software.
Definition and Process Description
Surfactant Conservation (Mass Balance) Equations
Simulation Solution Vector
Surfactant Effects;
Treatment of PVT data
Treatment of SCAL data
Modeling the Change in Wettability
Surfactant Keywords Summary
Simulation Model Construction
Sensitivities Runs & Simulation Results
Conclusions
Skin factor is a dimensionless parameter that quantifies the formation damage around the wellbore. it also can be negative (which indicates improvement in flow) OR positive (which means formation damage exists). Positive skin can lead to severe well production issues and thus reducing the well revenue
Why we need a Water Saturation vs. Height function for reservoir modelling.
Definitions: Free-Water-Level, HWC, Net, Swirr
Several case studies showing applications to reservoir modelling.
To determine a field’s hydrocarbon in place, it is necessary to model the distribution of hydrocarbon and water
throughout the reservoir. A water saturation vs. height (SwH) function provides this for the reservoir model. A
good SwH function ensures the three independent sources of fluid distribution data are consistent. These being
the core, formation pressure and electrical log data. The SwH function must be simple to apply, especially in
reservoirs where it is difficult to map permeability or where there appears to be multiple contacts. It must
accurately upscale the log and core derived water saturations to the reservoir model cell sizes.
This presentation clarifies the, often misunderstood, definitions for the free-water-level (FWL), transition zone
and irreducible water saturation. Using capillary pressure theory and the concept of fractals, a convincing SwH
function is derived from first principles. The derivation is simpler than with classical functions as there is no
porosity banding. Several case studies are presented showing the excellent match between the function and
well data. The function makes an accurate prediction of water saturations, even in wells where the resistivity
log was not run, due to well conditions. Logs and core data from eleven fields, with vastly different porosity and
permeability characteristics, depositional environments, and geological age, are compared. These
demonstrates how this SwH function is independent of permeability and litho-facies type and accurately
describes the reservoir fluid distribution.
The function determines the free water level, the hydrocarbon to water contact (HWC), net reservoir cut-off,
the irreducible water saturation, and the shape of the transition zone for the reservoir model. The function
provides a simple way to quality control electrical log and core data and justifies using core plug sized samples
to model water saturations on the reservoir scale. The presentation describes how the function has been used
to predict fluid contacts in wells where they are unclear, or where the contact is below the total depth of the
well. As the function uses the FWL as its base, it explains the apparently varying HWC in some fields and how
low porosity reservoirs can be fully water saturated for hundreds of feet above the FWL.
This simple convincing function calculates water saturation as a function of the height above the free water level
and the bulk volume of water and is independent of the porosity and permeability of the reservoir. It was voted
the best paper at the 1993 SPWLA Symposium in Calgary.
What is the different between the net pay and resrvoir thicknessStudent
Prepared by Yasir Albeatiy
Contact me with information below:
E-Mail: yasiralbeatiy2015@gmail.com
Phone No. + Whatsapp : +9647828319225
Facebook Page: www.facebook.com/petroleumengineeringz
Introduction to Drilling Fluid /or Mud used to drill Oil and Gas Wells into the sub-surface Hydrocarbon Reservoir. Overview of the rheological properties and general description.
YSI Activated Sludge - 3 Things You Need to Know to Improve Process ControlXylem Inc.
Join YSI’s wastewater expert, Dr. Rob Smith, as he discusses activated sludge at municipal water resource recovery facilities. Dr. Rob will review the three things you should know about activated sludge in water resource recovery facilities.
Optimization of the activated sludge process requires careful management of three critical parameters: aeration, sludge wasting, and sludge recirculation. Over the years, wastewater professionals have based their decisions on measurements from batch tests applied to grab samples. The batch measurements are representative of the process but are limited in frequency and subject to interpretation.
On the other hand, direct measurement of water chemistry is performed in the laboratory for demonstrating permit compliance on composited influent and effluent samples. The laboratory measurements provide measurements of important variables like oxygen, solids, ammonium and nitrate, but they are also limited in frequency and the samples are not representative of the process.
Online process monitoring provides the best of both strategies by directly measuring the important variables in representative samples continuously. This webinar discusses online process monitoring and control of activated sludge. Topics include:
1. Measurement principle
2. Operation and maintenance
3. Applications for energy conservation and nutrient removal.
This is an article on viscosity. It compares dynamic, absolute and kinematic viscosities, as well as their units. It is detailed and very good reading.
Similar to Relative permeability presentation (20)
Cancer cell metabolism: special Reference to Lactate PathwayAADYARAJPANDEY1
Normal Cell Metabolism:
Cellular respiration describes the series of steps that cells use to break down sugar and other chemicals to get the energy we need to function.
Energy is stored in the bonds of glucose and when glucose is broken down, much of that energy is released.
Cell utilize energy in the form of ATP.
The first step of respiration is called glycolysis. In a series of steps, glycolysis breaks glucose into two smaller molecules - a chemical called pyruvate. A small amount of ATP is formed during this process.
Most healthy cells continue the breakdown in a second process, called the Kreb's cycle. The Kreb's cycle allows cells to “burn” the pyruvates made in glycolysis to get more ATP.
The last step in the breakdown of glucose is called oxidative phosphorylation (Ox-Phos).
It takes place in specialized cell structures called mitochondria. This process produces a large amount of ATP. Importantly, cells need oxygen to complete oxidative phosphorylation.
If a cell completes only glycolysis, only 2 molecules of ATP are made per glucose. However, if the cell completes the entire respiration process (glycolysis - Kreb's - oxidative phosphorylation), about 36 molecules of ATP are created, giving it much more energy to use.
IN CANCER CELL:
Unlike healthy cells that "burn" the entire molecule of sugar to capture a large amount of energy as ATP, cancer cells are wasteful.
Cancer cells only partially break down sugar molecules. They overuse the first step of respiration, glycolysis. They frequently do not complete the second step, oxidative phosphorylation.
This results in only 2 molecules of ATP per each glucose molecule instead of the 36 or so ATPs healthy cells gain. As a result, cancer cells need to use a lot more sugar molecules to get enough energy to survive.
introduction to WARBERG PHENOMENA:
WARBURG EFFECT Usually, cancer cells are highly glycolytic (glucose addiction) and take up more glucose than do normal cells from outside.
Otto Heinrich Warburg (; 8 October 1883 – 1 August 1970) In 1931 was awarded the Nobel Prize in Physiology for his "discovery of the nature and mode of action of the respiratory enzyme.
WARNBURG EFFECT : cancer cells under aerobic (well-oxygenated) conditions to metabolize glucose to lactate (aerobic glycolysis) is known as the Warburg effect. Warburg made the observation that tumor slices consume glucose and secrete lactate at a higher rate than normal tissues.
This presentation explores a brief idea about the structural and functional attributes of nucleotides, the structure and function of genetic materials along with the impact of UV rays and pH upon them.
Seminar of U.V. Spectroscopy by SAMIR PANDASAMIR PANDA
Spectroscopy is a branch of science dealing the study of interaction of electromagnetic radiation with matter.
Ultraviolet-visible spectroscopy refers to absorption spectroscopy or reflect spectroscopy in the UV-VIS spectral region.
Ultraviolet-visible spectroscopy is an analytical method that can measure the amount of light received by the analyte.
Multi-source connectivity as the driver of solar wind variability in the heli...Sérgio Sacani
The ambient solar wind that flls the heliosphere originates from multiple
sources in the solar corona and is highly structured. It is often described
as high-speed, relatively homogeneous, plasma streams from coronal
holes and slow-speed, highly variable, streams whose source regions are
under debate. A key goal of ESA/NASA’s Solar Orbiter mission is to identify
solar wind sources and understand what drives the complexity seen in the
heliosphere. By combining magnetic feld modelling and spectroscopic
techniques with high-resolution observations and measurements, we show
that the solar wind variability detected in situ by Solar Orbiter in March
2022 is driven by spatio-temporal changes in the magnetic connectivity to
multiple sources in the solar atmosphere. The magnetic feld footpoints
connected to the spacecraft moved from the boundaries of a coronal hole
to one active region (12961) and then across to another region (12957). This
is refected in the in situ measurements, which show the transition from fast
to highly Alfvénic then to slow solar wind that is disrupted by the arrival of
a coronal mass ejection. Our results describe solar wind variability at 0.5 au
but are applicable to near-Earth observatories.
A brief information about the SCOP protein database used in bioinformatics.
The Structural Classification of Proteins (SCOP) database is a comprehensive and authoritative resource for the structural and evolutionary relationships of proteins. It provides a detailed and curated classification of protein structures, grouping them into families, superfamilies, and folds based on their structural and sequence similarities.
Introduction:
RNA interference (RNAi) or Post-Transcriptional Gene Silencing (PTGS) is an important biological process for modulating eukaryotic gene expression.
It is highly conserved process of posttranscriptional gene silencing by which double stranded RNA (dsRNA) causes sequence-specific degradation of mRNA sequences.
dsRNA-induced gene silencing (RNAi) is reported in a wide range of eukaryotes ranging from worms, insects, mammals and plants.
This process mediates resistance to both endogenous parasitic and exogenous pathogenic nucleic acids, and regulates the expression of protein-coding genes.
What are small ncRNAs?
micro RNA (miRNA)
short interfering RNA (siRNA)
Properties of small non-coding RNA:
Involved in silencing mRNA transcripts.
Called “small” because they are usually only about 21-24 nucleotides long.
Synthesized by first cutting up longer precursor sequences (like the 61nt one that Lee discovered).
Silence an mRNA by base pairing with some sequence on the mRNA.
Discovery of siRNA?
The first small RNA:
In 1993 Rosalind Lee (Victor Ambros lab) was studying a non- coding gene in C. elegans, lin-4, that was involved in silencing of another gene, lin-14, at the appropriate time in the
development of the worm C. elegans.
Two small transcripts of lin-4 (22nt and 61nt) were found to be complementary to a sequence in the 3' UTR of lin-14.
Because lin-4 encoded no protein, she deduced that it must be these transcripts that are causing the silencing by RNA-RNA interactions.
Types of RNAi ( non coding RNA)
MiRNA
Length (23-25 nt)
Trans acting
Binds with target MRNA in mismatch
Translation inhibition
Si RNA
Length 21 nt.
Cis acting
Bind with target Mrna in perfect complementary sequence
Piwi-RNA
Length ; 25 to 36 nt.
Expressed in Germ Cells
Regulates trnasposomes activity
MECHANISM OF RNAI:
First the double-stranded RNA teams up with a protein complex named Dicer, which cuts the long RNA into short pieces.
Then another protein complex called RISC (RNA-induced silencing complex) discards one of the two RNA strands.
The RISC-docked, single-stranded RNA then pairs with the homologous mRNA and destroys it.
THE RISC COMPLEX:
RISC is large(>500kD) RNA multi- protein Binding complex which triggers MRNA degradation in response to MRNA
Unwinding of double stranded Si RNA by ATP independent Helicase
Active component of RISC is Ago proteins( ENDONUCLEASE) which cleave target MRNA.
DICER: endonuclease (RNase Family III)
Argonaute: Central Component of the RNA-Induced Silencing Complex (RISC)
One strand of the dsRNA produced by Dicer is retained in the RISC complex in association with Argonaute
ARGONAUTE PROTEIN :
1.PAZ(PIWI/Argonaute/ Zwille)- Recognition of target MRNA
2.PIWI (p-element induced wimpy Testis)- breaks Phosphodiester bond of mRNA.)RNAse H activity.
MiRNA:
The Double-stranded RNAs are naturally produced in eukaryotic cells during development, and they have a key role in regulating gene expression .
Richard's entangled aventures in wonderlandRichard Gill
Since the loophole-free Bell experiments of 2020 and the Nobel prizes in physics of 2022, critics of Bell's work have retreated to the fortress of super-determinism. Now, super-determinism is a derogatory word - it just means "determinism". Palmer, Hance and Hossenfelder argue that quantum mechanics and determinism are not incompatible, using a sophisticated mathematical construction based on a subtle thinning of allowed states and measurements in quantum mechanics, such that what is left appears to make Bell's argument fail, without altering the empirical predictions of quantum mechanics. I think however that it is a smoke screen, and the slogan "lost in math" comes to my mind. I will discuss some other recent disproofs of Bell's theorem using the language of causality based on causal graphs. Causal thinking is also central to law and justice. I will mention surprising connections to my work on serial killer nurse cases, in particular the Dutch case of Lucia de Berk and the current UK case of Lucy Letby.
Deep Behavioral Phenotyping in Systems Neuroscience for Functional Atlasing a...Ana Luísa Pinho
Functional Magnetic Resonance Imaging (fMRI) provides means to characterize brain activations in response to behavior. However, cognitive neuroscience has been limited to group-level effects referring to the performance of specific tasks. To obtain the functional profile of elementary cognitive mechanisms, the combination of brain responses to many tasks is required. Yet, to date, both structural atlases and parcellation-based activations do not fully account for cognitive function and still present several limitations. Further, they do not adapt overall to individual characteristics. In this talk, I will give an account of deep-behavioral phenotyping strategies, namely data-driven methods in large task-fMRI datasets, to optimize functional brain-data collection and improve inference of effects-of-interest related to mental processes. Key to this approach is the employment of fast multi-functional paradigms rich on features that can be well parametrized and, consequently, facilitate the creation of psycho-physiological constructs to be modelled with imaging data. Particular emphasis will be given to music stimuli when studying high-order cognitive mechanisms, due to their ecological nature and quality to enable complex behavior compounded by discrete entities. I will also discuss how deep-behavioral phenotyping and individualized models applied to neuroimaging data can better account for the subject-specific organization of domain-general cognitive systems in the human brain. Finally, the accumulation of functional brain signatures brings the possibility to clarify relationships among tasks and create a univocal link between brain systems and mental functions through: (1) the development of ontologies proposing an organization of cognitive processes; and (2) brain-network taxonomies describing functional specialization. To this end, tools to improve commensurability in cognitive science are necessary, such as public repositories, ontology-based platforms and automated meta-analysis tools. I will thus discuss some brain-atlasing resources currently under development, and their applicability in cognitive as well as clinical neuroscience.
THE IMPORTANCE OF MARTIAN ATMOSPHERE SAMPLE RETURN.Sérgio Sacani
The return of a sample of near-surface atmosphere from Mars would facilitate answers to several first-order science questions surrounding the formation and evolution of the planet. One of the important aspects of terrestrial planet formation in general is the role that primary atmospheres played in influencing the chemistry and structure of the planets and their antecedents. Studies of the martian atmosphere can be used to investigate the role of a primary atmosphere in its history. Atmosphere samples would also inform our understanding of the near-surface chemistry of the planet, and ultimately the prospects for life. High-precision isotopic analyses of constituent gases are needed to address these questions, requiring that the analyses are made on returned samples rather than in situ.
THE IMPORTANCE OF MARTIAN ATMOSPHERE SAMPLE RETURN.
Relative permeability presentation
1. Relative Permeability Display VersionRelative Permeability Display Version
RelativeRelative
PermeabilityPermeability
April 2005April 2005
2. Presentation OverviewPresentation Overview
What is relative permeability & UsesWhat is relative permeability & Uses
Factors that affect relative permeabilityFactors that affect relative permeability
How does relative permeability impactHow does relative permeability impact
reservoir performance?reservoir performance?
Proper design and interpretation of relativeProper design and interpretation of relative
permeability testspermeability tests
Optimizing reservoir performance byOptimizing reservoir performance by
understanding relative permeability issuesunderstanding relative permeability issues
Summary and conclusionsSummary and conclusions
3. Common Uses of RelativeCommon Uses of Relative
Permeability DataPermeability Data
Evaluation of residual saturations andEvaluation of residual saturations and
displacement efficiency for waterflood, gasflooddisplacement efficiency for waterflood, gasflood
and various EOR processesand various EOR processes
Evaluation of flow characteristics in multiphaseEvaluation of flow characteristics in multiphase
reservoir situationsreservoir situations
Prediction of reservoir performance andPrediction of reservoir performance and
recoverable reservesrecoverable reserves
Reservoir optimization for primary, secondaryReservoir optimization for primary, secondary
and tertiary depletion operationsand tertiary depletion operations
4. Absolute Permeability – is definedAbsolute Permeability – is defined
asas
The Resistance to Fluid Flow Existing in aThe Resistance to Fluid Flow Existing in a
Porous Media When it is the Only PhasePorous Media When it is the Only Phase
PresentPresent
5. Darcy’s Law for SINGLE PhaseDarcy’s Law for SINGLE Phase
Flow in Porous Media Can beFlow in Porous Media Can be
Expressed asExpressed as
K = Q x L x u
A x DP
6. Relative Permeability – is definedRelative Permeability – is defined
asas
The Resistance to Fluid Flow Existing in aThe Resistance to Fluid Flow Existing in a
Porous Media When it is in the presencePorous Media When it is in the presence
of other mobile or immobile, immiscibleof other mobile or immobile, immiscible
fluidsfluids
7. Relative Permeability DefinitionRelative Permeability Definition
Kri = Ki(Si)
Kabs
Measured Permeability to a Specific
Phase at a Given Saturation of that Phase
Absolute (single phase) Permeability of the
Porous Media Under Consideration
Relative Permeability to
A Given Phase at Saturation
Level ‘I’ Value of That
Phase
8. ExampleExample
Absolute Permeability = 100 mD
Perm to Oil = 85 mD
Perm to water = 21 mD
Perm to gas = 14 mD
Kro = 85/100 = 0.85
Krw = 21/100 = 0.21
Krg = 14/100 = 0.14
11. Which Method of Representation isWhich Method of Representation is
the Bestthe Best
Either method is accurate as long as theEither method is accurate as long as the
correct value of the reference ‘initial’correct value of the reference ‘initial’
permeability is usedpermeability is used
Normalized basis is useful in many casesNormalized basis is useful in many cases
where ‘absolute’ permeability is unknownwhere ‘absolute’ permeability is unknown
(e.g. – preserved state core material)(e.g. – preserved state core material)
12. Saturation ConceptsSaturation Concepts
Sinit Scrit Sirr SmaxSinitial
Initial Saturation (Swi)
Represents the initial water
Saturation present in the
Reservoir before any man induced
External influences
Critical (Swcrit) Saturation refers
To the water saturation at
Which the water phase first
Is able to move – note in many
Reservoirs than Swi is NOT the
Same as Swcrit (dehydrated
Or undersaturated reservoir)
The maximum saturation (Swmax) is the
Maximum water saturation present under
Floodout conditions (a residual oil or trapped
Gas saturation would comprise the
Remainder of the pore system)
The Irreducible or Trapped water saturation
(Swirr) represents the water saturation
Present after the saturation has been increased
Beyond the critical value and then
Subsequently reduced – it is often (almost
Always) greater than Scrit
13. Major Factors Impacting RelativeMajor Factors Impacting Relative
PermeabilityPermeability
Fluid SaturationsFluid Saturations
Rock PropertiesRock Properties
WettabilityWettability
Saturation HistorySaturation History
14. Other Factors Which Also InfluenceOther Factors Which Also Influence
Relative PermeabilityRelative Permeability
Overburden PressureOverburden Pressure
In-Situ Stresses and HydrationIn-Situ Stresses and Hydration
TemperatureTemperature
IFTIFT
ViscosityViscosity
Initial Fluid SaturationsInitial Fluid Saturations
Immobile PhasesImmobile Phases
Displacement RatesDisplacement Rates
Core handling and PreservationCore handling and Preservation
15. Saturation Effects on RelativeSaturation Effects on Relative
PermeabilityPermeability
Water Saturation Gas Saturation Liquid Saturation
16. Saturation Effects on RelativeSaturation Effects on Relative
PermeabilityPermeability
Strongly dependant function of saturationStrongly dependant function of saturation
Rel perm is always expressed as aRel perm is always expressed as a
saturation functionsaturation function
17. Pore GeometryPore Geometry
Relative permeability is strongly impactedRelative permeability is strongly impacted
by the specific geometry/tortuosity of theby the specific geometry/tortuosity of the
pore system under considerationpore system under consideration
Grain sizeGrain size
Pore sizePore size
Aspect ratioAspect ratio
Presence of vugs/natural fracturesPresence of vugs/natural fractures
WormholesWormholes
Horizontal laminationsHorizontal laminations
18. Example of Rel Perm Curves for aExample of Rel Perm Curves for a
System Dominated bySystem Dominated by
Macroporosity (e.g. – fractures)Macroporosity (e.g. – fractures)
29. Mixed WettabilityMixed Wettability
A fairly common wettability type in whichA fairly common wettability type in which
tight microporosity is water saturated andtight microporosity is water saturated and
water wet, while oil saturated macroporeswater wet, while oil saturated macropores
are oil wetare oil wet
33. Concept of ‘Mobility Ratio’Concept of ‘Mobility Ratio’
M = µο x Krw
µ w x K r o
Mobility Ratio
Viscosity of
Displaced Phase
Rel Perm of
Displacing
Phase
Viscosity of
Displacing Phase
Rel Perm of
Displaced Phase
34. Factors Improving MobilityFactors Improving Mobility
M = µο x Krw
µ w x K r o
Low Oil ViscosityLow Krw/Krg Value
High Displacing Phase Viscosity
High Kro Value
35. Example – Waterflood in aExample – Waterflood in a
Favorable Mobility System (M=0.5)Favorable Mobility System (M=0.5)
36. Example – Waterflood in aExample – Waterflood in a
Unfavorable Mobility SystemUnfavorable Mobility System
(M=20)(M=20)
38. Breakthrough SorBreakthrough Sor
Refers to residual oil saturation in theRefers to residual oil saturation in the
swept pattern at the time ofswept pattern at the time of firstfirst waterwater
productionproduction
INJ PROD
39. Economic SorEconomic Sor
Refers to residual oil saturation in theRefers to residual oil saturation in the
swept pattern at the time ofswept pattern at the time of MaximumMaximum
EconomicEconomic water cutwater cut
INJ PROD
40. Ultimate (True) SorUltimate (True) Sor
Refers to residual oil saturation in theRefers to residual oil saturation in the
swept pattern if a nearswept pattern if a near InfiniteInfinite volume ofvolume of
water were displaced to near zero oil cutwater were displaced to near zero oil cut
INJ PROD
41. Lab Measurements of SorLab Measurements of Sor
Lab measurements of Sor generally give aLab measurements of Sor generally give a
reasonable approximation of thereasonable approximation of the
ULTIMATE Sor since usually a very largeULTIMATE Sor since usually a very large
number of pore volumes of displacementnumber of pore volumes of displacement
are conducted (10-100 typical)are conducted (10-100 typical)
42. Waterflooding in DifferingWaterflooding in Differing
Wettability ReservoirsWettability Reservoirs
Cumulative Pore Volumes of Injection
PercentRecoveryOOIP
Breakthrough Sor
Economic Sor
Ultimate Sor
46. Relative Permeability HysteresisRelative Permeability Hysteresis
Relative Permeability is not a uniqueRelative Permeability is not a unique
function of saturationfunction of saturation
The relative permeability value dependsThe relative permeability value depends
on the direction of saturation changeon the direction of saturation change
47. Example – Primary Drainage –Example – Primary Drainage –
Initial Reservoir SaturationInitial Reservoir Saturation
Water Saturation – Fraction of Pore Space
RelativePermeability
0 1.0
0
1.0
WATER
OIL
48. Example – Primary Imbitition –Example – Primary Imbitition –
(Waterflood)(Waterflood)
Water Saturation – Fraction of Pore Space
RelativePermeability
0 1.0
0
1.0
WATER
OIL
49. Example – Primary Imbitition –Example – Primary Imbitition –
(Waterflood)(Waterflood)
Water Saturation – Fraction of Pore Space
RelativePermeability
0 1.0
0
1.0
WATER
OIL
50. Example –Secondary Drainage –Example –Secondary Drainage –
(ie Gas flood)(ie Gas flood)
Water Saturation – Fraction of Pore Space
RelativePermeability
0 1.0
0
1.0
WATER
OIL
51. Effect of Confining (Overburden)Effect of Confining (Overburden)
Pressure on Relative PermeabilityPressure on Relative Permeability
Increased overburden pressure causesIncreased overburden pressure causes
compaction andcompaction and a reductiona reduction in absolutein absolute
permeabilitypermeability
Changes inChanges in pore geometrypore geometry may also affectmay also affect
relative permeabilityrelative permeability
Proper net overburden pressure should beProper net overburden pressure should be
used in all determinationsused in all determinations
52. Effect of Temperature on RelativeEffect of Temperature on Relative
PermeabilityPermeability
Modifies WettabilityModifies Wettability
Changes Viscosity RatioChanges Viscosity Ratio
Changes IFTChanges IFT
May Alter Rel PermMay Alter Rel Perm
Tests Should be Run At Temp Of InterestTests Should be Run At Temp Of Interest
53. Effect of Interfacial Tension (IFT)Effect of Interfacial Tension (IFT)
IFT is aIFT is a very strong factorvery strong factor in controllingin controlling
residual saturations and relativeresidual saturations and relative
permeability curve endpoints andpermeability curve endpoints and
configurationsconfigurations
Proper IFT conditions are essential to aProper IFT conditions are essential to a
proper relative permeability determinationproper relative permeability determination
54. IFT EffectsIFT Effects
The level of the IFT controls both theThe level of the IFT controls both the
magnitude of the residual saturations inmagnitude of the residual saturations in
accessible pore spaceaccessible pore space and the degree ofand the degree of
‘interference’ between phases‘interference’ between phases
Residual saturation is controlled byResidual saturation is controlled by
capillary pressure, the lower the IFT, thecapillary pressure, the lower the IFT, the
lower the capillary pressurelower the capillary pressure
55. Effect of IFT on Rel Perm and SorEffect of IFT on Rel Perm and Sor
Is highly dependant on wettability, poreIs highly dependant on wettability, pore
geometry and pore system accessibilitygeometry and pore system accessibility
Not all low/zero IFT systems give highNot all low/zero IFT systems give high
recoveryrecovery
Concept of IFT vs. Mobility dominatedConcept of IFT vs. Mobility dominated
displacements in porous mediadisplacements in porous media
56. ‘‘Classic’ IFT Effects on RelativeClassic’ IFT Effects on Relative
PermeabilityPermeability
Gas or Water Saturation - Fraction
RelativePermeability
57. ‘‘Classic’ IFT Effects on RelativeClassic’ IFT Effects on Relative
PermeabilityPermeability
Gas or Water Saturation - Fraction
RelativePermeability
58. ‘‘Classic’ IFT Effects on RelativeClassic’ IFT Effects on Relative
PermeabilityPermeability
Gas or Water Saturation - Fraction
RelativePermeability
59. Using Proper IFTUsing Proper IFT
Avoid treated fluidsAvoid treated fluids
Avoid surfactants and de-emulsifiersAvoid surfactants and de-emulsifiers
Live reservoir fluids should be usedLive reservoir fluids should be used
62. Viscosity EffectsViscosity Effects
Considerably controversy in the pastConsiderably controversy in the past
Classically rel perm considered to beClassically rel perm considered to be
purely a rock functionpurely a rock function
Research has indicated that viscosity ratioResearch has indicated that viscosity ratio
can strongly affect rel perm curvecan strongly affect rel perm curve
configuration and location of endpointsconfiguration and location of endpoints
Use of proper live reservoir fluids isUse of proper live reservoir fluids is
required to mimic proper viscosity ratiorequired to mimic proper viscosity ratio
63. Favorable Viscosity Ratio (Favorable Viscosity Ratio (µµdd
>>>>µµinsitu)insitu)RelativePermeability
Water Saturation
64. Unit Viscosity Ratio (Unit Viscosity Ratio (µµd =d = µµinsitu)insitu)RelativePermeability
Water Saturation
65. Unfavorable Viscosity Ratio (Unfavorable Viscosity Ratio (µµdd
<<<<µµinsitu)insitu)RelativePermeability
Water Saturation
66. Initial SaturationsInitial Saturations
Proper level of initial water saturation inProper level of initial water saturation in
the matrix for testing is essential forthe matrix for testing is essential for
accurate relative permeabilityaccurate relative permeability
measurementsmeasurements
Value of Swi can strongly effect originalValue of Swi can strongly effect original
Ko or Kg endpoint permeabilityKo or Kg endpoint permeability
Incorrect values of Swi can have aIncorrect values of Swi can have a
laterally shifting effect on the entirelaterally shifting effect on the entire
relative permeability curverelative permeability curve
67. Example – Effect of Swi on Ko/KgExample – Effect of Swi on Ko/KgRelativePermeability
Water Saturation
68. Example – Effect of Swi on RelExample – Effect of Swi on Rel
Perm Curve ConfigurationPerm Curve ConfigurationRelativePermeability
Water Saturation
69. Presence of a Mobile or ImmobilePresence of a Mobile or Immobile
Third PhaseThird Phase
Generally free or trapped gas in a water-Generally free or trapped gas in a water-
oil situationoil situation
Trapped oil saturation may exist in someTrapped oil saturation may exist in some
water-gas systemswater-gas systems
Trapped saturations generally reduceTrapped saturations generally reduce
perm to both phasesperm to both phases
Mobile third saturations may selectivelyMobile third saturations may selectively
reduce perm more to one phase thanreduce perm more to one phase than
anotheranother
70. Example – Presence of TrappedExample – Presence of Trapped
Initial Gas SaturationInitial Gas SaturationRelativePermeability
Water Saturation
71. Example – Presence of TrappedExample – Presence of Trapped
Initial Gas SaturationInitial Gas SaturationRelativePermeability
Water Saturation
72. Example – Presence of TrappedExample – Presence of Trapped
Initial Gas SaturationInitial Gas SaturationRelativePermeability
Water Saturation
73. Capillary End EffectsCapillary End Effects
Caused by a discontinuity in capillaryCaused by a discontinuity in capillary
pressure at the outlet face of the corepressure at the outlet face of the core
samplesample
74. Consequences of an End EffectConsequences of an End Effect
Commence Water
Injection
Delayed Production of Water
& Dp due to End Effect
75. Consequences of an End EffectConsequences of an End Effect
Delayed water breakthrough timesDelayed water breakthrough times
Zone of ‘Stagnant’ fluid at end of sampleZone of ‘Stagnant’ fluid at end of sample
Reduced apparent perm to water at lowerReduced apparent perm to water at lower
displacement ratesdisplacement rates
76. Mitigation of End EffectsMitigation of End Effects
High rates and delta PHigh rates and delta P
Long coresLong cores
Pressure tapped coresPressure tapped cores
Semi permeable membranesSemi permeable membranes
Numerical simulation methodsNumerical simulation methods
‘‘Bump’ floodsBump’ floods
78. Common Determination MethodsCommon Determination Methods
Steady StateSteady State
Unsteady StateUnsteady State
CentrifugeCentrifuge
Ambient vs. Reservoir Condition TestingAmbient vs. Reservoir Condition Testing
79. Sample SelectionSample Selection
Rock typing and classificationRock typing and classification
Single plug vs. composite stacksSingle plug vs. composite stacks
Plug vs. full diameter testingPlug vs. full diameter testing
Vertical vs. horizontal flooding methodsVertical vs. horizontal flooding methods
81. The Steady State DeterminationThe Steady State Determination
Method for Relative Permeability (2Method for Relative Permeability (2
Phase)Phase)
RelativePermeability
Water Saturation
Sample at Initial Conditions of
Water (Irreducible) and Oil
(Maximum) Saturation
82. The Steady State DeterminationThe Steady State Determination
Method for Relative Permeability (2Method for Relative Permeability (2
Phase)Phase)
RelativePermeability
Water Saturation
Commence Injection of 100%
Oil at Swi, Measure Ko at
Swi
83. The Steady State DeterminationThe Steady State Determination
Method for Relative Permeability (2Method for Relative Permeability (2
Phase)Phase)
RelativePermeability
Water Saturation
Commence Injection of 90%
Oil and 10% water, Measure Ko
And Kw at New Stabilized
Higher Sw
84. The Steady State DeterminationThe Steady State Determination
Method for Relative Permeability (2Method for Relative Permeability (2
Phase)Phase)
RelativePermeability
Water Saturation
Commence Injection of 70%
Oil and 30% water, Measure Ko
And Kw at New Stabilized
Higher Sw
85. The Steady State DeterminationThe Steady State Determination
Method for Relative Permeability (2Method for Relative Permeability (2
Phase)Phase)
RelativePermeability
Water Saturation
Commence Injection of 30%
Oil and 70% water, Measure Ko
And Kw at New Stabilized
Higher Sw
86. The Steady State DeterminationThe Steady State Determination
Method for Relative Permeability (2Method for Relative Permeability (2
Phase)Phase)
RelativePermeability
Water Saturation
Commence Injection of 10%
Oil and 90% water, Measure Ko
And Kw at New Stabilized
Higher Sw
87. The Steady State DeterminationThe Steady State Determination
Method for Relative Permeability (2Method for Relative Permeability (2
Phase)Phase)
RelativePermeability
Water Saturation
Commence Injection of 0%
Oil and 100% water, Measure
Kw at Sorw
88. The Steady State DeterminationThe Steady State Determination
Method for Relative Permeability (2Method for Relative Permeability (2
Phase)Phase)
RelativePermeability
Water Saturation
89. Advantages of the Steady StateAdvantages of the Steady State
MethodMethod
Computationally very simpleComputationally very simple
Inherently stable (no viscous effects)Inherently stable (no viscous effects)
Test modifications can reduce or eliminateTest modifications can reduce or eliminate
impact of capillary end effectsimpact of capillary end effects
‘‘Classic’ method of relative permeabilityClassic’ method of relative permeability
determinationdetermination
90. Disadvantages of the Steady StateDisadvantages of the Steady State
MethodMethod
Complex and expensive method, very timeComplex and expensive method, very time
consumingconsuming
Difficult and expensive for full reservoirDifficult and expensive for full reservoir
conditionsconditions
Large volumes of reservoir fluids requiredLarge volumes of reservoir fluids required
In-situ saturation monitoring essential forIn-situ saturation monitoring essential for
accuracyaccuracy
More of a research method in many casesMore of a research method in many cases
than a viable commercial techniquethan a viable commercial technique
91. Typical Steady State ApparatusTypical Steady State Apparatus
Capillary Contact Paper
Inlet Section Outlet Section
92. Typical Steady State ApparatusTypical Steady State Apparatus
Pressure Taps
External Core Sleeve
Flow Head Flow Head
93. Steady State ApparatusSteady State Apparatus
Water Inj Pump
Oil Inj Pump
Injection Pumps
Coreholder
In-Situ Saturation
Monitoring
Three Phase
Separator
BPR
Piston
Cylinders
Pressure Transducers
Core Sample
OVEN
99. Unsteady State Method for RelativeUnsteady State Method for Relative
Permeability (2 Phase)Permeability (2 Phase)
RelativePermeability
Water Saturation
Sample at Initial Conditions of
Water (Irreducible) and Oil
(Maximum) Saturation
100. Unsteady Steady State Method forUnsteady Steady State Method for
Relative Permeability (2 Phase)Relative Permeability (2 Phase)
RelativePermeability
Water Saturation
Commence Injection of 100%
Oil at Swi, Measure Ko at
Swi
101. Unsteady Steady State Method forUnsteady Steady State Method for
Relative Permeability (2 Phase)Relative Permeability (2 Phase)
RelativePermeability
Water Saturation
Switch to Injection of 100%
Water at Swi, Measure Transient
Pressure and Production
History
102. Transient Pressure and ProductionTransient Pressure and Production
HistoryHistory
DifferentialPressure
Cumulative Run Time
Breakthrough
Point
103. Transient Pressure and ProductionTransient Pressure and Production
HistoryHistory
ProductionRate
Cumulative Run Time
Breakthrough
Point
104. Transient Pressure and ProductionTransient Pressure and Production
HistoryHistory
ProductionVolume
Cumulative Run Time
Breakthrough
Point
105. The Unsteady State DeterminationThe Unsteady State Determination
Method for Relative Permeability (2Method for Relative Permeability (2
Phase)Phase)
RelativePermeability
Water Saturation
106. Advantages of the Unsteady StateAdvantages of the Unsteady State
MethodMethod
RapidRapid
Relatively inexpensive, even for fullRelatively inexpensive, even for full
reservoir condition HTHP testsreservoir condition HTHP tests
Limited reservoir fluid requirementsLimited reservoir fluid requirements
Easy to run at full reservoir conditionsEasy to run at full reservoir conditions
Simpler equipment and procedures thanSimpler equipment and procedures than
steady statesteady state
107. Disadvantages of the UnsteadyDisadvantages of the Unsteady
State MethodState Method
Unstable flow possibleUnstable flow possible
Capillary end effects possibleCapillary end effects possible
More complex data reduction proceduresMore complex data reduction procedures
Data may be poorly conditionedData may be poorly conditioned
depending on computational method useddepending on computational method used
to regress transient lab resultsto regress transient lab results
108. Typical Unsteady State ApparatusTypical Unsteady State Apparatus
Injection Pump
Coreholder
Three Phase
Separator
BPR
Piston
Cylinders
Pressure Transducers
Core Sample
OVEN
110. Centrifuge MethodsCentrifuge Methods
Use transient production vs. capillary pressureUse transient production vs. capillary pressure
history to generate psuedo rel perm curvehistory to generate psuedo rel perm curve
Limited to very small samples and higher permLimited to very small samples and higher perm
mediamedia
Reservoir condition tests can not be easilyReservoir condition tests can not be easily
conductedconducted
Common requirement to augment SS or USS relCommon requirement to augment SS or USS rel
perm experiments for evaluation of near Sor &perm experiments for evaluation of near Sor &
Swir rel perm effects – always history matchedSwir rel perm effects – always history matched
for integration of the two methodsfor integration of the two methods
111. What is the Best Method to Use?What is the Best Method to Use?
112. What is the Best Method to UseWhat is the Best Method to Use
Many of the limitations of the unsteadyMany of the limitations of the unsteady
state method have been overcome instate method have been overcome in
recent years by experimental andrecent years by experimental and
numerical modificationsnumerical modifications
95% plus of all commercial rel perm95% plus of all commercial rel perm
measurements are conducted usingmeasurements are conducted using
variants of the unsteady state methodvariants of the unsteady state method
113. Requirement for Two Phase FlowRequirement for Two Phase Flow
Fw
Average Sw
Water Saturation
RelativePermeability
Results in Highly
Compressed Saturation
Range
114. Requirement for Two Phase FlowRequirement for Two Phase Flow
Fw
Average Sw
Water Saturation
RelativePermeability
115. Requirement for Two Phase FlowRequirement for Two Phase Flow
Fw
Average Sw
Water Saturation
RelativePermeability
Results in a More
Dispersed Saturation
Range
116. Requirement for Two Phase FlowRequirement for Two Phase Flow
Fw
Average Sw
Water Saturation
RelativePermeability
117. Common Techniques Used in theCommon Techniques Used in the
Past to Disperse FlowPast to Disperse Flow
Viscous refines oils used instead ofViscous refines oils used instead of
reservoir oil to ‘smear’ production profilereservoir oil to ‘smear’ production profile
Problem – wrong viscosity, IFT andProblem – wrong viscosity, IFT and
possibly wettabilitypossibly wettability
High rate displacementsHigh rate displacements
Problem – unstable flowProblem – unstable flow
119. Simulation or ‘History Matching’Simulation or ‘History Matching’
Generation of Rel Perm DataGeneration of Rel Perm Data
Most common current techniqueMost common current technique
Basically a numerical simulation study inBasically a numerical simulation study in
reversereverse
120. History Matching TechniqueHistory Matching Technique
In a normal simulation we know the relIn a normal simulation we know the rel
perm curves and we use this, along withperm curves and we use this, along with
other input data, to predict the reservoirother input data, to predict the reservoir
pressure and production historypressure and production history
In the history matching method we knowIn the history matching method we know
the pressure and production history fromthe pressure and production history from
the lab tests, and we use this data in anthe lab tests, and we use this data in an
iterative fashion to generate the rel permiterative fashion to generate the rel perm
curvescurves
121. Typical History Match ModelTypical History Match Model
Input Physical Parameters (L, A, Kabs, Porosity, Pore Volume, # Blocks
Input Fluid Properties – Viscosity, Density, Rate, Initial Saturations
Input Test Properties – Endpoint Perms and Saturations, Pressure
History, Production History
Input Cap Pressure
and Outlet
Boundary Cond-
ition to Model
Capillary Effects
129. History Matching ProcessHistory Matching Process
Continue the iterative process until theContinue the iterative process until the
error between the stimulated and actualerror between the stimulated and actual
production and pressure data is as smallproduction and pressure data is as small
as possibleas possible
The resulting set of rel perm curvesThe resulting set of rel perm curves
represent the best fit to the lab generatedrepresent the best fit to the lab generated
datadata
Algorithms to avoid localized or non-Algorithms to avoid localized or non-
physical solutionsphysical solutions
131. Conventional Relative PermeabilityConventional Relative Permeability
TestsTests
Only provide data in the range of mobileOnly provide data in the range of mobile
fluid saturationsfluid saturations
Presence and effect of critical fluidPresence and effect of critical fluid
saturations is essential in many processessaturations is essential in many processes
Special tests and procedures are requiredSpecial tests and procedures are required
to precisely measure these saturationsto precisely measure these saturations
and their effect on relative permeabilityand their effect on relative permeability
132. Specialty Rel Perm ExperimentsSpecialty Rel Perm Experiments
Critical condensate floodsCritical condensate floods
Constant IFT floodsConstant IFT floods
Above are two examples of super normalAbove are two examples of super normal
relative permeability experimentsrelative permeability experiments
133. Critical condensate floodsCritical condensate floods
Rich gas condensatesRich gas condensates
Produced below dew point at near wellboreProduced below dew point at near wellbore
Two stage experimentTwo stage experiment
Stage 1: establish critical condensate satStage 1: establish critical condensate sat
Incremental pressure decrements in pore spacesIncremental pressure decrements in pore spaces
Flood with equilibrium gasFlood with equilibrium gas
Stop at first sign of condensate productionStop at first sign of condensate production
Stage 2: Steady state gas & condensate floodStage 2: Steady state gas & condensate flood
Equilibrium gas & condensateEquilibrium gas & condensate
Gas saturation decreasingGas saturation decreasing
Stop at trapped gas – residual gas saturationStop at trapped gas – residual gas saturation
135. Constant IFT FloodsConstant IFT Floods
Create high IFT injection gas & oilCreate high IFT injection gas & oil
ie models the near well bore for vaporizing driveie models the near well bore for vaporizing drive
Create low IFT injection gas & oilCreate low IFT injection gas & oil
ie models deep reservoir for vaporizing driveie models deep reservoir for vaporizing drive
Run two floods on matched core stacksRun two floods on matched core stacks
Compare results to determine IFTCompare results to determine IFT
domination versus other controls ofdomination versus other controls of
incremental oil recoveryincremental oil recovery
Ie mobility, pore geometry…Ie mobility, pore geometry…