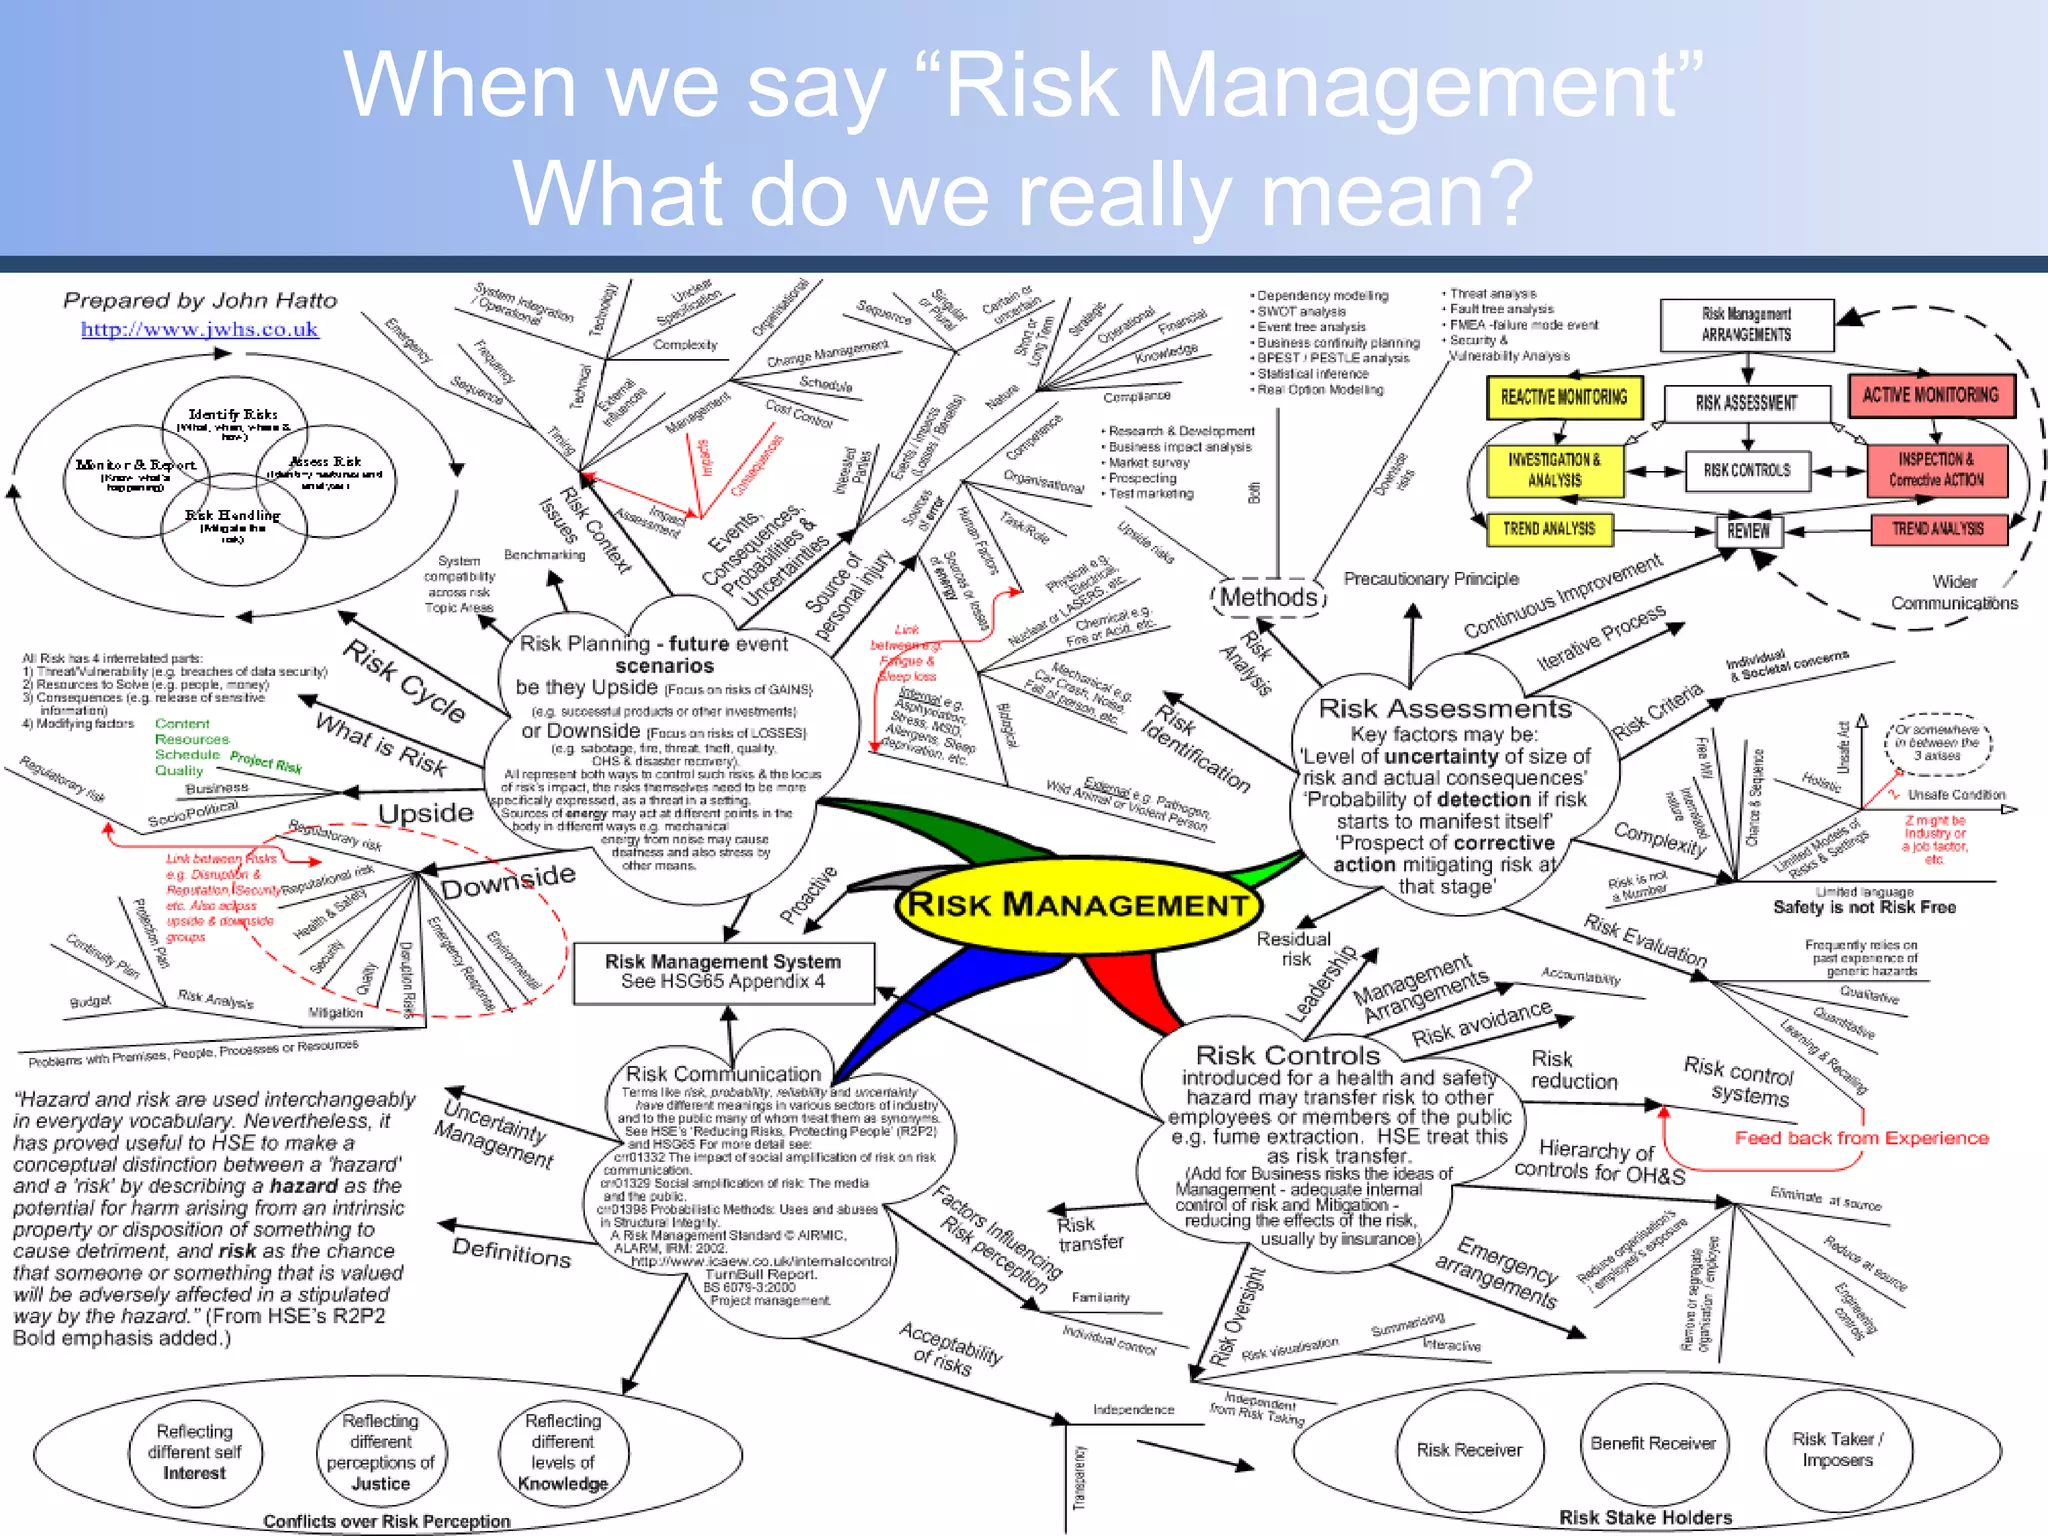
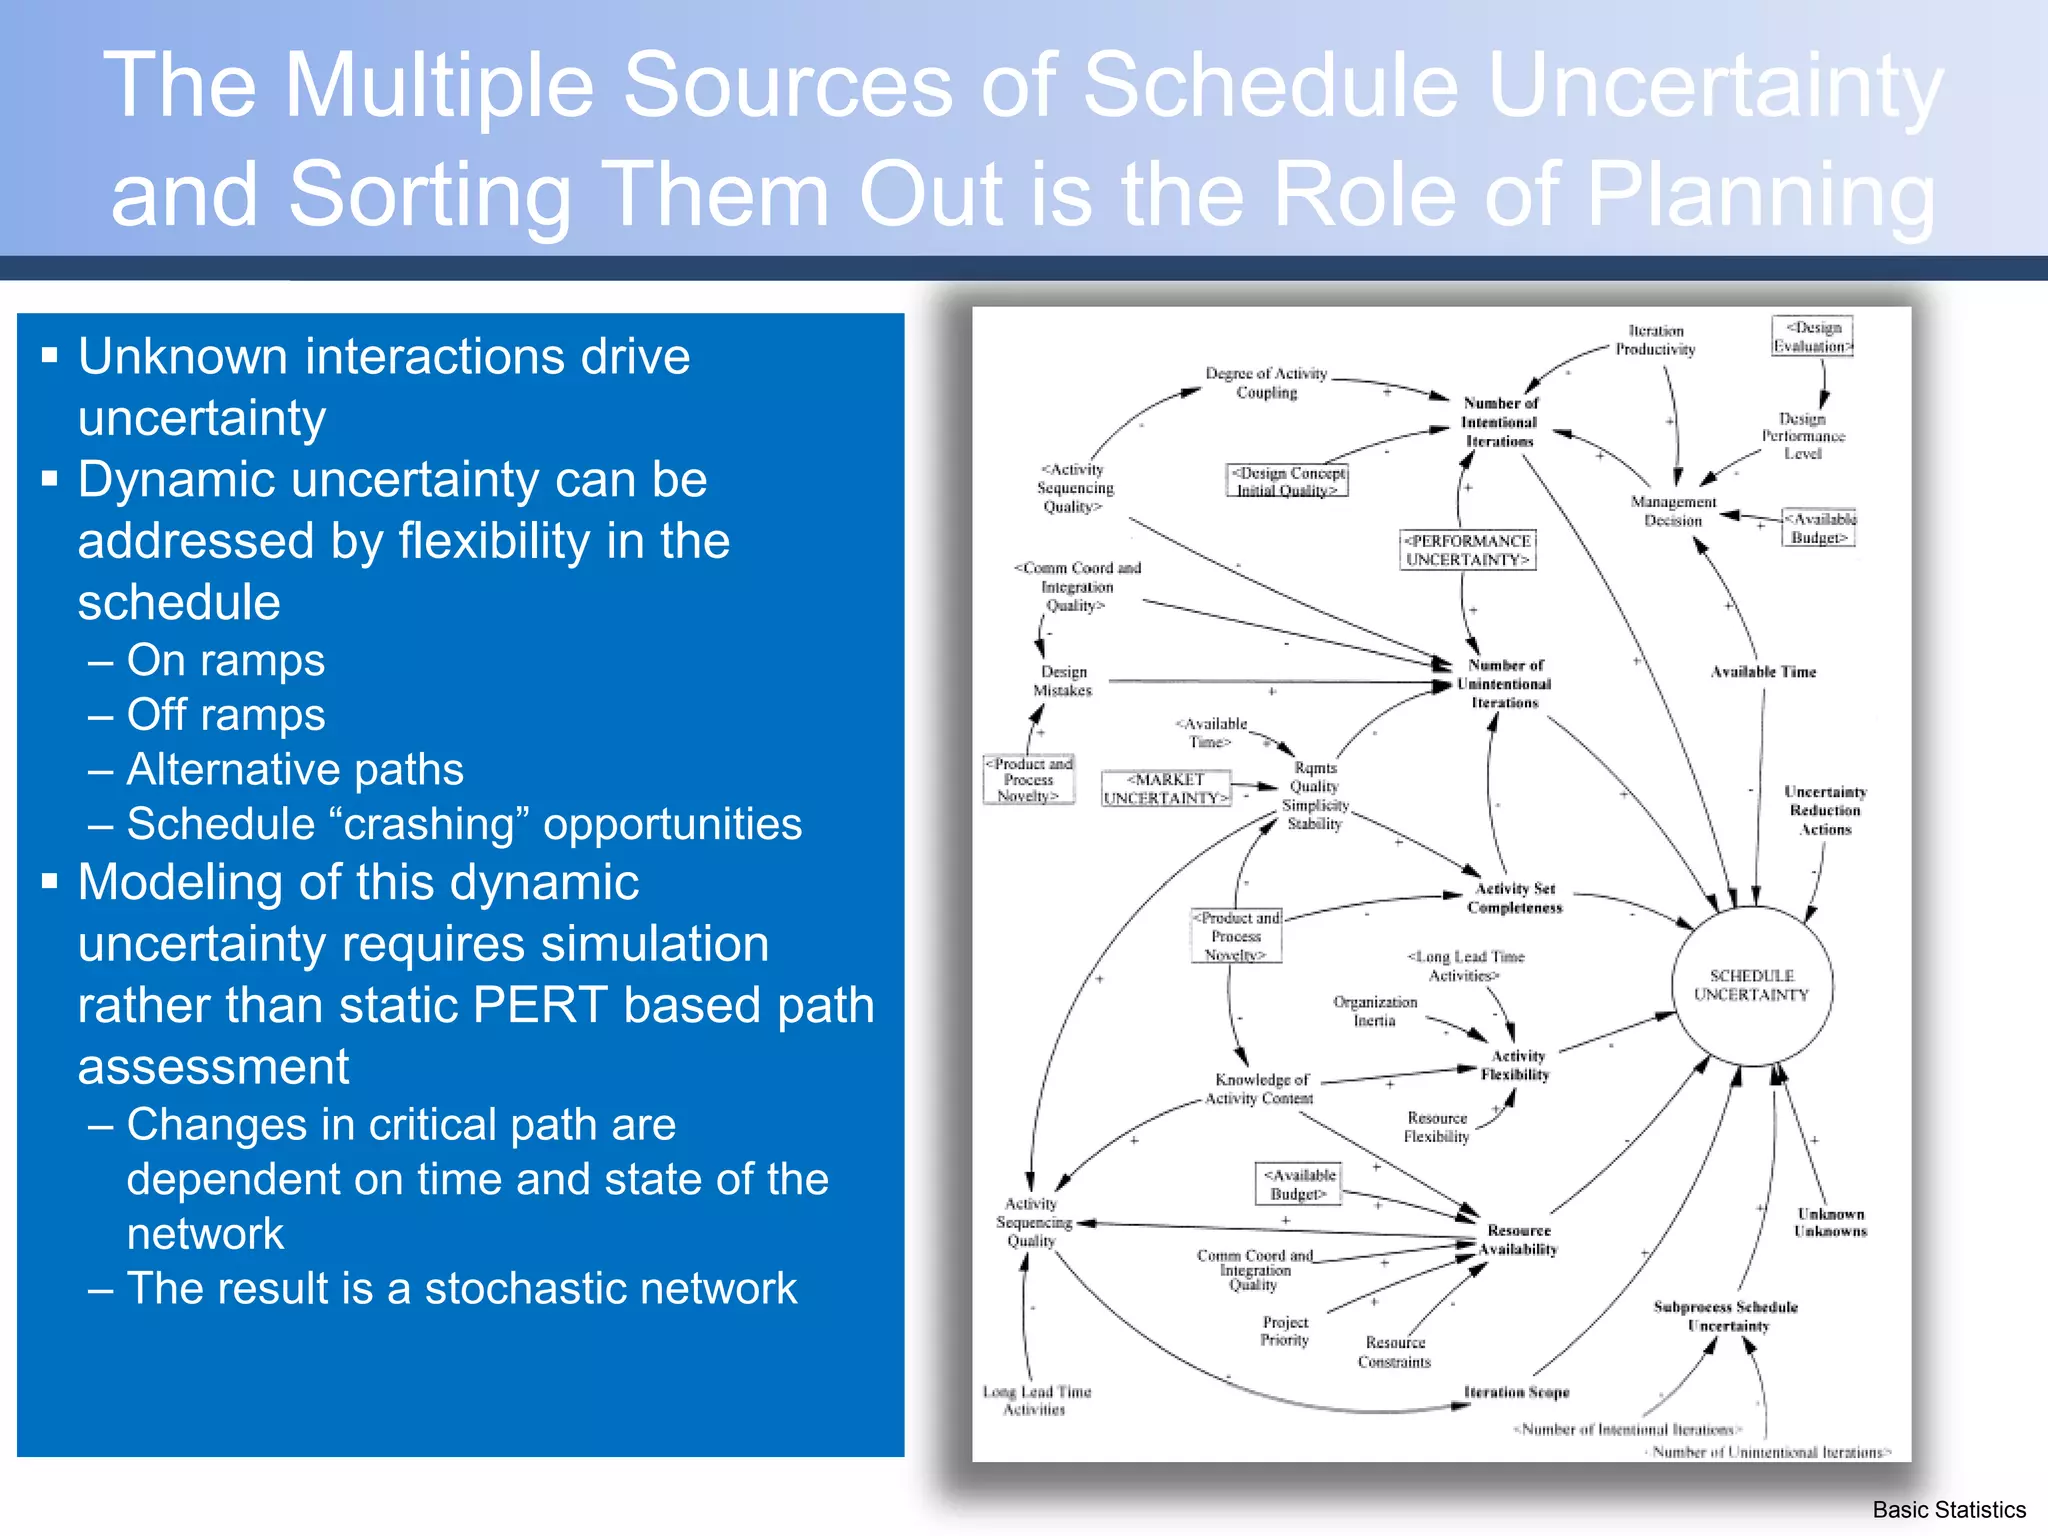
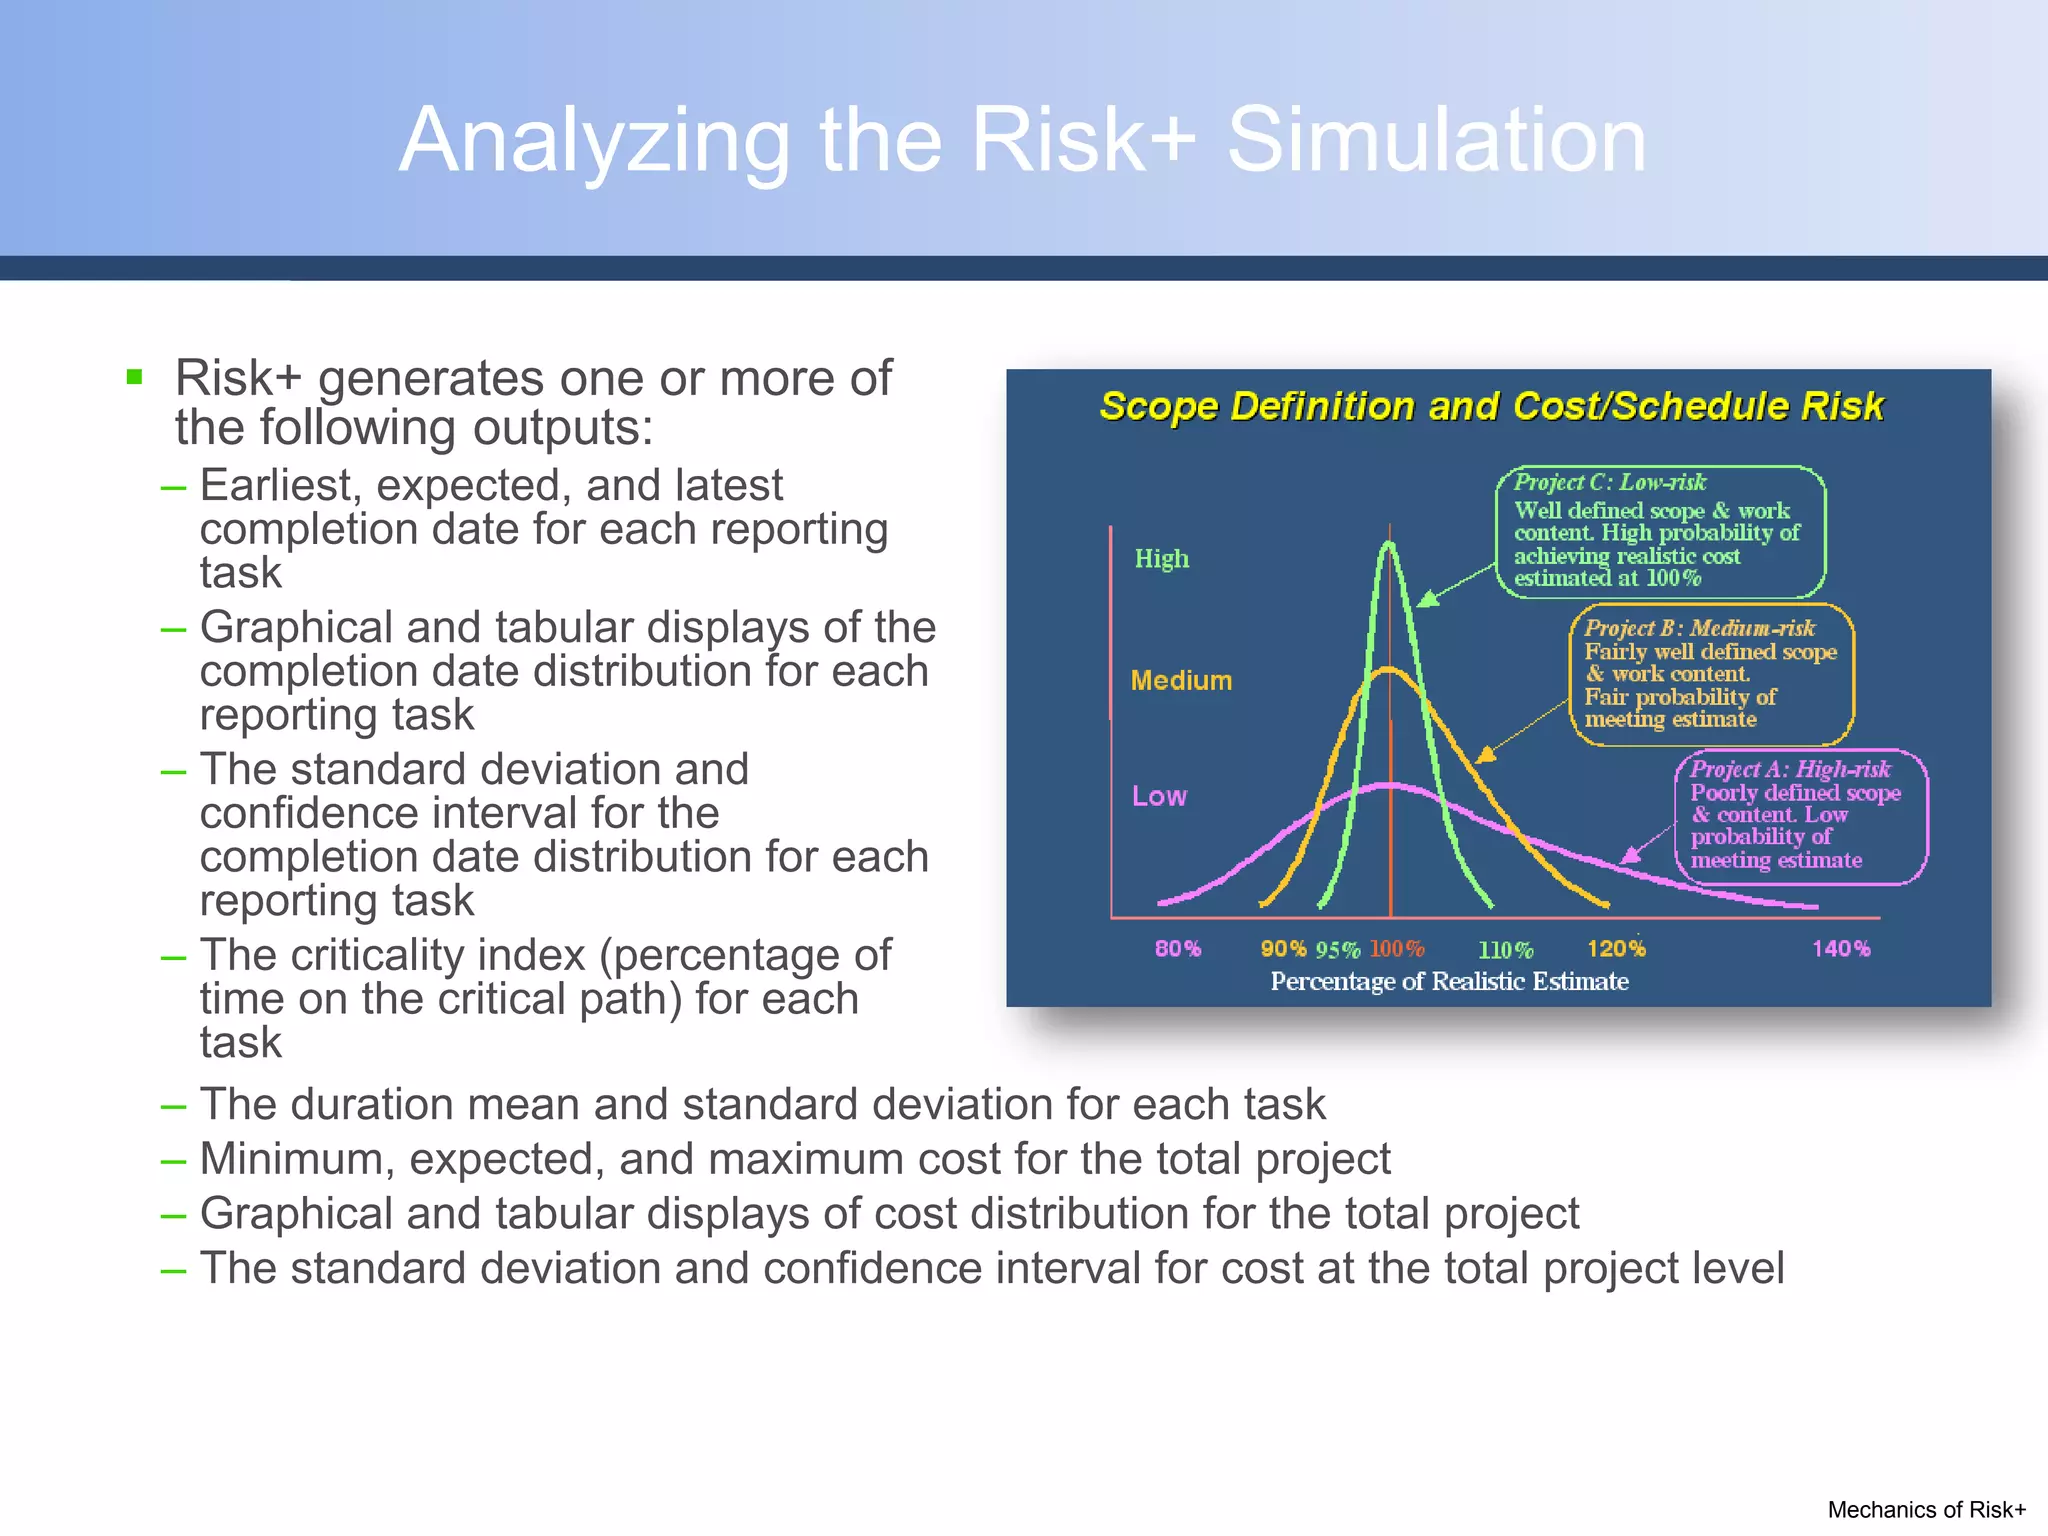
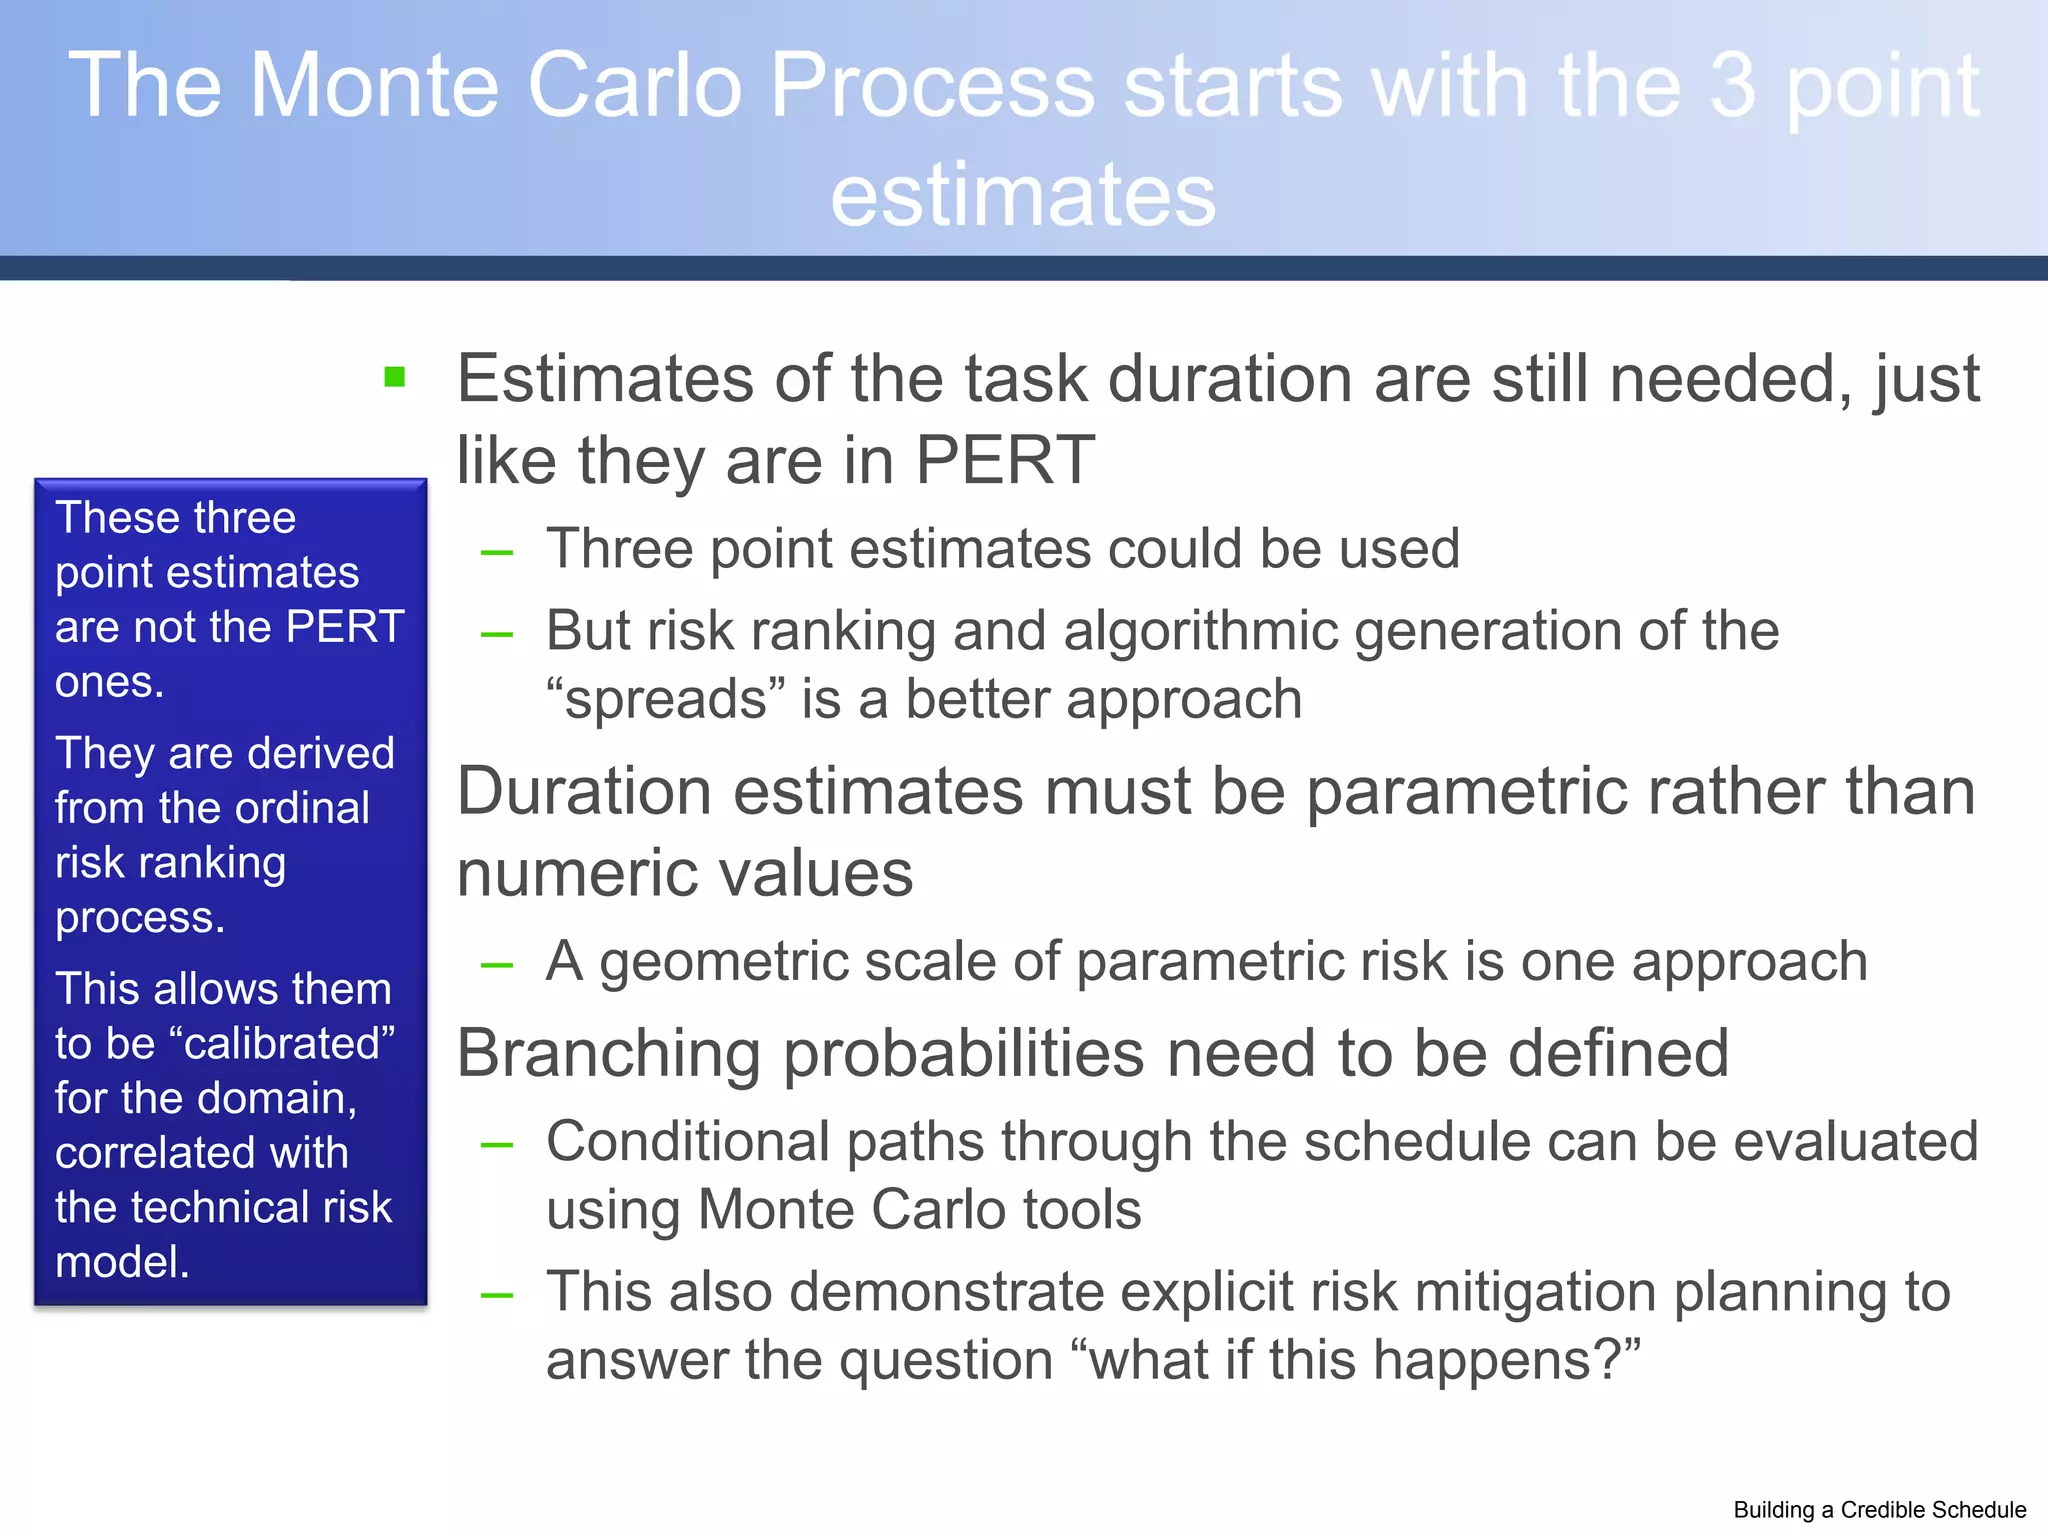
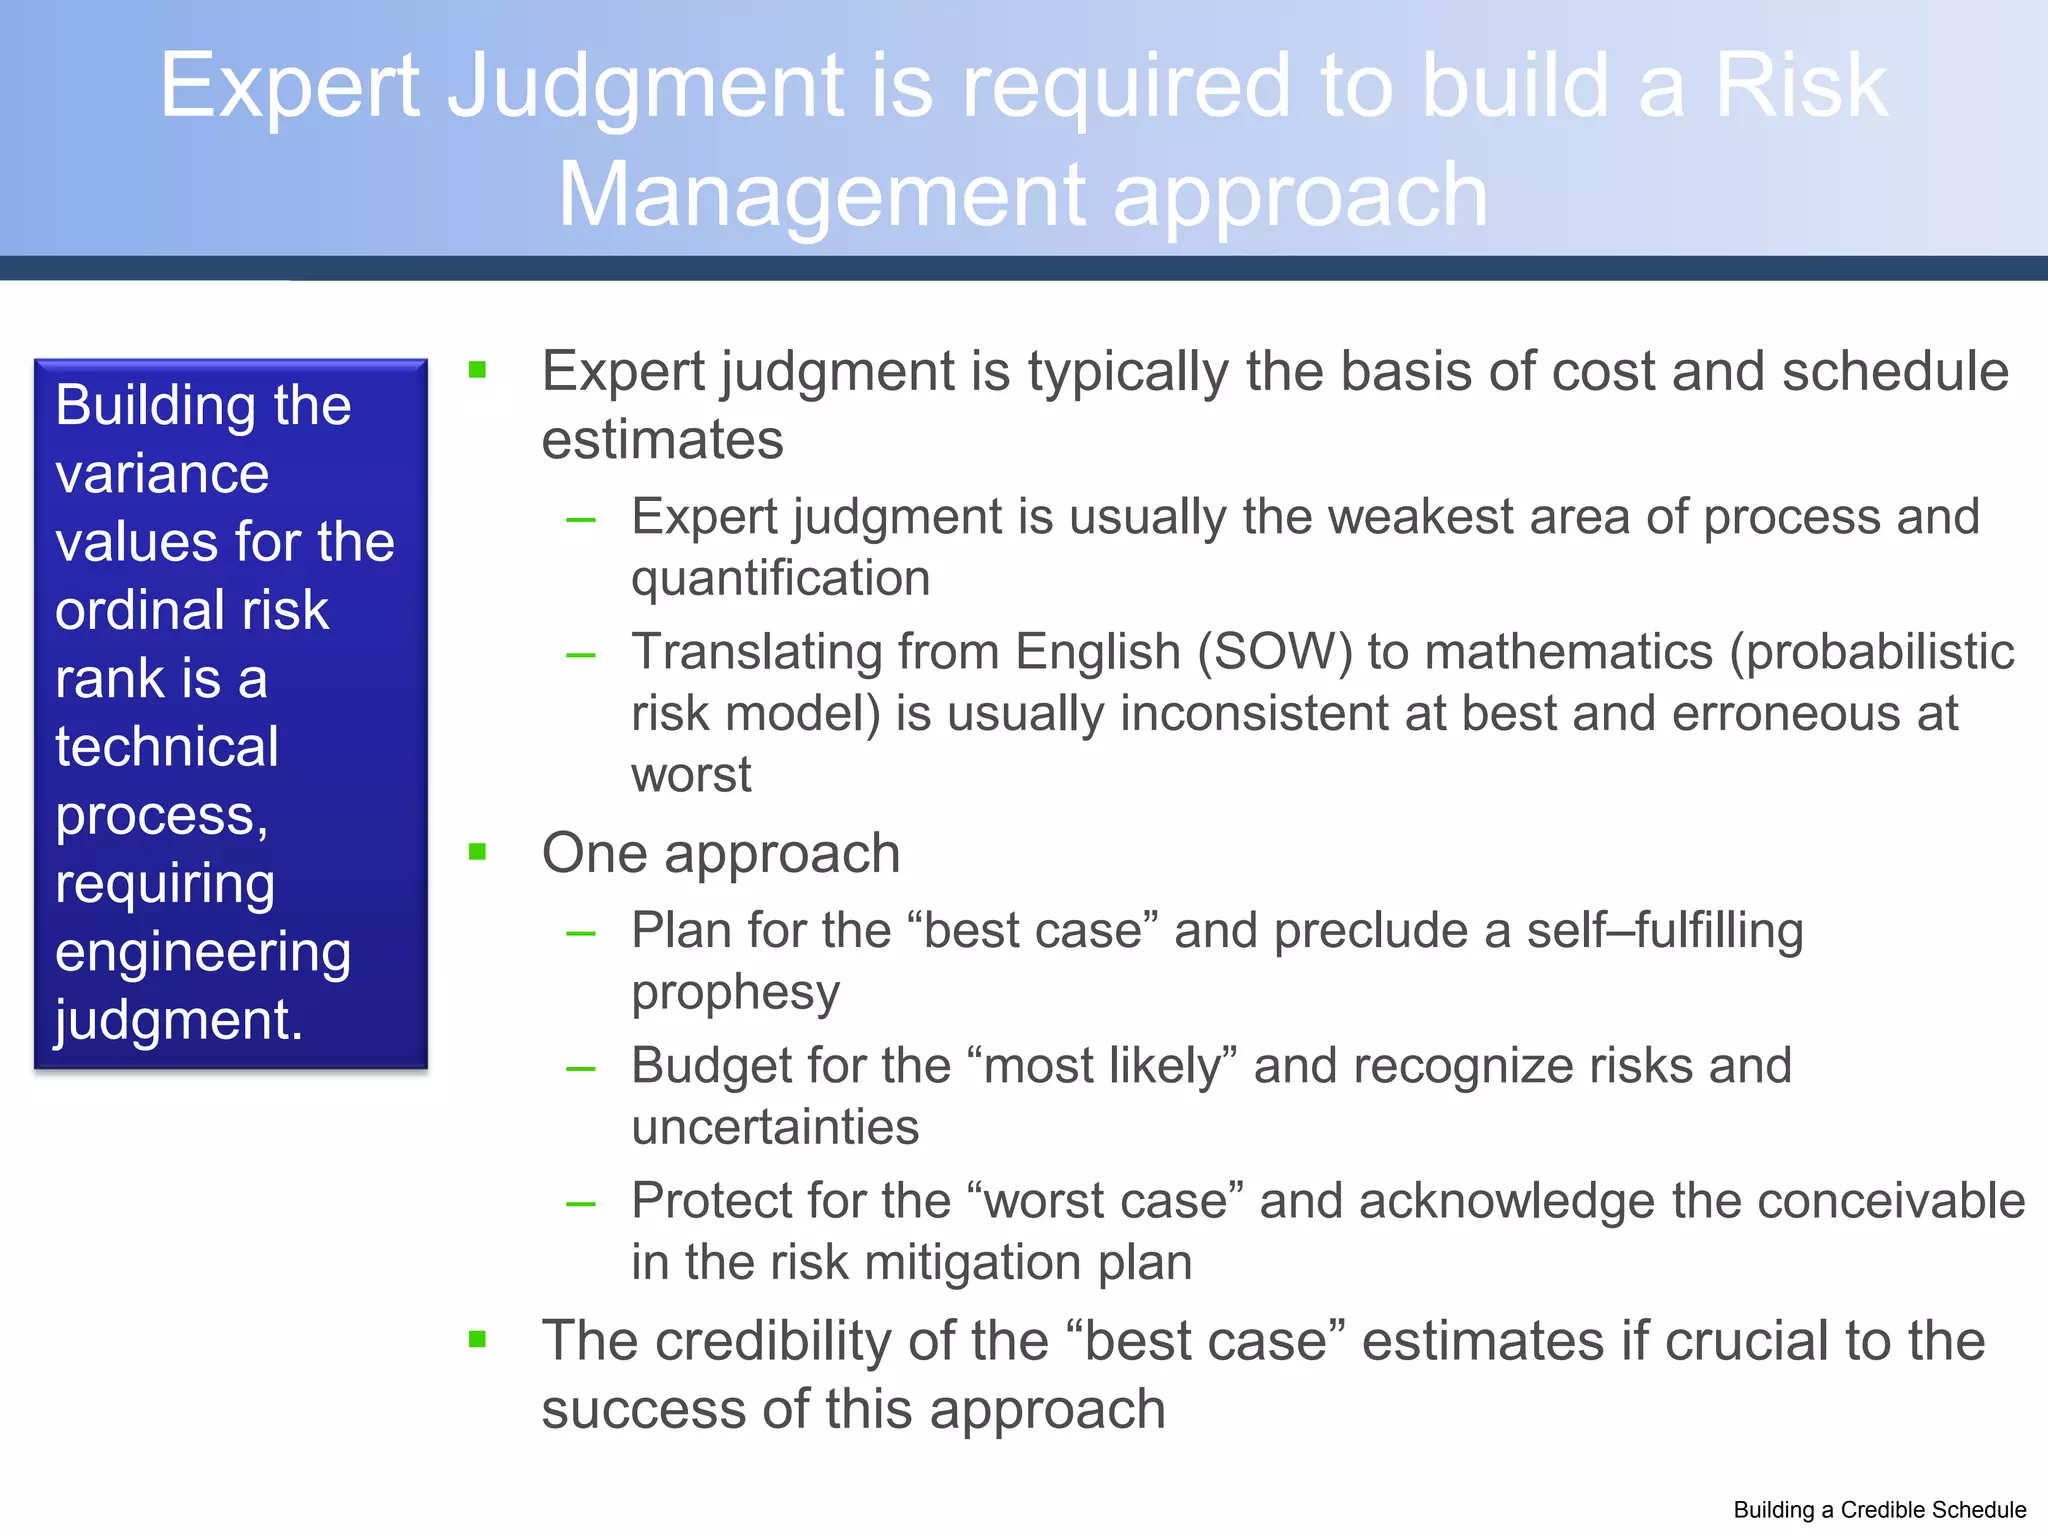
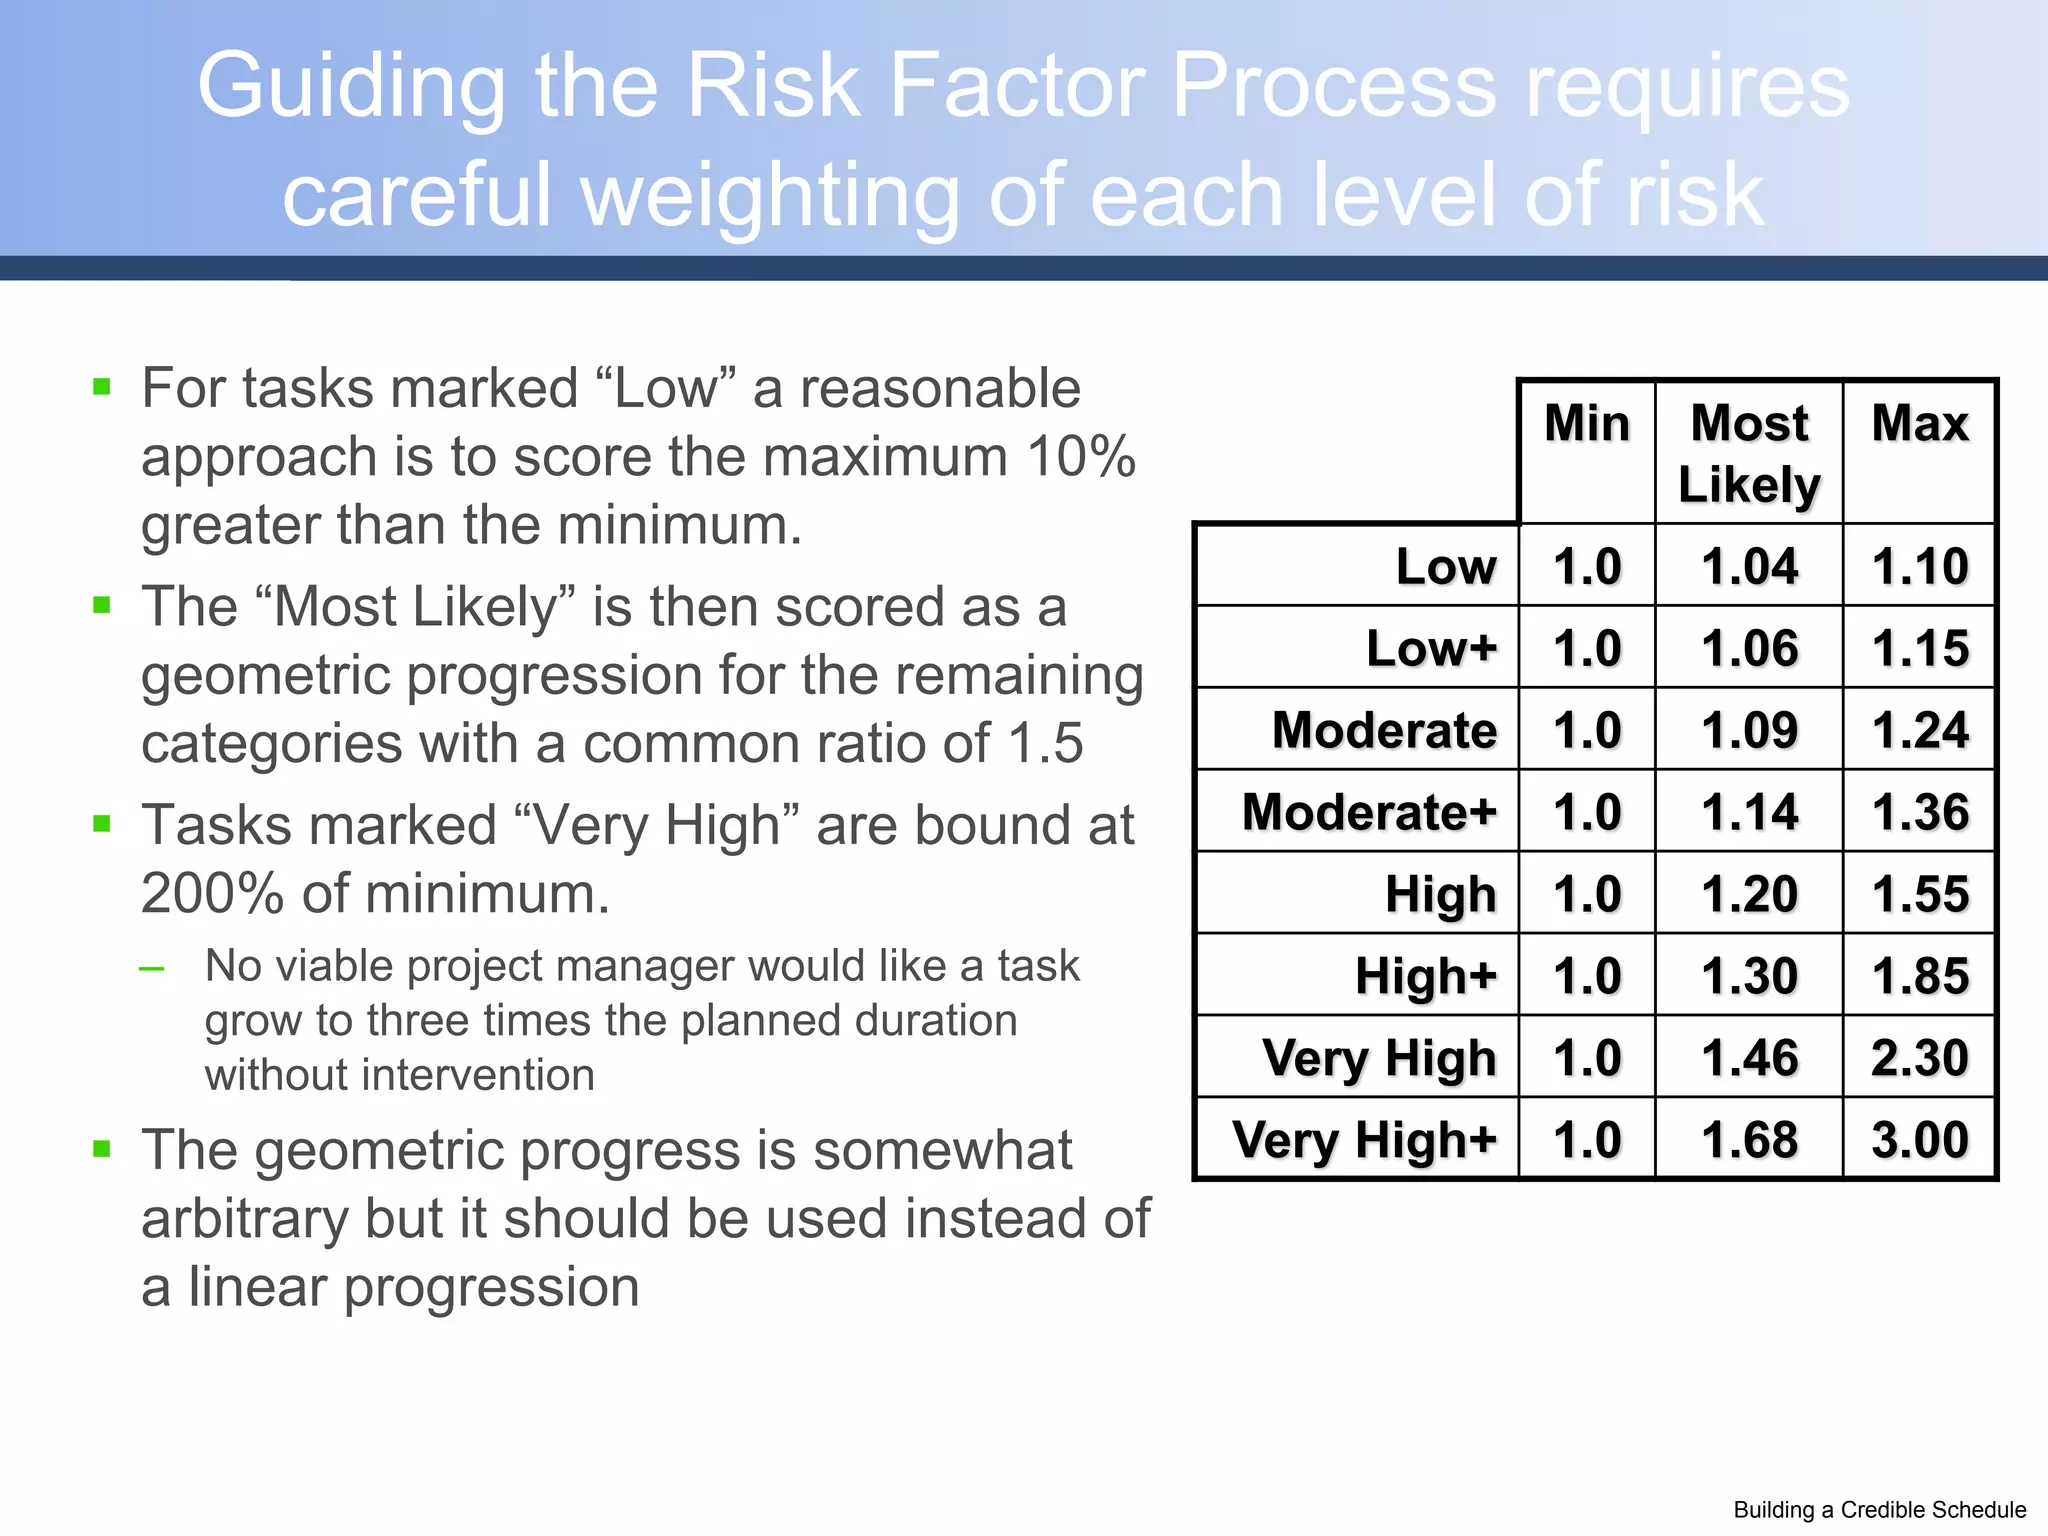
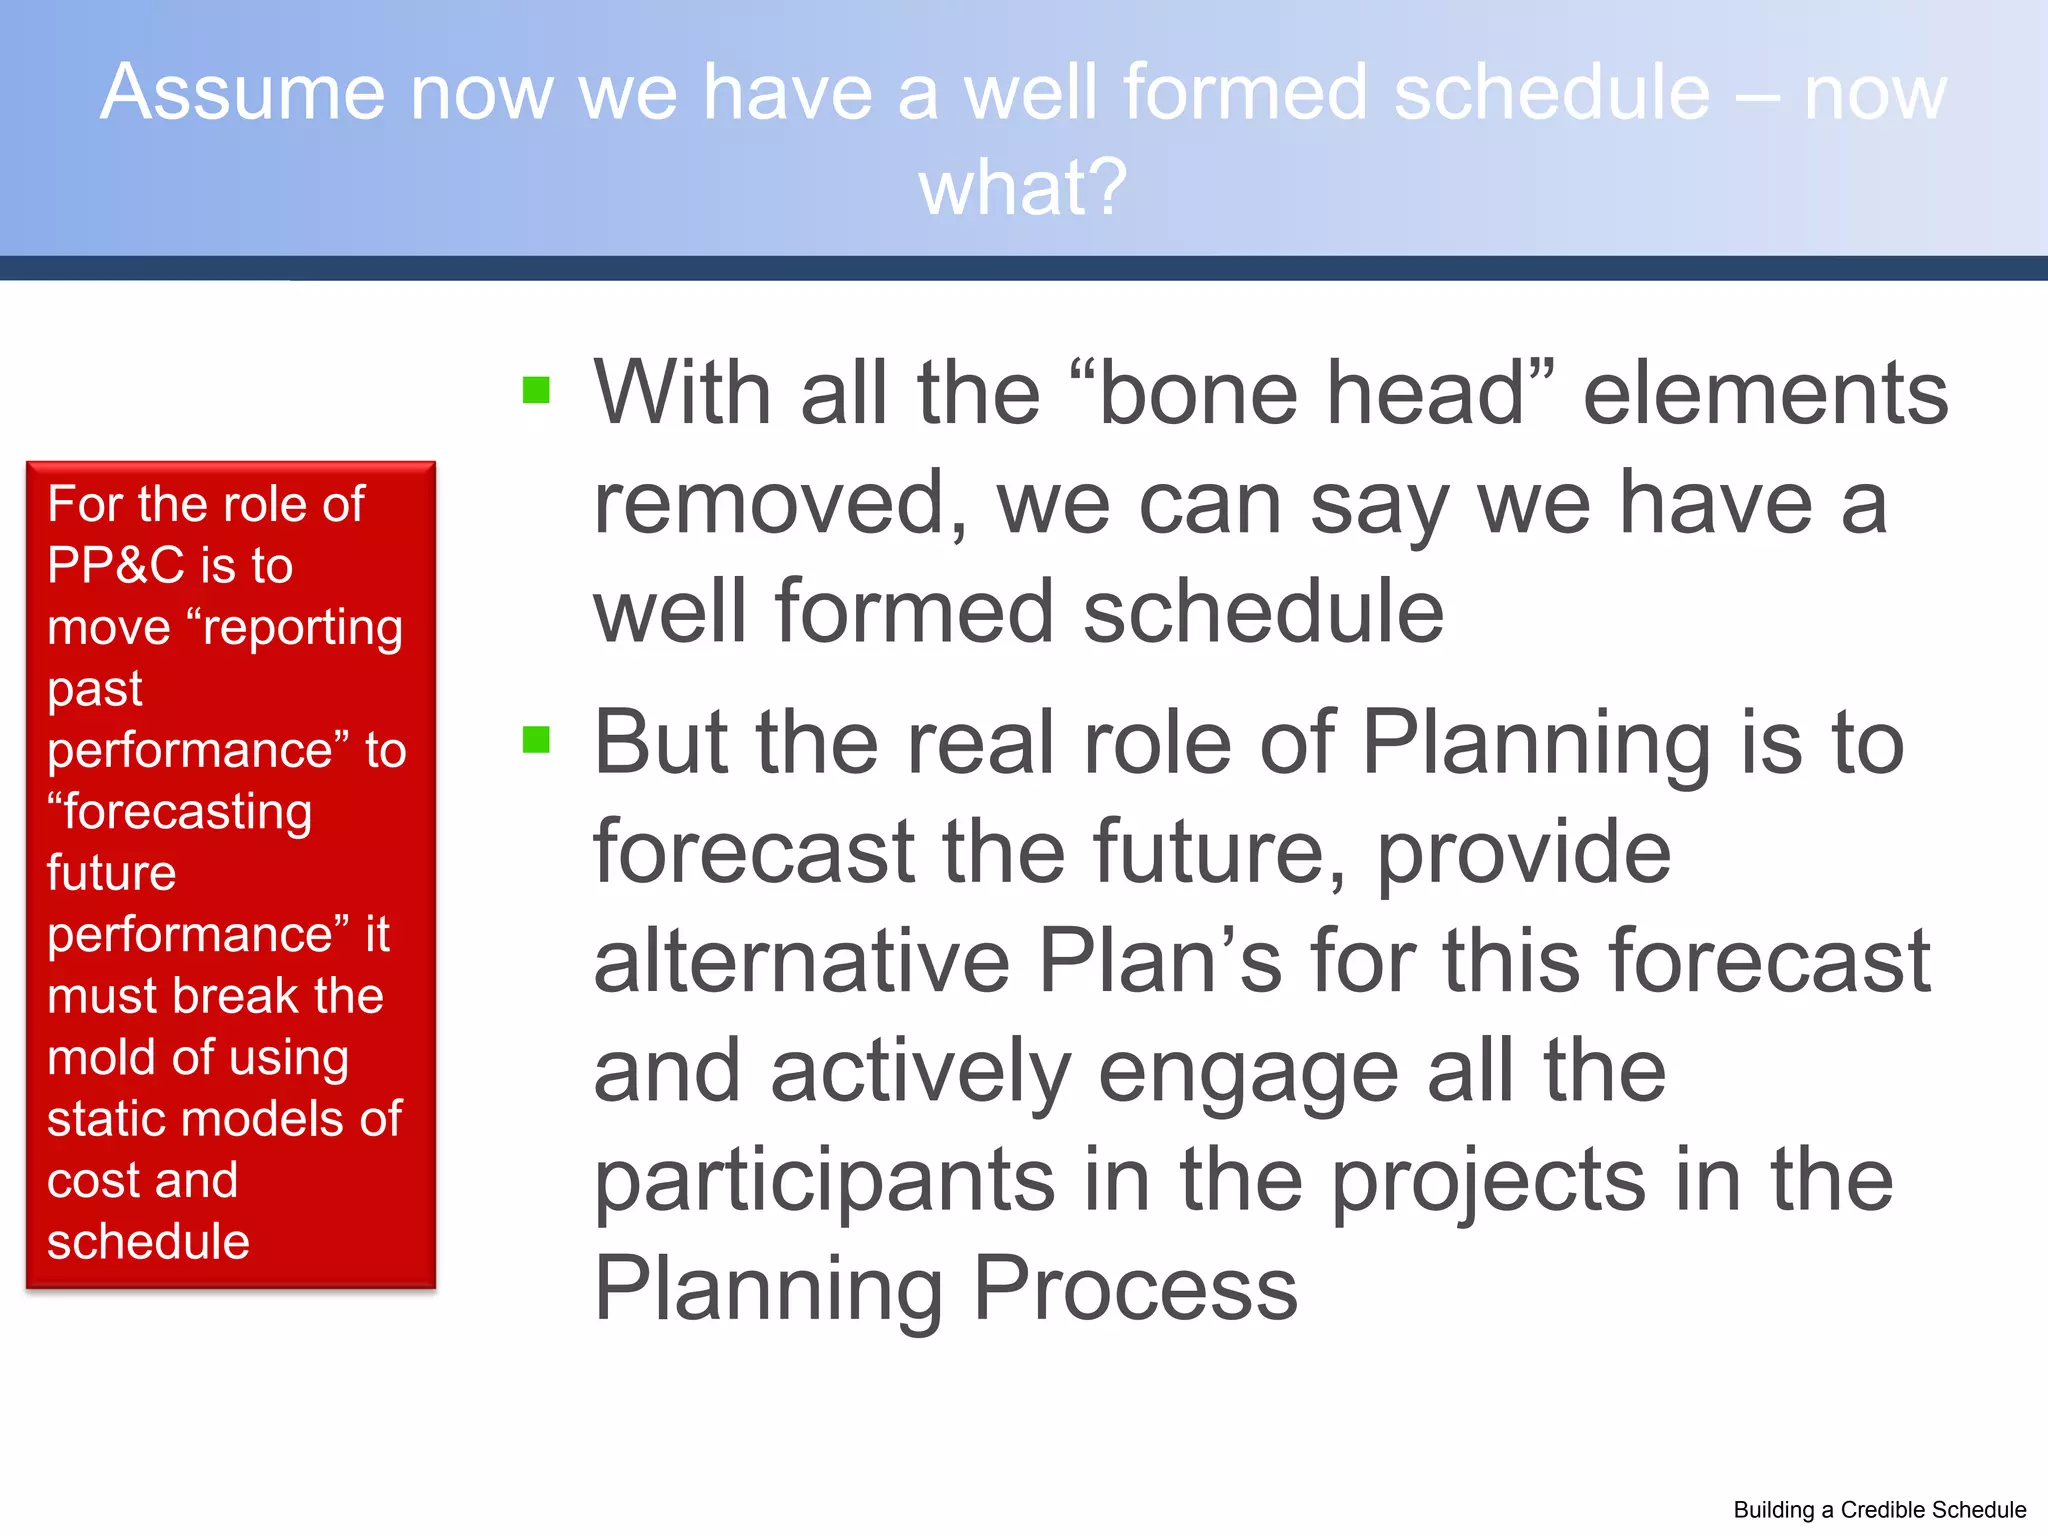
This document provides an overview of programmatic risk management. It discusses:
1. The importance of managing risk to cost, schedule, and technical performance for project success.
2. How single point estimates are not sufficient and statistical estimates are needed to build a credible cost and schedule model given the uncertainty inherent in projects.
3. The key aspects of risk management including identifying risk, analyzing risk probability and impact, and communicating risk as an ongoing process for decision making.
Increasing the Probability of Project SuccessGlen Alleman
This document discusses principles and practices for increasing the probability of project success by managing risk from uncertainty. It defines risk as the effect of uncertainty on objectives. There are two types of uncertainty - epistemic (reducible) and aleatory (irreducible). Risk from epistemic uncertainty can be reduced through work on the program, while risk from aleatory uncertainty requires establishing margins. The document argues that effective risk management is needed to deliver capabilities on time and budget by identifying risks, understanding their interactions and impacts, and implementing risk handling strategies. This increases the likelihood of project success by preventing problems, improving quality, enabling better resource use, and promoting teamwork.
The role of Risk Assessment and Risk Management is to continuously Identify, Analyze, Plan, Track, Control, and Communicate the risks associated with a project.
The Webster’s definition of risk is the possibility of suffering a loss. Risk in itself is not bad. Risk is essential to progress and failure is often a key part of learning. Managing risk is a key part of success.
This document describes the foundations for conducting a risk assessment of a large-scale system development project. Such a project will likely include the procurement of Commercial Off The Shelf (COTS) products as well as their integration with legacy systems.
Increasing the Probability of Success with Continuous Risk ManagementGlen Alleman
Cost and schedule growth is created when unrealistic technical performance expectations, unrealistic cost and schedule estimates, unanticipated technical issues, and poorly performed and ineffective risk management contribute to program technical and programmatic shortfalls
This document provides an introduction to programmatic risk management. It discusses key concepts like defining a strategy beyond hope, integrating cost, schedule and technical performance, using statistical models for risk, and communicating risk. It emphasizes that single point estimates are insufficient and that risk management requires understanding uncertainty and using techniques like Monte Carlo simulation to develop probabilistic schedules and assess completion confidence intervals. Managing programmatic risk is essential for project success.
Managing in the presence of uncertaintyGlen Alleman
Uncertainty is the source of risk. Uncertainty comes in two types, aleatory and epistemic. It is important to understand both and deal with both in distinct ways, in order to produce a credible risk handling strategy.
The document discusses using probabilistic risk analysis and Monte Carlo simulation to increase the probability of project success. It explains that modeling tasks as probability distributions rather than single point estimates allows for a more accurate assessment of overall schedule and budget risk. Capturing the uncertainty and dependencies between different tasks and cost/schedule drivers is important for generating reliable forecasts. The goal is to quantify confidence levels and establish appropriate margins to account for risks and uncertainties.
This document discusses the importance of continuous risk management for project success. It outlines five key concepts for effective risk management: 1) hoping is not a strategy, 2) single point estimates are inaccurate, 3) integrating cost, schedule, and technical performance is essential, 4) a formal risk management model is needed, and 5) risk communication is critical. The document emphasizes that risk management requires identifying risks early, quantifying their potential impacts, and developing mitigation plans. An effective risk management process is proactive rather than reactive and considers uncertainties as well as known risks.
Managing risk with deliverables planningGlen Alleman
This document discusses managing risk through continuous risk management (CRM). It introduces the five principles of risk management and outlines the CRM process, which includes identifying risks, analyzing and prioritizing them, planning mitigations, tracking mitigation progress and risks, making decisions based on risk data, and communicating throughout the project. The presentation provides examples of risk statements, evaluation criteria, classification approaches, and integrating risks and mitigation plans into project schedules. The goal of CRM is to continually identify, assess, and mitigate risks to improve project outcomes.
The document discusses applying risk management techniques to high-risk technology projects, defining key risk management terms like risk, uncertainty, likelihood, and consequences. It presents different frameworks for analyzing and assessing risks, including using condition-consequence or if-then statements to describe risks, and analyzing the likelihood and impact of risks in a summary grid. The goal is to help project managers make sense of the many types of risks that can affect projects and prioritize them for mitigation.
The basis of decision making for software development started in the 1980's with the application of classical discounted cash flow analysis.
This paper speaks to the extension of those principles to the development of Agile software
Probabilistic Cost, Schedule, and Risk managementGlen Alleman
All variables on projects are random variables. Cost, Schedule, and Technical performance interact with each other is statistical ways to produce probabilistic outcomes for their values.
Managing a project to a successful outcomes requires not only understanding the underlying statistics, but forecasting outcomes from these interactions in enough time to take corrective actions.
When contractually required, DOD acquisition contractors are obligated to submit IPMR's electronically IAW DID 81861. This data is necessary but not sufficient for successfully managing a program. This presentation is the overview of the Essential Views needed for that success
The question – what does Done Look Like? – was asked every week on the program that changed my life as a Program Manager. Rocky Flats Environmental Technology Site (RFETS) was the marketing term for the 3rd worst toxic waste site on the planet. RFETS was a nuclear bomb manufacturing plant, built in 1951, operating until 1989, and closed in 2005. I served as the VP of Program Management of the ITC (Information Technology and Communications) group, providing ERP, purpose built IT, voice, and data systems for 5,000 employees and contractors of the Bomb Factory.
The role of Risk Assessment and Risk Management is to continuously Identify, Analyze, Plan, Track, Control, and Communicate the risks associated with a project.
The Webster’s definition of risk is the possibility of suffering a loss. Risk in itself is not bad. Risk is essential to progress and failure is often a key part of learning. Managing risk is a key part of
success.
This document describes the foundations for conducting a risk assessment of a large-scale system
development project. Such a project will likely include the procurement of Commercial Off The
Shelf (COTS) products as well as their integration with legacy systems.
Niwot Ridge
Risk Management is a critical success factor for all project work.
Risk identification, quantitative and qualitative analysis, and risk response planning and execution is provided in this presentation
Iwsm2014 defining technical risk in software development (vard antinyan)Nesma
This document defines and discusses technical risks in software development. It proposes that technical risks should be defined as the degree of uncertainty regarding the magnitude of difference between the actual solution implemented and the optimal solution. The document outlines research on identifying common technical risks faced by companies and defining risks in a way that supports effective risk assessment and quantification of impacts. Workshops with several companies identified 24 common technical risks. The document also discusses how software metrics can be used to assess technical risks by measuring unwanted consequences and properties of design artifacts.
Technical and programmatic disruptions in project plans don’t need to negatively impact cost, performance or schedule metrics. But traditional approaches to planning are not an adequate defense. This white paper outlines the six steps for building a risk-tolerant schedule using a field proven approach.
This document provides sample questions and answers that a Control Account Manager (CAM) could expect to encounter during an interview related to their Earned Value Management responsibilities. It includes background on topics like required training, the program organization structure, work authorization processes, performance measurement baseline planning, and earned value measurement. Sample questions are provided on each topic along with potential answers the CAM could provide to demonstrate their knowledge and management of their control accounts.
The document discusses risk management on high technology programs. It outlines the agenda for a 4 hour session which will cover the principles of risk management, introduce Continuous Risk Management (CRM), illustrate each CRM process area with examples, and familiarize participants with identifying risks. The document then discusses the five principles of risk management and explains concepts like the Mission-Oriented Success Analysis and Improvement Criteria (MOSAIC) framework for assessing project risk.
The document identifies 4 root causes of cost and schedule shortfalls in the ACAT1 program: 1) unrealistic estimates based on inadequate risk models, 2) inadequate assessment and mitigation of risks, 3) unanticipated technical issues without alternative solutions, and 4) unrealistic performance expectations without proper measures. It also notes that the IPMR process can help reveal early, unanticipated growth in cost and schedule through assessment of technical performance measures and percent completion.
Managing Risk in Agile Development: It Isn’t MagicTechWell
Has the adoption of agile techniques magically erased risk from software projects? When we change the project and product environment by adopting agile, have we tricked ourselves into thinking that risk has been abolished—when it hasn’t? Agile risk management is a continuous process that makes risk management part of how the team works so they get value from the activity. Thomas Cagley suggests that we develop user stories that specifically address risk so it is prioritized, planned, and executed as part of the normal agile cadence. Agile techniques—daily standups, demonstrations, retrospectives, and sprint-planning activities—provide a platform for monitoring and controlling risks. The built-in feedback loops act as a safety net to ensure eyes are continuously looking at what is happening and what could be happening. By constantly evaluating risk, agile processes avoid spending significant time analyzing risks that are not on the horizon, while making it very difficult for an unseen risk to sneak up on your project.
Increasing the Probability of Success with Continuous Risk ManagementGlen Alleman
This document summarizes an article from The Measurable News publication that discusses increasing the probability of program success through continuous risk management. It describes how identifying, analyzing, planning, tracking and controlling risk on complex systems can help assess the maturity of an existing risk management process and determine actions needed to improve it. The article provides examples of root cause analysis, assumptions, and sources of risk, and argues that separating risks into aleatory and epistemic categories helps better measure the impacts of each type of risk. Continuous risk management is presented as a way to produce risk-informed decisions that can address issues leading to cost overruns, schedule delays, and shortfalls in technical performance.
Agile project management and normativeGlen Alleman
Reform of the traditional approaches to managing software development projects is driven by several factors, not the least of which is some spectacular failures of soft-ware projects. Ranging from the IRS, to the FAA, to large e–commerce systems, we all have some “war story” of a major failure that can be traced to non–technical causes.
This document discusses key concepts for effective risk management on projects. It outlines 5 concepts: 1) hoping is not a strategy, plans with goals and metrics are needed, 2) single point estimates are inaccurate, probabilistic estimates using distributions like triangles are better, 3) integrating cost, schedule, and technical performance is essential, 4) a formal risk management process and model is required, and 5) risk communication is critical. It emphasizes that identifying risks is not enough, plans for mitigating risks must be developed and risks must be retired over time according to the plan.
Risk management is essential for the success of any significant project. Information about key project cost, performance, and schedule attributes is often unknown until the project is underway. Risks that can be identified early in the project that impacts the project later are often termed “known unknowns.” These risks can be mitigated, reduced, or retired with a comprehensive risk management process. For risks that are beyond the vision of the project team a properly implemented risk management process can be used to rapidly quantify the risks impact and provide sound plans for mitigating its affect.
Risk management of the performance measurement baselineGlen Alleman
Many large government and industry programs are plagued by cost and schedule overruns and technical shortfalls.
Knowledge of project risk provides information needed to make decisions in the presence of uncertainty, where predicting future outcomes is part of the project management process.
When we talk about risk we need to have definitions that are shared across the domain. Risk in federal acquisition programs may not be the same definition as risk in the financial investment
domain.
Project examples for sampling and the law of large numbersJohn Goodpasture
The document discusses sampling techniques and how they can be used to estimate parameters about a population. Specifically, it provides examples of how sampling can be applied to estimate proportions and continuous data for project management purposes. The key aspects are estimating proportions and descriptive statistics like averages from a sample to help with tasks like scheduling while managing the risk that the sample may not perfectly represent the entire population. Guidelines are provided for determining appropriate sample sizes to achieve desired confidence levels and margins of error.
Liberty university busi 313 quiz 3 complete solutions correct answers slideshareSong Love
This document provides the questions and answers to Liberty University's BUSI 313 Quiz 3. It covers key concepts in project risk management and project scheduling including: defining risks, the risk management process, risk assessment tools, risk responses, resource constraints, time constraints, resource leveling, and time-phasing project budgets. Some multiple choice questions assess understanding of these concepts, such as defining different types of constraints, steps in the risk process, and responses to address identified risks.
1) This document outlines an agenda for a workshop on programmatic risk management that covers topics such as risk management principles, basic statistics, Monte Carlo simulation theory, using Microsoft Project and Risk+ software, risk ranking, and building a credible schedule.
2) It discusses five key principles of managing programmatic risk: having a strategy rather than relying on hope, understanding that single point estimates are inaccurate without variance data, integrating cost, time and technical performance, using a risk management process and model rather than "driving in the dark," and ensuring effective risk communication.
3) The mechanics section describes how to set up a Risk+ simulation integrated with
This presentation talks about how risks in a project are analyzed and quantified. The presentation also discusses benefits of quantification of risks and the various tools at our disposal to manage risks effectively through quantification.
Risk management is essential for any significant project. Certain information about key project cost, performance, and schedule attributes are often unknown until the project is underway.
Establishing schedule margin using monte carlo simulation Glen Alleman
The first order goal is to develop a resource loaded, risk tolerant, Integrated Master Schedule, derived from the Integrated Master Plan that clearly shows the increasing maturity of the program's deliverables, through vertical and horizontal traceability to the program's requirements.
Adopting the Quadratic Mean Process to Quantify the Qualitative Risk AnalysisRicardo Viana Vargas
The objective of this paper is to propose a mathematical process to turn the results of a qualitative risk analysis into numeric indicators to support better decisions regarding risk response strategies.
Using a five-level scale for probability and a set of scales to measure different aspects of the impact and time horizon, a simple mathematical process is developed using the quadratic mean (also known as root mean square) to calculate the numerical exposition of the risk and consequently, the numerical exposition of the project risks.
This paper also supports the reduction of intuitive thinking when evaluating risks, often subject to illusions, which can cause perception errors. These predictable mental errors, such as overconfidence, confirmation traps, optimism bias, zero-risk bias, sunk-cost effect, and others often lead to the underestimation of costs and effort, poor resource planning, and other low-quality decisions (VIRINE, 2010).
How Traditional Risk Reporting Has Let Us DownAcumen
This white paper discusses risk reporting techniques and ways of interpreting risk analysis results that actually enable the project team to make pro-active changes in reducing their risk exposure.
Risk management is essential for project success and involves dealing with uncertainty through identifying and mitigating risks. A good risk management process is proactive and connects risk, cost, schedule, and technical performance. It should follow a defined methodology like the Department of Defense process and communicate risks and mitigation plans. Effective risk management integrates risks into project schedules and estimates to allow monitoring and response if risks become issues.
Building Risk Tolerance into the Program Plan and ScheduleGlen Alleman
This document provides guidance on building a risk-tolerant project schedule. It discusses identifying risks and uncertainties, defining risk mitigation tasks, and incorporating them explicitly into the schedule. Key steps include: 1) Defining measurable maturity milestones; 2) Defining accomplishments and exit criteria; 3) Defining work to meet exit criteria; 4) Ranking tasks by risk level; 5) Defining risk mitigation tasks; and 6) Planning alternative paths for unknown risks. This makes risks and mitigations visible, allowing continuous risk monitoring and adjustment of the risk handling strategy.
This document discusses managing uncertainty and risk in project schedules. It explains that there are four types of uncertainty that exist in every project: 1) normal variations in task completion, 2) foreseen uncertainties, 3) unforeseen uncertainties, and 4) chaos when the project structure becomes unstable. Each type of uncertainty requires a different handling strategy. The document also discusses identifying risk mitigation tasks in the project plan to address specific, known uncertainties and using techniques like Monte Carlo simulation to determine margin needed to address general, dynamic uncertainties.
Forecasting cost and schedule performanceGlen Alleman
This document discusses the importance of statistical forecasting for project performance in the presence of uncertainty. Some key points:
- Current Earned Value Management techniques treat metrics like SPI/CPI as single point estimates without accounting for underlying variances, missing important statistical information.
- Forecasts of future performance using current EV techniques are linear, non-risk adjusted projections that ignore the statistical nature of past performance data.
- Statistical time series analysis of past performance data from the Central Repository can provide probabilistic forecasts with confidence intervals, increasing the probability of project success.
- All project activities have natural uncertainties that impact the probability of cost, schedule and technical performance. Understanding these statistical behaviors is crucial for credible forecast
This document provides an overview of risk-adjusted estimating techniques for quantifying and accounting for uncertainty in project cost estimates. It discusses point estimating, uncertainty in estimates, and different types of risks including aleatory, systemic, and project-specific risks. It also covers quantifying uncertainty through qualitative analysis, quantitative analysis using historical data, and Monte Carlo simulation. The document emphasizes that simply adding individual estimates does not accurately capture total project uncertainty and risk, and that simulation methods are better for estimating overall program costs.
The document discusses quantitative risk analysis methods for space system projects using an event chain methodology. It describes defining events and event chains that can impact a project, analyzing their probabilities and relationships, and using Monte Carlo simulation to assess their cumulative effects over time. A project example illustrates defining activities, assigning risks and mitigation efforts as events, tracking performance against the original estimate, and regularly reassessing events based on new data. The methodology aims to help project managers better understand project uncertainties and risks.
This document discusses the differences between qualitative and quantitative risk analysis. Qualitative analysis involves identifying and prioritizing risks by likelihood and impact, while quantitative analysis assigns monetary values to risks to determine if projects can be completed on time and budget. The document recommends using a combination of both for the IRTC customer service system project to accurately assess risks. It provides an example of a Norwegian project that used quantitative data from a SCADA system to facilitate risk analysis updates.
This document discusses how analytics and statistical concepts can be applied to project management principles. It provides examples of how probability distributions like normal, Poisson, and exponential can be used in areas like risk management, cost management, and schedule management. The document also presents two case studies showing how statistical analysis could help optimize a biofuel project in the Philippines and calculate costs for an HIV treatment project in Kenya. Overall, the document argues that incorporating statistical analytics can help projects execute optimally and manage uncertainty.
The notion of integrating cost, schedule, technical performance, and risk is possible in theory. In practice care is needed to assure credible information is provided to the Program Manager.
This document discusses approaches to risk identification for projects. It compares checklist and non-checklist approaches. Checklists can help identify risks quickly but may miss some risks not included in the checklist. Non-checklist approaches are more thorough but also more time-consuming. The document recommends that project managers use a combination of approaches, including repeating risk identification regularly as projects evolve to address changing risks. It also provides examples of taxonomy-based checklists that classify risks to help with identification.
Overview of schedule and cost risk analysis methodology for aerospace industry.
For more information how to perform schedule risk analysis using RiskyProject software please visit Intaver Institute web site: http://www.intaver.com.
About Intaver Institute.
Intaver Institute Inc. develops project risk management and project risk analysis software. Intaver's flagship product is RiskyProject: project risk management software. RiskyProject integrates with Microsoft Project, Oracle Primavera, other project management software or can run standalone. RiskyProject comes in three configurations: RiskyProject Lite, RiskyProject Professional, and RiskyProject Enterprise.
This document discusses project risk management. It defines risk as an uncertain event that can positively or negatively impact project objectives. Risk management is the systematic process of identifying, analyzing, and responding to project risks. The six processes of risk management are: 1) plan risk management, 2) identify risks, 3) perform qualitative risk analysis, 4) perform quantitative risk analysis, 5) plan risk responses, and 6) monitor and control risks. Tools used include risk breakdown structures, probability and impact matrices to assess risks, and decision trees to evaluate responses. The goal is to prioritize and respond to risks to help ensure project success.
The document discusses defining and implementing metrics for risk reduction on construction projects. It describes three types of project metrics: predictive, diagnostic, and retrospective. Predictive metrics are based on expectations and help identify risks early. Diagnostic metrics assess current project status and warn of potential problems. Retrospective metrics evaluate what worked after a project is complete. The document provides examples of metrics that could measure risks related to scope, schedule, resources, and overall risk. It emphasizes that effective metrics support objectives, influence behavior, and assist decision-making.
Similar to Programmatic risk management workshop (handbook) (20)
Planning projects usually starts with tasks and milestones. The planner gathers this information from the participants – customers, engineers, subject matter experts. This information is usually arranged in the form of activities and milestones. PMBOK defines “project time management” in this manner. The activities are then sequenced according to the projects needs and mandatory dependencies.
Process Flow and Narrative for Agile+PPMGlen Alleman
This document describes how an organization integrates agile software development practices with earned value management (EVM) to provide program status updates. It outlines a process that begins with developing a rough order of magnitude estimate of features needed. These features are then prioritized, mapped to a product roadmap and product backlog. Stories are developed from features and estimated, and tasks are estimated in hours. Physical percent complete data from tasks in Rally is used to calculate EVM metrics to inform stakeholders.
This document discusses principles of effective risk management for projects. It emphasizes the importance of clearly defining requirements and success criteria before releasing requests for proposals. This includes quantifying measures of effectiveness and performance for different use scenarios. Effective risk management also requires developing a funded implementation plan informed by historical risks and uncertainties. The document outlines key data and processes needed to reduce risks and increase the probability of a project's success, including defining requirements, developing plans and schedules, identifying risks and adjustments needed to plans. It discusses uncertainties from both known and unknown sources that can impact cost, schedule and performance.
Cost and schedule growth for complex projects is created when unrealistic technical performance expectations, unrealistic cost and schedule estimates, inadequate risk assessments, unanticipated technical issues, and poorly performed and ineffective risk management, contribute to project technical and programmatic shortfalls
From Principles to Strategies for Systems EngineeringGlen Alleman
From Principles to Strategies How to apply Principles, Practices, and Processes of Systems Engineering to solve complex technical, operational,
and organizational problems
Building a Credible Performance Measurement BaselineGlen Alleman
The document discusses establishing a credible Performance Measurement Baseline (PMB) for programs by integrating technical and programmatic plans. It recommends starting with a Work Breakdown Structure (WBS) that identifies system elements, associated risks, and processes to produce outcomes. An Integrated Master Plan (IMP) should then define how system elements mature at Program Events, with Measures of Effectiveness (MOEs) and Measures of Performance (MOPs) assigned. Finally, an Integrated Master Schedule (IMS) should arrange tasks to increase technical maturity, identify reducible and irreducible risks, and establish a risk-adjusted PMB to increase the probability of program success. Connecting these elements through the WBS, IMP and IMS
Integrated master plan methodology (v2)Glen Alleman
The document describes a methodology for developing an Integrated Master Plan (IMP). It outlines five conditions an IMP must meet, five steps in the development process, five common questions about IMP development, five common mistakes, and provides five templates/samples for key IMP sections. The methodology is intended to help program and project teams create effective IMPs that integrate execution plans and align with contractual requirements.
Capabilities‒Based Planning the capabilities needed to accomplish a mission or fulfill a business strategy
Only when capabilities are defined can we start with requirements elicitation
Starting with the development of a Rough Order of Magnitude (ROM) estimate of work and duration, creating the Product Roadmap and Release Plan, the Product and Sprint Backlogs, executing and statusing the Sprint, and informing the Earned Value Management Systems, using Physical Percent Complete of progress to plan.
Program Management Office Lean Software Development and Six SigmaGlen Alleman
Successfully combining a PMO, Agile, and Lean / 6 starts with understanding what benefit each paradigm brings to the table. Architecting a solution for the enterprise requires assembling a “Systems” with processes, people, and principles – all sharing the goal of business improvement.
This resource document describes the Program Governance Road map for product development, deployment, and sustainment of products and services in compliance with CMS guidance, ITIL IT management, CMMI best practices, and other guidance to assure high quality software is deployed for sustained operational success in mission critical domains.
The document discusses the development of an Integrated Master Plan (IMP) as the basis for an Integrated Master Schedule (IMS) for a program. It outlines a 6-step process for developing the IMP and IMS that includes understanding requirements, developing a product structure, forming integrated product teams, creating the IMP, creating the IMS, and developing the basis of estimate. It describes artifacts like the product tree, work breakdown structure, statement of work, and their relationships. It also outlines responsibilities of the program management team, integrated product team leads, and program planning and controls.
This document discusses the need for an underlying theory of software project management that can better handle uncertainties. It argues traditional, linear project management models are not well-suited for today's complex, rapidly changing software projects. Adaptive control theory may provide a better model than traditional approaches. Adaptive control systems and agile development processes use feedback loops and emergent solutions to adjust to changes in dynamics, disturbances, or other unplanned events, similar to how project management needs to respond.
Vicinity Jobs’ data includes more than three million 2023 OJPs and thousands of skills. Most skills appear in less than 0.02% of job postings, so most postings rely on a small subset of commonly used terms, like teamwork.
Laura Adkins-Hackett, Economist, LMIC, and Sukriti Trehan, Data Scientist, LMIC, presented their research exploring trends in the skills listed in OJPs to develop a deeper understanding of in-demand skills. This research project uses pointwise mutual information and other methods to extract more information about common skills from the relationships between skills, occupations and regions.
The Universal Account Number (UAN) by EPFO centralizes multiple PF accounts, simplifying management for Indian employees. It streamlines PF transfers, withdrawals, and KYC updates, providing transparency and reducing employer dependency. Despite challenges like digital literacy and internet access, UAN is vital for financial empowerment and efficient provident fund management in today's digital age.
Falcon stands out as a top-tier P2P Invoice Discounting platform in India, bridging esteemed blue-chip companies and eager investors. Our goal is to transform the investment landscape in India by establishing a comprehensive destination for borrowers and investors with diverse profiles and needs, all while minimizing risk. What sets Falcon apart is the elimination of intermediaries such as commercial banks and depository institutions, allowing investors to enjoy higher yields.
University of North Carolina at Charlotte degree offer diploma Transcripttscdzuip
办理美国UNCC毕业证书制作北卡大学夏洛特分校假文凭定制Q微168899991做UNCC留信网教留服认证海牙认证改UNCC成绩单GPA做UNCC假学位证假文凭高仿毕业证GRE代考如何申请北卡罗莱纳大学夏洛特分校University of North Carolina at Charlotte degree offer diploma Transcript
[4:55 p.m.] Bryan Oates
OJPs are becoming a critical resource for policy-makers and researchers who study the labour market. LMIC continues to work with Vicinity Jobs’ data on OJPs, which can be explored in our Canadian Job Trends Dashboard. Valuable insights have been gained through our analysis of OJP data, including LMIC research lead
Suzanne Spiteri’s recent report on improving the quality and accessibility of job postings to reduce employment barriers for neurodivergent people.
Decoding job postings: Improving accessibility for neurodivergent job seekers
Improving the quality and accessibility of job postings is one way to reduce employment barriers for neurodivergent people.
5 Tips for Creating Standard Financial ReportsEasyReports
Well-crafted financial reports serve as vital tools for decision-making and transparency within an organization. By following the undermentioned tips, you can create standardized financial reports that effectively communicate your company's financial health and performance to stakeholders.
Understanding how timely GST payments influence a lender's decision to approve loans, this topic explores the correlation between GST compliance and creditworthiness. It highlights how consistent GST payments can enhance a business's financial credibility, potentially leading to higher chances of loan approval.
A toxic combination of 15 years of low growth, and four decades of high inequality, has left Britain poorer and falling behind its peers. Productivity growth is weak and public investment is low, while wages today are no higher than they were before the financial crisis. Britain needs a new economic strategy to lift itself out of stagnation.
Scotland is in many ways a microcosm of this challenge. It has become a hub for creative industries, is home to several world-class universities and a thriving community of businesses – strengths that need to be harness and leveraged. But it also has high levels of deprivation, with homelessness reaching a record high and nearly half a million people living in very deep poverty last year. Scotland won’t be truly thriving unless it finds ways to ensure that all its inhabitants benefit from growth and investment. This is the central challenge facing policy makers both in Holyrood and Westminster.
What should a new national economic strategy for Scotland include? What would the pursuit of stronger economic growth mean for local, national and UK-wide policy makers? How will economic change affect the jobs we do, the places we live and the businesses we work for? And what are the prospects for cities like Glasgow, and nations like Scotland, in rising to these challenges?
OJP data from firms like Vicinity Jobs have emerged as a complement to traditional sources of labour demand data, such as the Job Vacancy and Wages Survey (JVWS). Ibrahim Abuallail, PhD Candidate, University of Ottawa, presented research relating to bias in OJPs and a proposed approach to effectively adjust OJP data to complement existing official data (such as from the JVWS) and improve the measurement of labour demand.
Falcon stands out as a top-tier P2P Invoice Discounting platform in India, bridging esteemed blue-chip companies and eager investors. Our goal is to transform the investment landscape in India by establishing a comprehensive destination for borrowers and investors with diverse profiles and needs, all while minimizing risk. What sets Falcon apart is the elimination of intermediaries such as commercial banks and depository institutions, allowing investors to enjoy higher yields.
Discover the Future of Dogecoin with Our Comprehensive Guidance36 Crypto
Learn in-depth about Dogecoin's trajectory and stay informed with 36crypto's essential and up-to-date information about the crypto space.
Our presentation delves into Dogecoin's potential future, exploring whether it's destined to skyrocket to the moon or face a downward spiral. In addition, it highlights invaluable insights. Don't miss out on this opportunity to enhance your crypto understanding!
https://36crypto.com/the-future-of-dogecoin-how-high-can-this-cryptocurrency-reach/
Tdasx: In-Depth Analysis of Cryptocurrency Giveaway Scams and Security Strate...
Programmatic risk management workshop (handbook)
1. Programmatic Risk Management Work (Handbook)
Programmatic Risk Management:
A “not so simple” introduction to the
complex but critical process of building a
“credible” schedule
Program Planning and Controls Workshop, Denver, Colorado
October 6th and October 14th 2008
2. Agenda
Duration Topic
20 Minutes Risk Management in Five Easy Pieces
15 Minutes Basic Statistics for programmatic risk management
15 Minutes Monte Carlo Simulation (MCS) theory
20 Minutes Mechanics of MSFT Project and Risk+
15 Minutes Programmatic Risk Ranking
15 Minutes Building a Credible schedule
20 Minutes Conclusion
120 Minutes
3. When we say “Risk Management”
What do we really mean?
4. Five Easy Pieces†:
The Essentials of
Managing
Programmatic Risk
Managing the risk to cost, schedule, and technical performance is the
basis of a successful project management method.
† With apologies to Carole Eastman and Bob Rafelson for their 1970 film staring Jack Nicholson
Risk in Five Easy Pieces
5. Hope is Not a Strategy
When General Custer was completely surrounded,
his chief scout asked, “General what's our strategy?”
Custer replied, “The first thing we need to do is
make a note to ourselves – never get in this situation
again.”
Hope is not a strategy!
A Strategy is the plan to successfully complete the project
If the project’s success factors, the processes that deliver them,
the alternatives when they fail, and the measurement of this
success are not defined in meaningful ways for both the
customer and managers of the project – Hope is the only
strategy left.
Risk in Five Easy Pieces
6. No Single Point Estimate can be correct without
knowing the variance
When estimating
Single Point Estimates use sample data to
cost and duration calculate a single value (a statistic) that serves as
for planning a "best guess" for an unknown (fixed or random)
purposes using population parameter
Point Estimates Bayesian Inference is a statistical inference
results in the where evidence or observations are used to infer
least likely result. the probability that a hypothesis may be true
A result with a
Identifying underlying statistical behavior of the
50/50 chance of
being true.
cost and schedule parameters of the project is the
first step in forecasting future behavior
Without this information and the model in which it
is used any statements about cost, schedule and
completion dates are a 50/50 guesses
Risk in Five Easy Pieces
7. Without Integrating $, Time, and TPM
you’re driving in the rearview mirror
Technical
Performance (TPM)
Addressing customer satisfaction means incorporating
product requirements and planned quality into the
Performance Measurement Baseline to assure the true
performance of the project is made visible.
Risk in Five Easy Pieces
8. Without a model for risk management, you’re driving in the dark with
the headlights turn off
The Risk
Management
process to the
right is used by
the US DOD and
differs from the
PMI approach in
how the
processes areas
are arranged.
The key is to
understand the
relationships
between these
areas. Risk Management means using a proven risk management
process, adapting this to the project environment, and using this
process for everyday decision making.
Risk in Five Easy Pieces
9. Risk Communication is …
An interactive process of exchange of
information and opinion among
individuals, groups, and institutions;
often involving multiple messages about
the nature of risk or expressing
concerns, opinions, or reactions to risk
messages or to legal or institutional
arrangements for risk management.
Bad news is not wine. It does not improve with age
— Colin Powell
Risk in Five Easy Pieces
10. Basic Statistics for Programmatic
Risk Management
Since all point estimates are wrong, statistical estimates will be needed
to construct a credible cost and schedule model
Basic Statistics
11. Uncertainty and Risk are not the same
thing – don’t confuse them
Uncertainty stems from Risk stems from known
unknown probability probability distributions
distributions – Cost estimating methodology risk
– Requirements change impacts resulting from improper models of
– Budget Perturbations cost
– Re–work, and re–test phenomena – Cost factors such as inflation,
labor rates, labor rate burdens,
– Contractual arrangements
etc
(contract type, prime/sub
relationships, etc) – Configuration risk (variation in the
technical inputs)
– Potential for disaster (labor
troubles, shuttle loss, satellite – Schedule and technical risk
“falls over”, war, hurricanes, etc.) coupling
– Probability that if a discrete event – Correlation between risk
occurs it will invoke a project distributions
delay
Basic Statistics
12. There are 2 types of Uncertainty
encountered in cost and schedule
Static uncertainty is natural variation and
foreseen risks
– Uncertainty about the value of a parameter
Dynamic uncertainty is unforeseen
uncertainty and “chaos”
– Stochastic changes in the underlying
environment
– System time delays, interactions between
the network elements, positive and negative
feedback loops
– Internal dependencies
Basic Statistics
13. The Multiple Sources of Schedule Uncertainty
and Sorting Them Out is the Role of Planning
Unknown interactions drive
uncertainty
Dynamic uncertainty can be
addressed by flexibility in the
schedule
– On ramps
– Off ramps
– Alternative paths
– Schedule “crashing” opportunities
Modeling of this dynamic
uncertainty requires simulation
rather than static PERT based path
assessment
– Changes in critical path are
dependent on time and state of the
network
– The result is a stochastic network
Basic Statistics
14. Statistics at a Glance
Probability distribution – A Bias –The expected deviation of the
function that describes the expected value of a statistical
probabilities of possible outcomes estimate from the quantity it
in a "sample space.” estimates.
Random variable – variable a Correlation – A measure of the joint
function of the result of a impact of two variables upon each
statistical experiment in which other that reflects the simultaneous
each outcome has a definite variation of quantities.
probability of occurrence. Percentile – A value on a scale of
Determinism – a theory that 100 indicating the percent of a
phenomena are causally distribution that is equal to or
determined by preceding events or below it.
natural laws. Monte Carlo sampling – A modeling
Standard deviation (sigma value) – technique that employs random
An index that characterizes the sampling to simulate a population
dispersion among the values in a being studied.
population.
Basic Statistics
15. Statistics Versus Probability
In building a risk tolerant
schedule, we’re interested in the
probability of a successful
outcome
– “What is the probability of making a
desired completion date?”
But the underlying statistics of the
tasks influence this probability
The statistics of the tasks, their
arrangement in a network of tasks
and correlation define how this
probability based estimated
developed.
Basic Statistics
16. Each path and each task along that path has a
probability distribution
Any path could be critical depending on the convolution of the
underlying task completion time probability distribution functions
The independence or
dependency of each task
with others in the network,
greatly influences the
outcome of the total project
duration
Understanding this
dependence is critical to
assessing the credibility of
the plan as well as the total
completion time of that plan
Basic Statistics
17. Probability Distribution Functions are the Life
Blood of good planning
Probability of
occurrence as a
function of the
number of
samples
“The number of
times a task
duration appears
in a Monte Carlo
simulation”
Basic Statistics
18. Statistics of a Triangle Distribution
Triangle 50% of all possible values are under
distributions are this area of the curve. This is the
useful when there definition of the median
is limited
information about
the characteristics
of the random
variables are all
that is available.
This is common in
project cost and Minimum Maximum
schedule estimates. 1000 hrs 6830 hrs
Mode = 2000 hrs Mean = 3879 hrs
Median = 3415 hrs
Basic Statistics
19. Basics of Monte Carlo Simulation
Far better an approximate answer to the right question, which is often
vague, than an exact answer to the wrong question, which can always
be made precise. — John W. Tukey, 1962
Basics of Monte Carlo
20. Monte Carlo Simulation
Yes Monte Carlo is named after the
country full of casinos located on
the French Rivera
Advantages of Monte Carlo over
PERT is that Monte Carlo…
– Examines all paths, not just the critical
path
– Provides an accurate (true) estimate of
completion
• Overall duration distribution
• Confidence interval (accuracy range)
– Sensitivity analysis of interacting tasks
– Varied activity distribution types – not restricted to Beta
– Schedule logic can include branching – both probabilistic and conditional
– When resource loaded schedules are used – provides integrated cost and schedule
probabilistic model
Basics of Monte Carlo
21. First let’s be convinced that PERT has
limited usefulness
The original paper (Malcolm 1959) states
– The method is “the best that could be done in a real
situation within tight time constraints.”
– The time constraint was One Month
The PERT time made the assumption that the
standard deviation was about 1/6 of the range (b–
a), resulting in the PERT formula.
It has been shown that the PERT mean and
standard deviation formulas are poor
approximations for most Beta distributions (Keefer
1983 and Keefer 1993).
– Errors up to 40% are possible for the PERT mean
– Errors up to 550% are possible for the PERT standard
deviation
Basics of Monte Carlo
22. Critical Path and Mostly Likelies
Critical Path’s are Deterministic
– At least one path exists through
the network
– The critical path is identified by
adding the “single point” estimates
– The critical predicts the completion
date only if everything goes
according to plan (we all know this
of course)
Schedule execution is Probabilistic
– There is a likelihood that some durations will comprise a path that is off the critical
path
– The single number for the estimate – the “single point estimate” is in fact a most
likely estimate
– The completion date is not the most likely date, but is a confidence interval in the
probability distribution function resulting from the convolution of all the distributions
along all the paths to the completion of the project
Basics of Monte Carlo
23. Deterministic PERT Uses Three Point
Estimates In A Static Manner
Durations are defined as three point estimates
– These estimates are very subjective if captured individually by asking…
– “What is the Minimum, Maximum, and Most Likely”
Critical path is defined from these
estimates is the algebraic addition of
three point estimates
Project duration is based on the
algebraic addition of the times along
the critical path
This approach has some serious
problems from the outset
– Durations must be independent
– Most likely is not the same as the
average
Basics of Monte Carlo
24. Foundation of Monte Carlo Theory
George Louis Leclerc, Comte de Buffon,
asked what was the probability that the needle
would fall across one of the lines, marked in
green.
That outcome occurs only if: A l sin
Basics of Monte Carlo
25. Mechanics of Risk+ integrated with
Microsoft Project
Any credible schedule is a credible model of its dynamic behavior. This
starts with a Monte Carlo model of the schedule’s network of tasks
Mechanics of Risk+
26. The Simplest Risk+ elements
Task to “watch” Most Likely Distribution
(Number3) (Duration3) (Number1)
Optimistic Pessimistic
(Duration1) (Duration2)
Mechanics of Risk+
27. The output of Risk+
Date: 9/26/2005 2:14:02 PM Completion Std Deviation: 4.83 days
Samples: 500 95% Confidence Interval: 0.42 days
Task to “watch” Unique ID: 10 Each bar represents 2 days
Name: Task 10
0.16 1.0 Completion Probability Table
Cumulative Probability
0.9
0.14 Prob Date Prob Date
0.8
0.12 0.05 2/17/06 0.55 3/1/06
0.7
Frequency
0.10 2/21/06 0.60 3/2/06
0.10 0.6 0.15 2/22/06 0.65 3/3/06
0.08 0.5 0.20 2/22/06 0.70 3/3/06
0.4 0.25 2/23/06 0.75 3/6/06
0.06
0.3 0.30 2/24/06 0.80 3/7/06 80% confidence
0.04 0.35 2/27/06 0.85 3/8/06
0.2
0.40 2/27/06 0.90 3/9/06 that task will
0.02 0.1 0.45 2/28/06 0.95 3/13/06 complete by
2/10/06 3/1/06 3/17/06
0.50 3/1/06 1.00 3/17/06
Completion Date
3/7/06
The height of each box indicates The standard deviation of the
how often the project complete in a completion date and the 95%
given interval during the run confidence interval of the expected
The S–Curve shows the cumulative completion date are in the same
probability of completing on or units as the “most likely remaining
before a given date. duration” field in the schedule
Mechanics of Risk+
28. A Well Formed Risk+ Schedule
For Risk+ to provide useful information, the underlying schedule must
be well formed on some simple way.
Mechanics of Risk+
29. A Well formed Risk+ Schedule
A good critical path network
– No constraint dates
– Lowest level tasks have predecessors and
successors
– 80% of relationships are finish to start
Identify risk tasks
– These are “reporting tasks”
– Identify the preview task to watch during
simulation runs
Defining the probability distribution profile for each task
– Bulk assignment is an easy way to start
– A – F ranking is another approach
– Individual risk profile assignments is best but tedious
Mechanics of Risk+
30. Analyzing the Risk+ Simulation
Risk+ generates one or more of
the following outputs:
– Earliest, expected, and latest
completion date for each reporting
task
– Graphical and tabular displays of the
completion date distribution for each
reporting task
– The standard deviation and
confidence interval for the
completion date distribution for each
reporting task
– The criticality index (percentage of
time on the critical path) for each
task
– The duration mean and standard deviation for each task
– Minimum, expected, and maximum cost for the total project
– Graphical and tabular displays of cost distribution for the total project
– The standard deviation and confidence interval for cost at the total project level
Mechanics of Risk+
31. Programmatic Risk Ranking
The variance in task duration must be defined in some systematic way.
Capturing three point values is the least desirable.
Programmatic Risk Ranking
32. Thinking about risk ranking
These classifications can be used to avoid asking the “3
point” question for each task
This information will be maintained in the IMS
When updates are made the percentage change can be
applied across all tasks
Classification Uncertainty Overrun
A Routine, been done before Low 0% to 2%
B Routine, but possible difficulties Medium to Low 2% to 5%
C Development, with little technical difficulty Medium 5% to 10%
D Development, but some technical difficulty Medium High 10% to 15%
E Significant effort, technical challenge High 15% to 25%
F No experience in this area Very High 25% to 50%
Programmatic Risk Ranking
33. Steps in characterizing uncertainty
Use an “envelope” method to characterize the minimum,
maximum and “most likely”
Fit this data to a statistical distribution
Use conservative assumptions
Apply greater uncertainty to less mature technologies
Confirm analysis matches intuition
Remember Sir Francis Bacon’s quote
about beginning with uncertainty and
ending with certainty.
If we start with a what we think is a
valid number we will tend to continue
with that valid number.
When in fact we should speak only in
terms of confidence intervals and
probabilities of success.
Programmatic Risk Ranking
34. Sobering observations about 3 point
estimates when asking engineers
In 1979, Tversky and Kahneman proposed an
alternative to Utility theory. Prospect theory asserts that
people make predictably irrational decisions.
The way that a choice of decisions is presented can
sway a person to choose the less rational decision from
a set of options.
Once a problem is clearly and reasonably presented,
rarely does a person think outside the bounds of the
frame.
Source:
– “The Causes of Risk Taking By Project Managers,”
Proceedings of the Project Management Institute Annual
Seminars & Symposium November 1–10, 2001 •
Nashville, Tennessee
– Tversky, Amos, and Daniel Kahneman. 1981. The Framing
of Decisions and the Psychology of Choice. Science 211
(January 30): 453–458
Programmatic Risk Ranking
35. Building a Credible Schedule
A credible schedule contains a well formed network, explicit risk
mitigations, proper margin for these risks, and a clear and concise
critical path(s). All of this is prologue to analyzing the schedule.
Building a Credible Schedule
36. Good schedules have a contingency plans
The schedule contingency
needed to make the plan credible
can be derived from the Risk+
analysis
The schedule contingency is the Is This Our
amount of time added (or Contingency
subtracted) from the baseline Plan ?
schedule necessary to achieve
the desired probability of an under
run or over run.
The schedule contingency can be determined through
– Monte Carlo simulations (Risk+)
– Best judgment from previous experience
– Percentage factors based on historical experience
– Correlation analysis for dependency impacts
Building a Credible Schedule
37. Schedule quality and accuracy
Accuracy range
– Similar for each estimate class
Consistent with estimate
– Level of project definition
– Purpose
– Preparation effort
Monte Carlo simulation
– Analysis of results shows quality attained versus the quality sought
(expected accuracy ranges)
Achieving specified accuracy requirements
– Select value at end points of confidence interval
– Calculate percentages from base schedule completion date, including
the contingency
Building a Credible Schedule
38. Technical Performance Measures
Technical Performance Measures are one method of showing risk by
done
– Specific actions taken in the IMS to move the compliance forward toward the
goal
Activities that
assessing the
increasing compliance
to the technical
performance measure
can be show in the
IMS
– These can be
Accomplishment
Criteria
Building a Credible Schedule
39. The Monte Carlo Process starts with the 3 point
estimates
Estimates of the task duration are still needed, just
like they are in PERT
These three
point estimates – Three point estimates could be used
are not the PERT – But risk ranking and algorithmic generation of the
ones. “spreads” is a better approach
They are derived
from the ordinal Duration estimates must be parametric rather than
risk ranking numeric values
process.
This allows them
– A geometric scale of parametric risk is one approach
to be “calibrated” Branching probabilities need to be defined
for the domain,
correlated with – Conditional paths through the schedule can be evaluated
the technical risk using Monte Carlo tools
model.
– This also demonstrate explicit risk mitigation planning to
answer the question “what if this happens?”
Building a Credible Schedule
40. Expert Judgment is required to build a Risk
Management approach
Expert judgment is typically the basis of cost and schedule
Building the
estimates
variance
– Expert judgment is usually the weakest area of process and
values for the
quantification
ordinal risk
– Translating from English (SOW) to mathematics (probabilistic
rank is a
risk model) is usually inconsistent at best and erroneous at
technical worst
process,
One approach
requiring
engineering – Plan for the “best case” and preclude a self–fulfilling
prophesy
judgment.
– Budget for the “most likely” and recognize risks and
uncertainties
– Protect for the “worst case” and acknowledge the conceivable
in the risk mitigation plan
The credibility of the “best case” estimates if crucial to the
success of this approach
Building a Credible Schedule
41. Guiding the Risk Factor Process requires
careful weighting of each level of risk
For tasks marked “Low” a reasonable
Min Most Max
approach is to score the maximum 10% Likely
greater than the minimum.
Low 1.0 1.04 1.10
The “Most Likely” is then scored as a
Low+ 1.0 1.06 1.15
geometric progression for the remaining
categories with a common ratio of 1.5 Moderate 1.0 1.09 1.24
Tasks marked “Very High” are bound at Moderate+ 1.0 1.14 1.36
200% of minimum. High 1.0 1.20 1.55
– No viable project manager would like a task High+ 1.0 1.30 1.85
grow to three times the planned duration
without intervention Very High 1.0 1.46 2.30
The geometric progress is somewhat Very High+ 1.0 1.68 3.00
arbitrary but it should be used instead of
a linear progression
Building a Credible Schedule
42. Assume now we have a well formed schedule – now
what?
With all the “bone head” elements
For the role of removed, we can say we have a
PP&C is to
move “reporting well formed schedule
past
performance” to But the real role of Planning is to
“forecasting
future forecast the future, provide
performance” it
must break the alternative Plan’s for this forecast
mold of using
static models of
and actively engage all the
cost and participants in the projects in the
schedule
Planning Process
Building a Credible Schedule
43. We’re really after the management of schedule
margin as part of planning
Plan the risk alternatives that Assign duration and resource
“might” be needed estimates to both branches
– Each mitigation has a Plan B Turn off for alternative for a
branch “success” path assessment
– Keep alternatives as simple as Turn off primary for a “failure” path
possible (maybe one task)
assessment
Assess probability of the alternative
occurring
Plan B
30% Probability
of failure
80% Confidence for completion
with current margin
70% Probability
of success
Plan A Current Margin Future Margin
Duration of Plan B Plan A + Margin
Building a Credible Schedule
44. Successful margin management requires the
reuse of unused durations
Programmatic Margin is added between Margin that is not used in the IMS for risk
Development, Production and Integration mitigation will be moved to the next
& Test phases sequence of risk alternatives
Risk Margin is added to the IMS where – This enables us to buy back schedule margin
risk alternatives are identified for activities further downstream
– This enables us to control the ripple effect of
schedule shifts on Margin activities
Downstream
Duration of Plan B < Plan A + Margin Activities shifted to
Plan B left 2 days
Plan B
3 Days Margin Used
Plan A
5 Days Margin
First Identified Risk Alternative in IMS Plan A 5 Days Margin
Second Identified Risk 2 days will be added
to this margin task
Alternative in IMS to bring schedule
back on track
Building a Credible Schedule
45. Simulation Considerations
Schedule logic and constraints
– Simplify logic – model only paths which, by
inspection, may have a significant bearing on the
final result
– Correlate similar activities
– No open ends
– Use only finish–to–start relationships with no
lags
– Model relationships other than finish–to–start as
activities with base durations equal to the lag
value
– Eliminate all date constraints
– Consider using branching for known alternatives
Building a Credible Schedule
46. The contents of the schedule
Constraints
Lead/Lag
Task relationships
Durations
Network topology
Building a Credible Schedule
47. Simulation Considerations
Selection of Probability Distributions
– Develop schedule simulation inputs concurrently
with the cost estimate
• Early in process – use same subject matter experts
• Convert confidence intervals into probability duration
distributions
– Number of distributions vary depending on
software
– Difficult to develop inputs required for
distributions
– Beta and Lognormal better than triangular; avoid
exclusive use of Normal distribution
Building a Credible Schedule
48. Sensitivity Analysis describes which
tasks drive the completion times
Concentrates on inputs most likely to
improve quality (accuracy)
Identifies most promising opportunities
where additional work will help to
narrow input ranges
Methods
– Run multiple simulations
– Use criticality index
– “Tornado” or Pareto graph
Building a Credible Schedule
49. What we get in the end is a Credible
Model of the schedule
All models are wrong. Some
models are useful.
– George Box (1919 – )
Concept generator from Ramon
Lull’s Ars Magna (C. 1300)
Building a Credible Schedule
50. Conclusion
At this point there is too much information. Processing this information
will take time, patience, and most of all practice with the tools and the
results they produce.
Conclusion
51. Conclusions
Project schedule status must be
assessed in terms of a critical path
through the schedule network
Because the actual durations of each
task in the network are uncertain (they
are random variables following a
probability distribution function), the
project schedule duration must be
modeled statistically
Conclusion
52. Conclusions
Quality (accuracy) is measured at the
end points of achieved confidence
interval (suggest 80% level)
Simulation results depend on:
– Accuracy and care taken with base schedule
logic
– Use of subject matter experts to establish
inputs
– Selection of appropriate distribution types
– Through analysis of multiple critical paths
– Understanding which activities and paths
have the greatest potential impact
Conclusion
53. Conclusions
Cost and schedule estimates are made up of many
independent elements.
– When each element is planned as best case – e.g. a
probability of achievement of 10%
– The probability of achieving best case for a two–element
estimate is 1%
– For three elements, 0.01%
– For many elements, infinitesimal
– In effect, it is zero.
In the beginning no attempt should be made to
distinguish between risk and uncertainty
– Risk involves uncertainty but it is indeed more
– For initial purposes it is unimportant
– The effect is combined into one statistical factor called
“risk,” which can be described by a single probability
distribution function
Conclusion
54. What are we really after in the end?
As the program
proceeds so
does:
– Increasing
accuracy
– Reduced
schedule risk
– Increasing
visual
confirmation Current Estimate Accuracy
that success
can be reached
Conclusion
55. Points to remember
Good project management is good risk
management
Risk management is how adults manage projects
The only thing we manage is project risk
Risks impact objectives
Risks come from the decisions we make while
trying to achieve the objectives
Risks require a factual condition and have potential
negative consequences that must be mitigated in
the schedule
Conclusion
56. Usage is needed before understanding is
acquired
Here and elsewhere, we shall not
obtain the best insights into things
until we actually see them growing
from the beginning.
— Aristotle
Conclusion
57. The End
A planning algorithm from
Aristotle’s De Motu Animalium
c. 400 BC
This is actually the beginning, since building a risk tolerant, credible,
robust schedule requires constant “execution” of the plan.
Conclusion
58. Resources
1. “The Parameters of the Classical PERT: An Assessment of its Success,”
Rafael Herrerias Pleguezuelo,
http://www.cyta.com.ar/biblioteca/bddoc/bdlibros/pert_van/PARAMETROS.PD
F
2. “Advanced Quantitative Schedule Risk Analysis,” David T. Hulett, Hulett &
Associates, http://www.projectrisk.com/index.html
3. “Schedule Risk Analysis Simplified,” David T. Hulett, Hulett & Associates,
http://www.projectrisk.com/index.html
4. “Project Risk Management: A Combined Analytical Hierarchy Process and
Decision Tree Approach,” Prasanta Kumar Dey, Cost Engineering, Vol. 44,
No. 3, March 2002.
5. “Adding Probability to Your ‘Swiss Army Knife’,” John C. Goodpasture,
Proceedings of the 30th Annual Project Management Institute 1999 Seminars
and Symposium, October, 1999.
6. “Modeling Uncertainty in Project Scheduling,” Patrick Leach, Proceedings of
the 2005 Crystal Ball User Conference
7. “Near Critical Paths Create Violations in the PERT Assumptions of Normality,”
Frank Pokladnik and Robert Hill, University of Houston, Clear Lake,
http://www.sbaer.uca.edu/research/dsi/2003/procs/237–4203.pdf
Resources
59. Resources
8. “Teaching SuPERT,” Kenneth R. MacLeod and Paul F. Petersen,
Proceedings of the Decision Sciences 2003 Annual Meeting, Washington DC,
http://www.sbaer.uca.edu/research/dsi/2003/by_track_paper.html
9. “The Beginning of the Monte Carlo Method,” N. Metropolis, Los Alamos
Science, Special Issue, 1987.
http://www.fas.org/sgp/othergov/doe/lanl/pubs/00326866.pdf
10. “Defining a Beta Distribution Function for Construction Simulation,” Javier
Fente, Kraig Knutson, Cliff Schexnayder, Proceedings of the 1999 Winter
Simulation Conference.
11. “The Basics of Monte Carlo Simulation: A Tutorial,” S. Kandaswamy,
Proceedings of the Project Management Institute Annual Seminars &
Symposium, November, 2001.
12. “The Mother of All Guesses: A User Friendly Guide to Statistical Estimation,”
Francois Melese and David Rose, Armed Forces Comptroller, 1998,
http://www.nps.navy.mil/drmi/graphics/StatGuide–web.pdf
13. “Inverse Statistical Estimation via Order Statistics: A Resolution of the Ill–
Posed Inverse problem of PERT Scheduling,” William F. Pickard, Inverse
Problems 20, pp. 1565–1581, 2004
Resources
60. Resources
14. “Schedule Risk Analysis: Why It Is Important and How to Do It, “Stephen A.
Book, Proceedings of the Ground Systems Architecture Workshop (GSAW
2002), Aerospace Corporation, March 2002,
http://sunset.usc.edu/GSAW/gsaw2002/s11a/book.pdf
15. “Evaluation of the Risk Analysis and Cost Management (RACM) Model,”
Matthew S. Goldberg, Institute for Defense Analysis, 1998.
http://www.thedacs.com/topics/earnedvalue/racm.pdf
16. “PERT Completion Times Revisited,” Fred E. Williams, School of
Management, University of Michigan–Flint, July 2005,
http://som.umflint.edu/yener/PERT%20Completion%20Revisited.htm
17. “Overcoming Project Risk: Lessons from the PERIL Database,” Tom Hendrick
, Program Manager, Hewlett Packard, 2003,
http://www.failureproofprojects.com/Risky.pdf
18. “The Heart of Risk Management: Teaching Project Teams to Combat Risk,”
Bruce Chadbourne, 30th Annual Project Management Institute 1999 Seminara
and Symposium, October 1999,
http://www.risksig.com/Articles/pmi1999/rkalt01.pdf
Resources
61. Resources
20. Project Risk Management Resource List, NASA Headquarters Library,
http://www.hq.nasa.gov/office/hqlibrary/ppm/ppm22.htm#art
21. “Quantify Risk to Manage Cost and Schedule,” Fred Raymond, Acquisition
Quarterly, Spring 1999, http://www.dau.mil/pubs/arq/99arq/raymond.pdf
22. “Continuous Risk Management,” Cost Analysis Symposium, April 2005,
http://www1.jsc.nasa.gov/bu2/conferences/NCAS2005/papers/5C_–
_Cockrell_CRM_v1_0.ppt
23. “A Novel Extension of the Triangular Distribution and its Parameter
Estimation,” J. Rene van Dorp and Samuel Kotz, The Statistician 51(1), pp.
63 – 79, 2002.
http://www.seas.gwu.edu/~dorpjr/Publications/JournalPapers/TheStatistician2
002.pdf
24. “Distribution of Modeling Dependence Cause by Common Risk Factors,”
J. Rene van Dorp, European Safety and Reliability 2003 Conference
Proceedings, March 2003,
http://www.seas.gwu.edu/~dorpjr/Publications/ConferenceProceedings/Esrel2
003.pdf
Resources
62. Resources
25. “Improved Three Point Approximation To Distribution Functions For
Application In Financial Decision Analysis,” Michele E. Pfund, Jennifer E.
McNeill, John W. Fowler and Gerald T. Mackulak, Department of Industrial
Engineering, Arizona State University, Tempe, Arizona,
http://www.eas.asu.edu/ie/workingpaper/pdf/cdf_estimation_submission.pdf
26. “Analysis Of Resource–constrained Stochastic Project Networks Using
Discrete–event Simulation,” Sucharith Vanguri, Masters Thesis, Mississippi
State University, May 2005, http://sun.library.msstate.edu/ETD–
db/theses/available/etd–04072005–
123743/restricted/SucharithVanguriThesis.pdf
27. “Integrated Cost / Schedule Risk Analysis,” David T. Hulett and Bill Campbell,
Fifth European Project Management Conference, June 2002.
28. “Risk Interrelation Management – Controlling the Snowball Effect,” Olli
Kuismanen, Tuomo Saari and Jussi Vähäkylä, Fifth European Project
Management Conference, June 2002.
29. The Lady Tasting Tea: How Statistics Revolutionized Science in the
Twentieth Century, David Salsburg, W. H. Freeman, 2001
Resources
63. Resources
30. “Triangular Approximations for Continuous Random Variables in Risk
Analysis,” David G. Johnson, The Business School, Loughborough University,
Liecestershire.
31. “Statistical Dependence through Common Risk Factors: With Applications in
Uncertainty Analysis,” J. Rene van Dorp, European Journal of Operations
Research, Volume 161(1), pp. 240–255.
32. “Statistical Dependence in the risk analysis for Project Networks Using Monte
Carlo Methods,” J. Rene van Dorp and M. R. Dufy, International Journal of
Production Economics, 58, pp. 17–29, 1999.
http://www.seas.gwu.edu/~dorpjr/Publications/JournalPapers/Prodecon1999.p
df
33. “Risk Analysis for Large Engineering Projects: Modeling Cost Uncertainty for
Ship Production Activities,” M. R. Dufy and J. Rene van Dorp, Journal of
Engineering Valuation and Cost Analysis, Volume 2. pp. 285–301,
http://www.seas.gwu.edu/~dorpjr/Publications/JournalPapers/EVCA1999.pdf
34. “Risk Based Decision Support techniques for Programs and Projects,” Barney
Roberts and David Frost, Futron Risk Management Center of Excellence,
http://www.futron.com/pdf/RBDSsupporttech.pdf
Resources
64. Resources
35. Probabilistic Risk Assessment Procedures Guide for NASA Managers and
Practitioners, Office of Safety and Mission Assurance, April 2002.
http://www.hq.nasa.gov/office/codeq/doctree/praguide.pdf
36. “Project Planning: Improved Approach Incorporating Uncertainty,” Vahid
Khodakarami, Norman Fenton, and Martin Neil, Track 15 EURAM2005:
“Reconciling Uncertainty and Responsibility” European Academy of
Management.
http://www.dcs.qmw.ac.uk/~norman/papers/project_planning_khodakerami.pd
f
37. “A Distribution for Modeling Dependence Caused by Common Risk Factors,”
J. Rene van Dorp, European Safety and Reliability 2003 Conference
Proceedings, March 2003.
38. “Probabilistic PERT,” Arthur Nadas, IBM Journal of Research and
Development, 23(3), May 1979, pp. 339–347.
39. “Ranked Nodes: A Simple and effective way to model qualitative in large–
scale Bayesian Networks,” Norman Fenton and Martin Neil, Risk Assessment
and Decision Analysis Research Group, Department of Computer Science,
Queen Mary, University of London, February 21, 2005.
Resources
65. Resources
40. “Quantify Risk to Manage Cost and Schedule,” Fred Raymond, Acquisition
Review Quarterly, Spring 1999, pp. 147–154
41. “The Causes of Risk Taking by Project Managers,” Michael Wakshull,
Proceedings of the Project Management Institute Annual Seminars &
Symposium, November 2001.
42. “Stochastic Project Duration Analysis Using PERT–Beta Distributions,” Ron
Davis.
43. “Triangular Approximation for Continuous Random Variables in Risk
Analysis,” David G. Johnson, Decision Sciences Institute Proceedings 1998.
http://www.sbaer.uca.edu/research/dsi/1998/Pdffiles/Papers/1114.pdf
44. “The Cause of Risk Taking by Managers,” Michael N.Wakshull, Proceedings
of the Project Management Institute Annual Seminars & Symposium
November 1–10, 2001, Nashville Tennessee ,
http://www.risksig.com/Articles/pmi2001/21261.pdf
45. “The Framing of Decisions and the Psychology of Choice,” Tversky, Amos,
and Daniel Kahneman. 1981, Science 211 (January 30): 453–458,
http://www.cs.umu.se/kurser/TDBC12/HT99/Tversky.html
Resources
66. Resources
46. “Three Point Approximations for Continuous Random Variables,” Donald
Keefer and Samuel Bodily, Management Science, 29(5), pp. 595 – 609.
47. “Better Estimation of PERT Activity Time Parameters,” Donald Keefer and
William Verdini, Management Science, 39(9), pp. 1086 – 1091.
48. “The Benefits of Integrated, Quantitative Risk Management,” Barney B.
Roberts, Futron Corporation, 12th Annual International Symposium of the
International Council on Systems Engineering, July 1–5, 2001,
http://www.futron.com/pdf/benefits_QuantIRM.pdf
49. “Sources of Schedule Risk in Complex Systems Development,” Tyson R.
Browning, INCOSE Systems Engineering Journal, Volume 2, Issue 3, pp. 129
– 142, 14 September 1999,
http://sbufaculty.tcu.edu/tbrowning/Publications/Browning%20(1999)––
SE%20Sch%20Risk%20Drivers.pdf
50. “Sources of Performance Risk in Complex System Development,” Tyson R.
Browning, 9th Annual International Symposium of INCOSE, June 1999,
http://sbufaculty.tcu.edu/tbrowning/Publications/Browning%20(1999)––
INCOSE%20Perf%20Risk%20Drivers.pdf
Resources
67. Resources
51. “Experiences in Improving Risk Management Processes Using the Concepts
of the Riskit Method,” Jyrki Konito, Gerhard Getto, and Dieter Landes, ACM
SIGSOFT Software Engineering Notes , Proceedings of the 6th ACM
SIGSOFT international symposium on Foundations of software engineering
SIGSOFT '98/FSE-6, Volume 23 Issue 6, November 1998.
52. “Anchoring and Adjustment in Software Estimation,” Jorge Aranda and Steve
Easterbrook, Proceedings of the 10th European software engineering
conference held jointly with 13th ACM SIGSOFT international symposium on
Foundations of software engineering ESEC/FSE-13
53. “The Monte Carlo Method,” W. F. Bauer, Journal of the Society of Industrial
Mathematics, Volume 6, Number 4, December 1958,
http://www.cs.fsu.edu/~mascagni/Bauer_1959_Journal_SIAM.pdf.
54. “A Retrospective and Prospective Survey of the Monte Carlo Method,” John
H. Molton, SIAM Journal, Volume 12, Number 1, January 1970,
http://www.cs.fsu.edu/~mascagni/Halton_SIAM_Review_1970.pdf.
Resources