Downloaded 11 times


![Example of Traditional Method of
Forecasting EAC and ECD
26
The Plan: Twelve
month effort for $36K
The Performance at
status date (5/31/2015):
BCWScum = $15K
ACWPcum = $18K
BCWPcum = $12.5K
SPIcum = .833
CPIcum = .694
ES = 124d
SPIt = .824
EAC Forecast: EACcomposite = ACWP + [(BAC-BCWPcum)/(CPIcum × SPIcum)] = $58.6K
ECD Forecast Duration: Status Duration +( PD-ES)/SPIt = 150d + (366-124)/.824 = 444d
ECD Forecast Date: Date Format of (42005+444) = 3/19/2016
Value: Tells PM the final cost and delivery date IF the contractor continues to perform
exactly as it has done in the past (rearward focus). Facilitates problem diagnosis and
discussions with the contractor.
23](https://image.slidesharecdn.com/alleman-coonce-essentialviewsofipmrs-2015may11-190423170056/75/Essential-views-of-the-IPMR-26-2048.jpg)


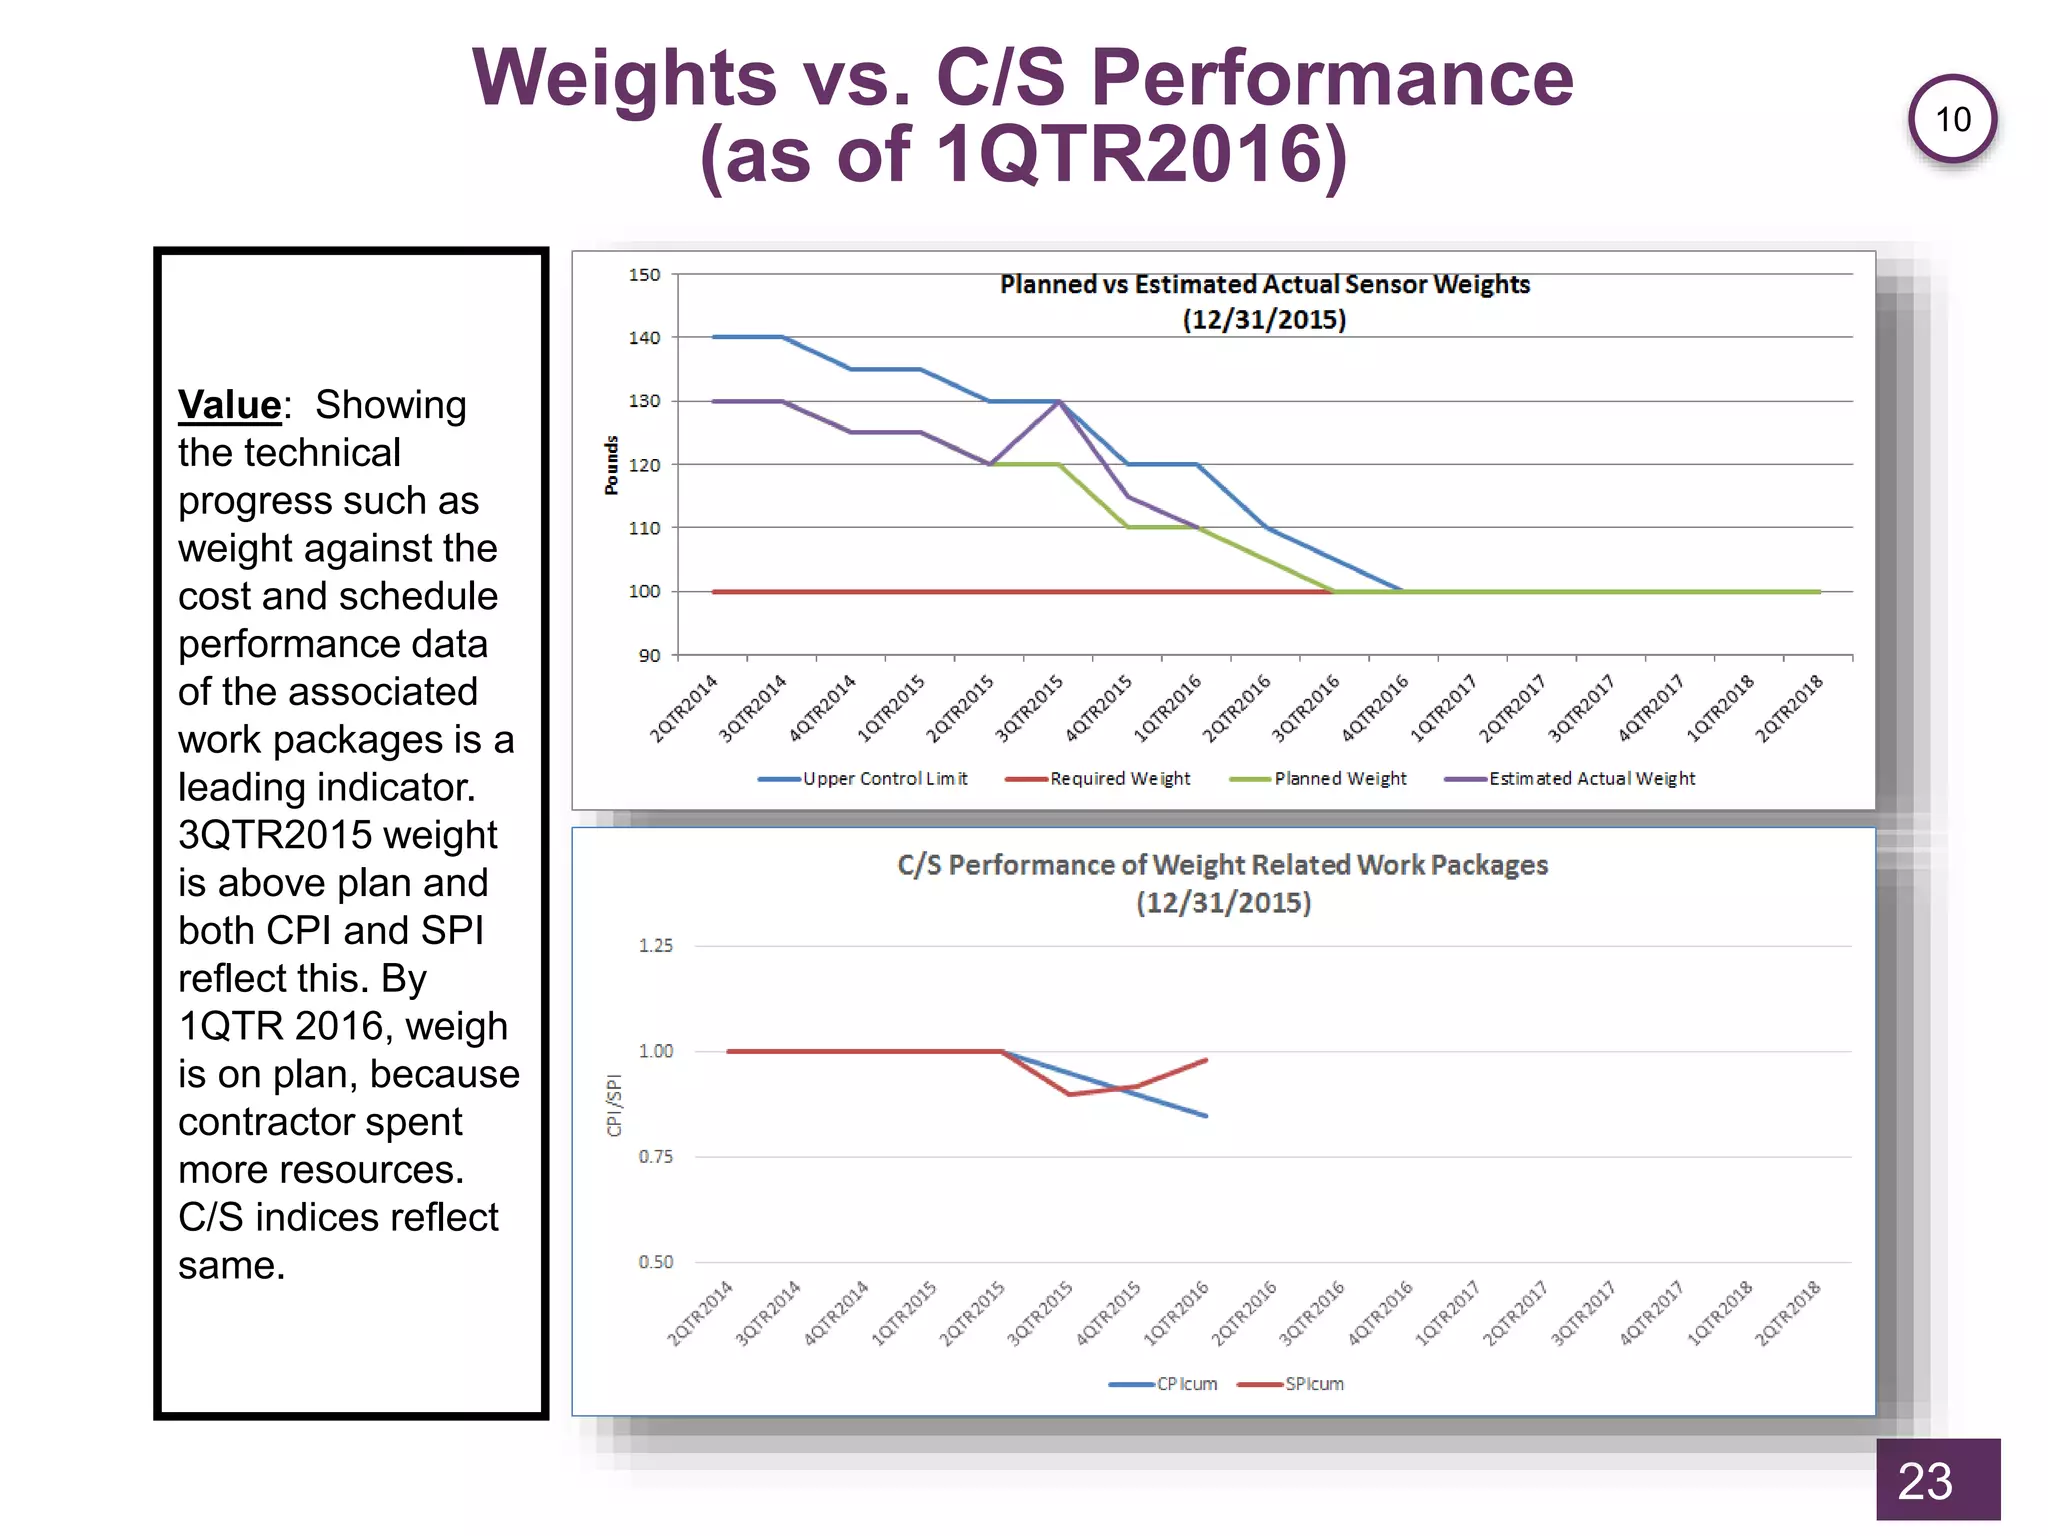
The document discusses the essential views of integrated program management reports, highlighting metrics necessary for Department of Defense acquisition contractors to monitor program status effectively. It proposes twenty-five specific metrics, twelve of which are detailed, aimed at facilitating proactive management and risk mitigation. Additionally, it outlines a six-step process for establishing a credible performance management baseline and emphasizes the importance of data in managing costs, schedules, and technical performance.