Downloaded 109 times
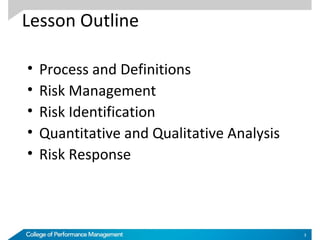
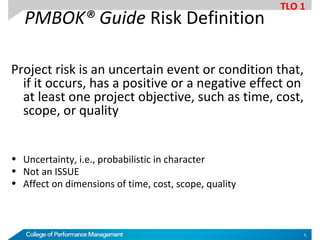

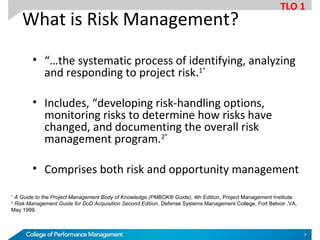
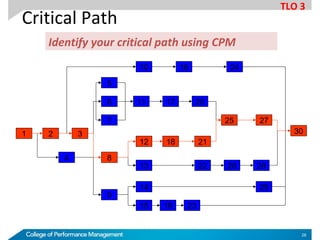
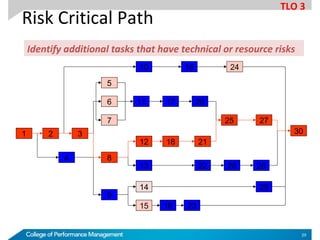
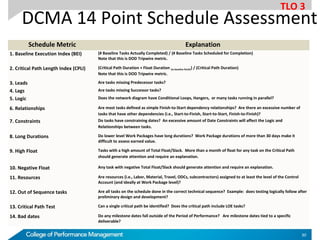
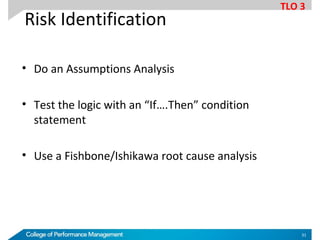
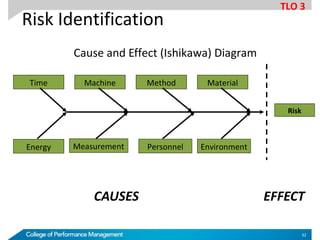
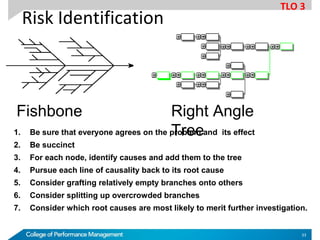
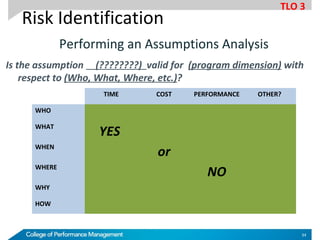
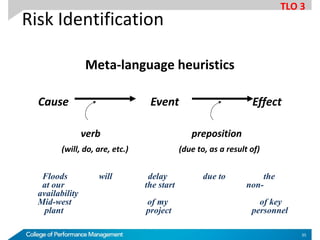
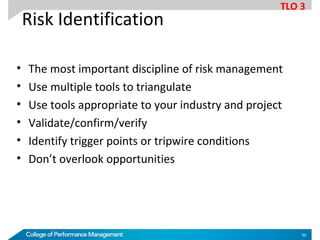
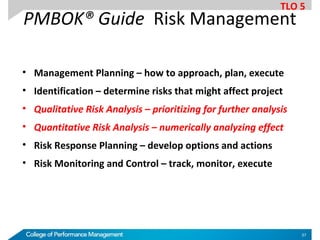
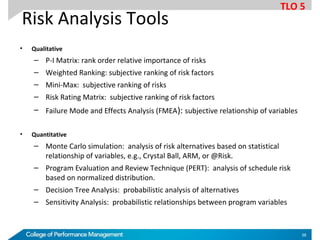
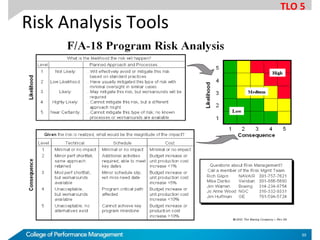
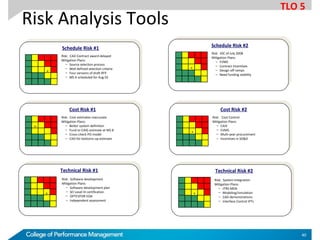
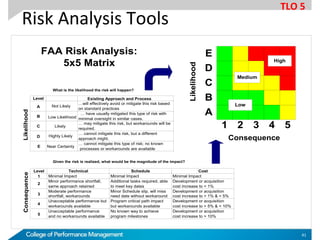
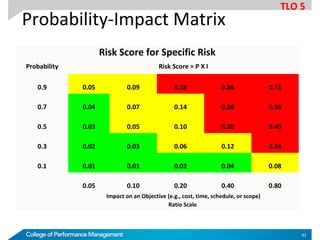
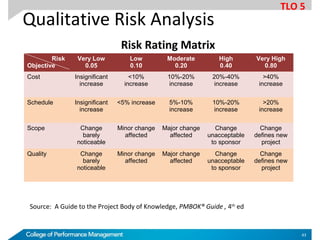

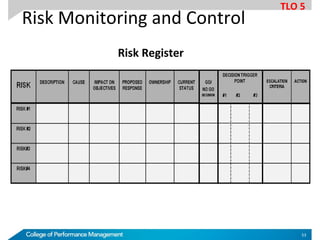
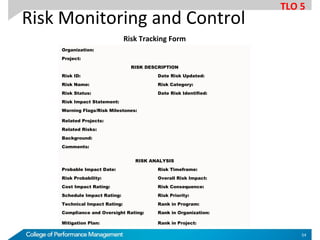

The document outlines the importance of technical risk management in projects, emphasizing the need for a systematic process that involves identifying, analyzing, and responding to risks to enhance project performance. It discusses various learning objectives related to risk management, including the development of risk management plans, identification of risks, and quantitative and qualitative analyses. Additionally, it provides insights into tools and methodologies for effective risk identification and mitigation planning.