Downloaded 234 times

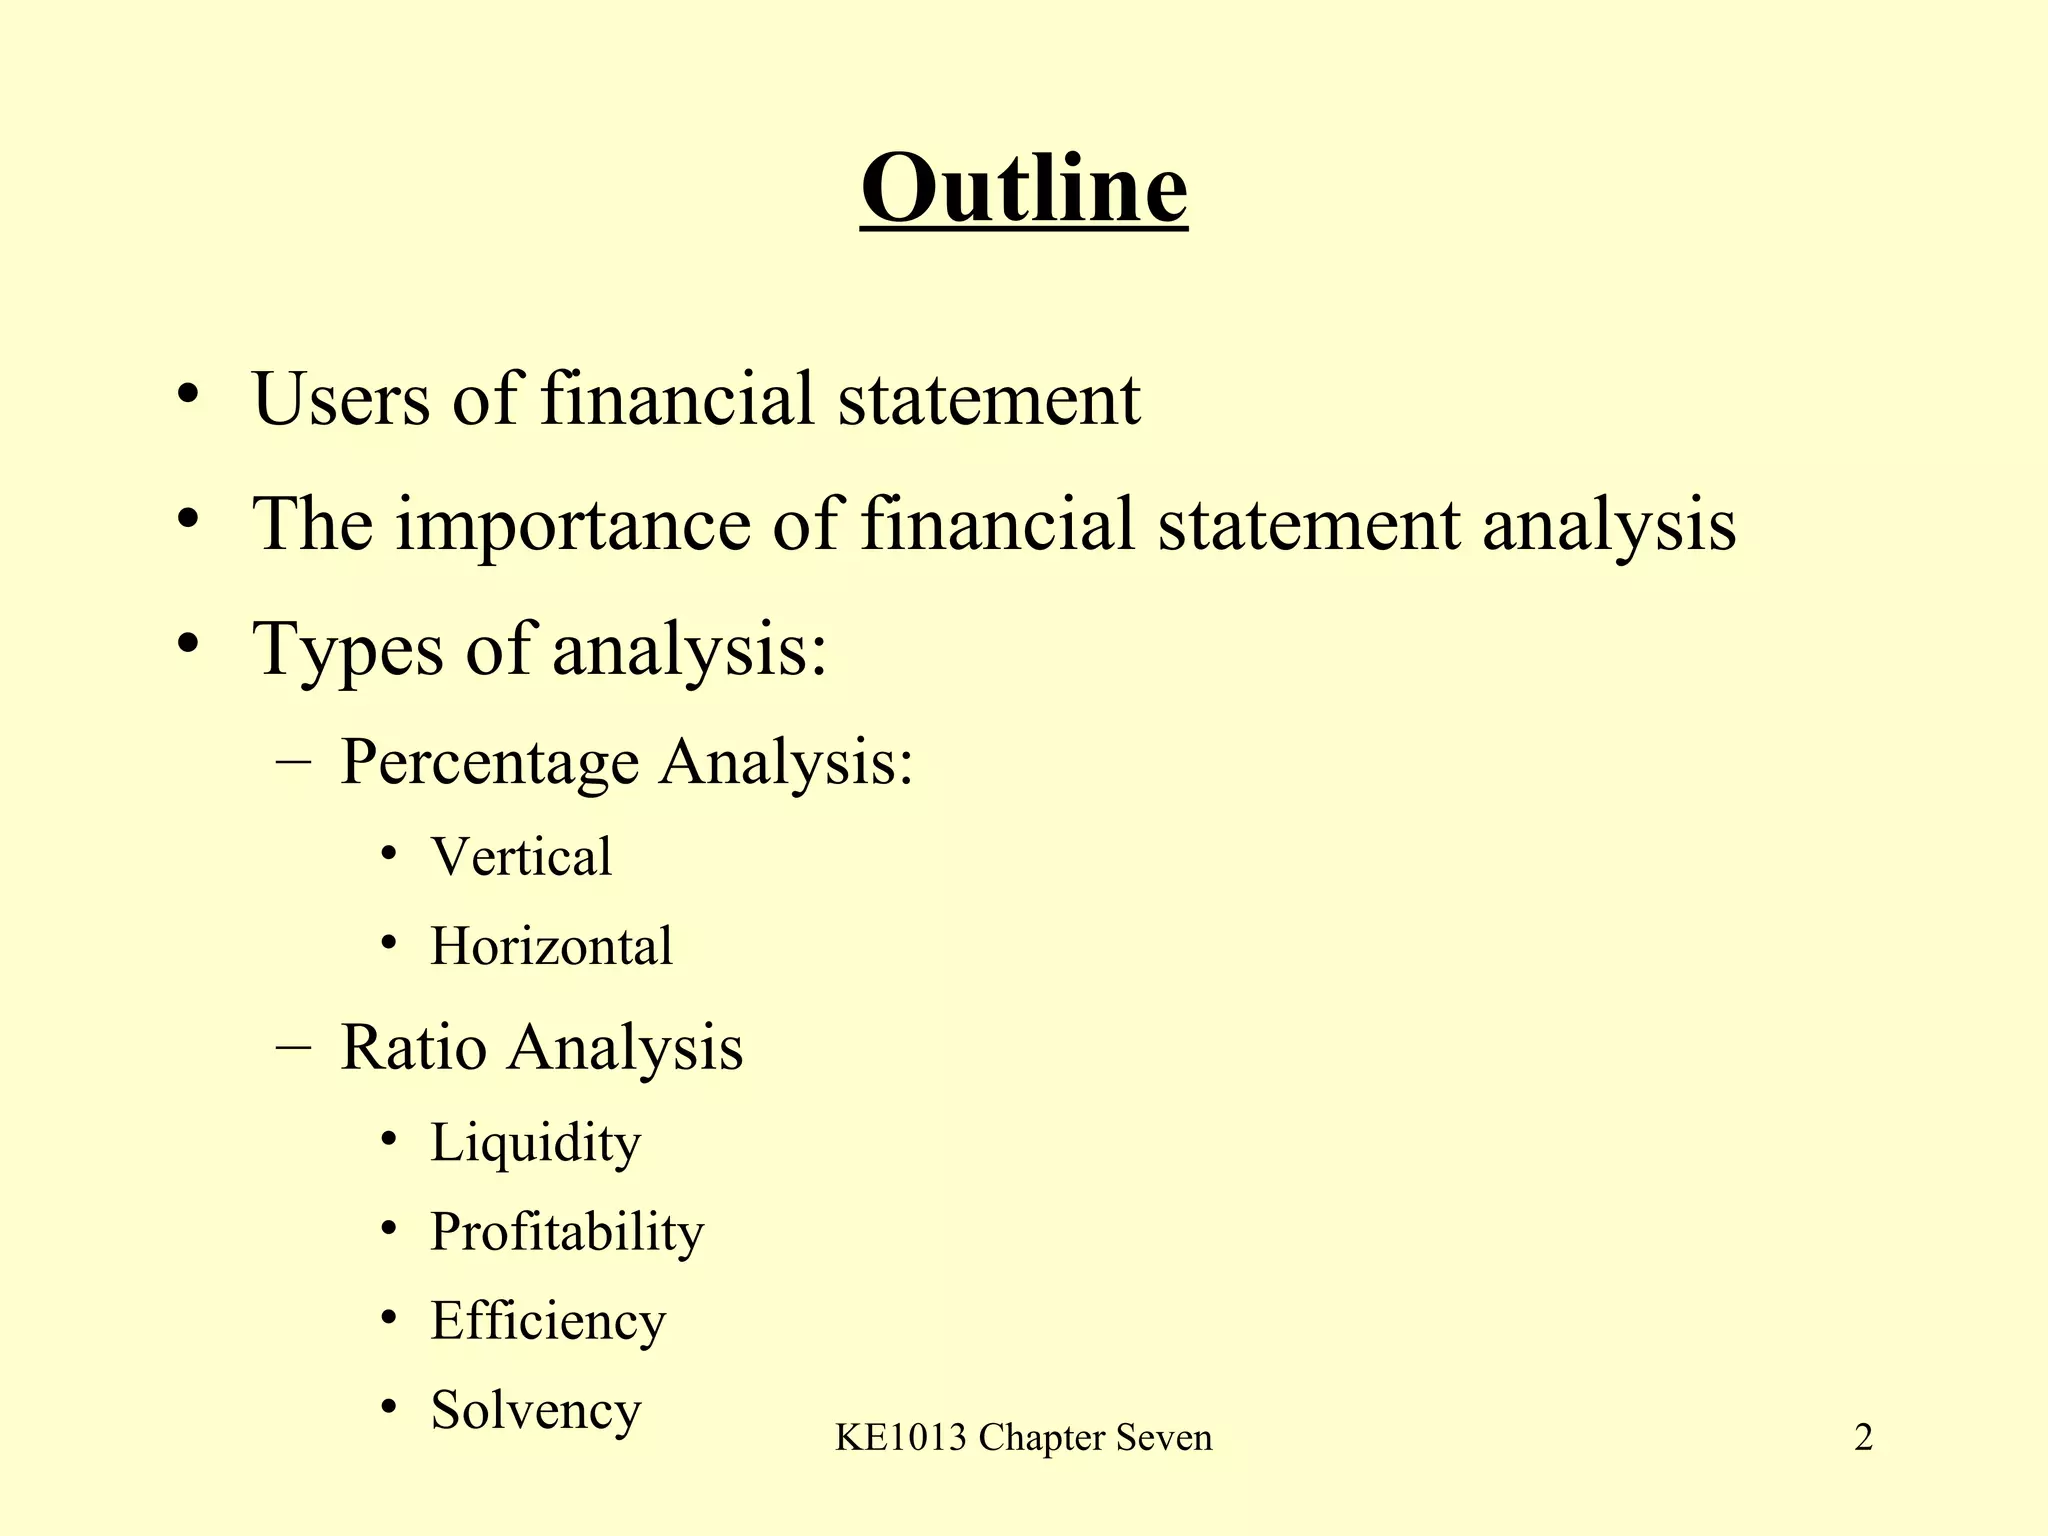
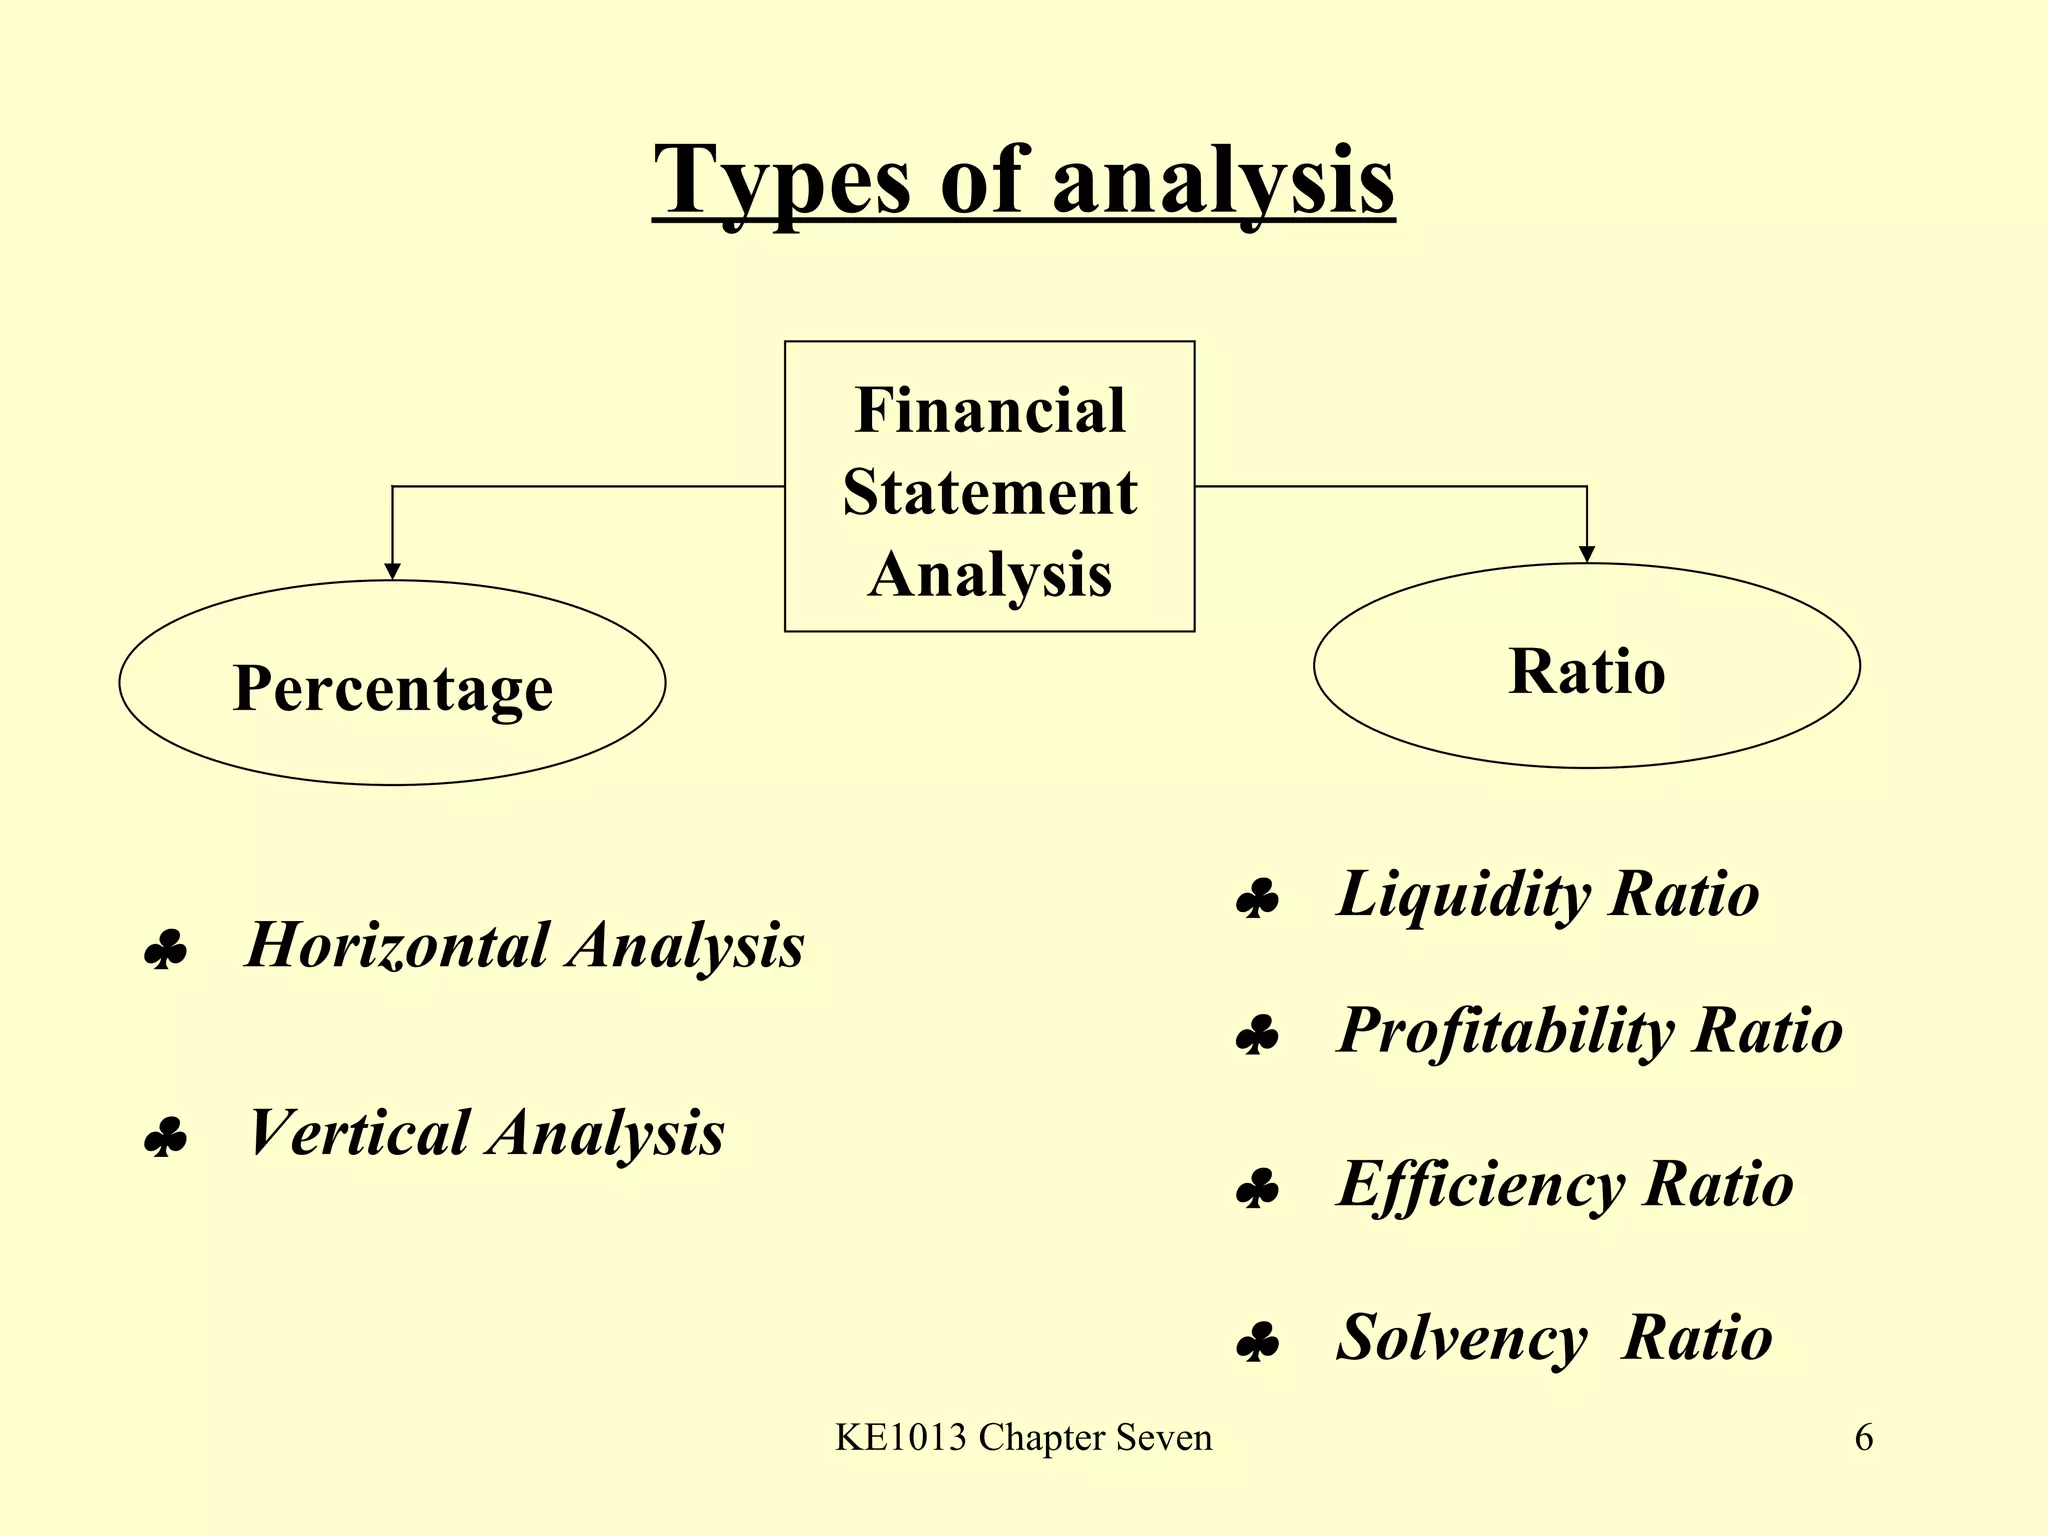
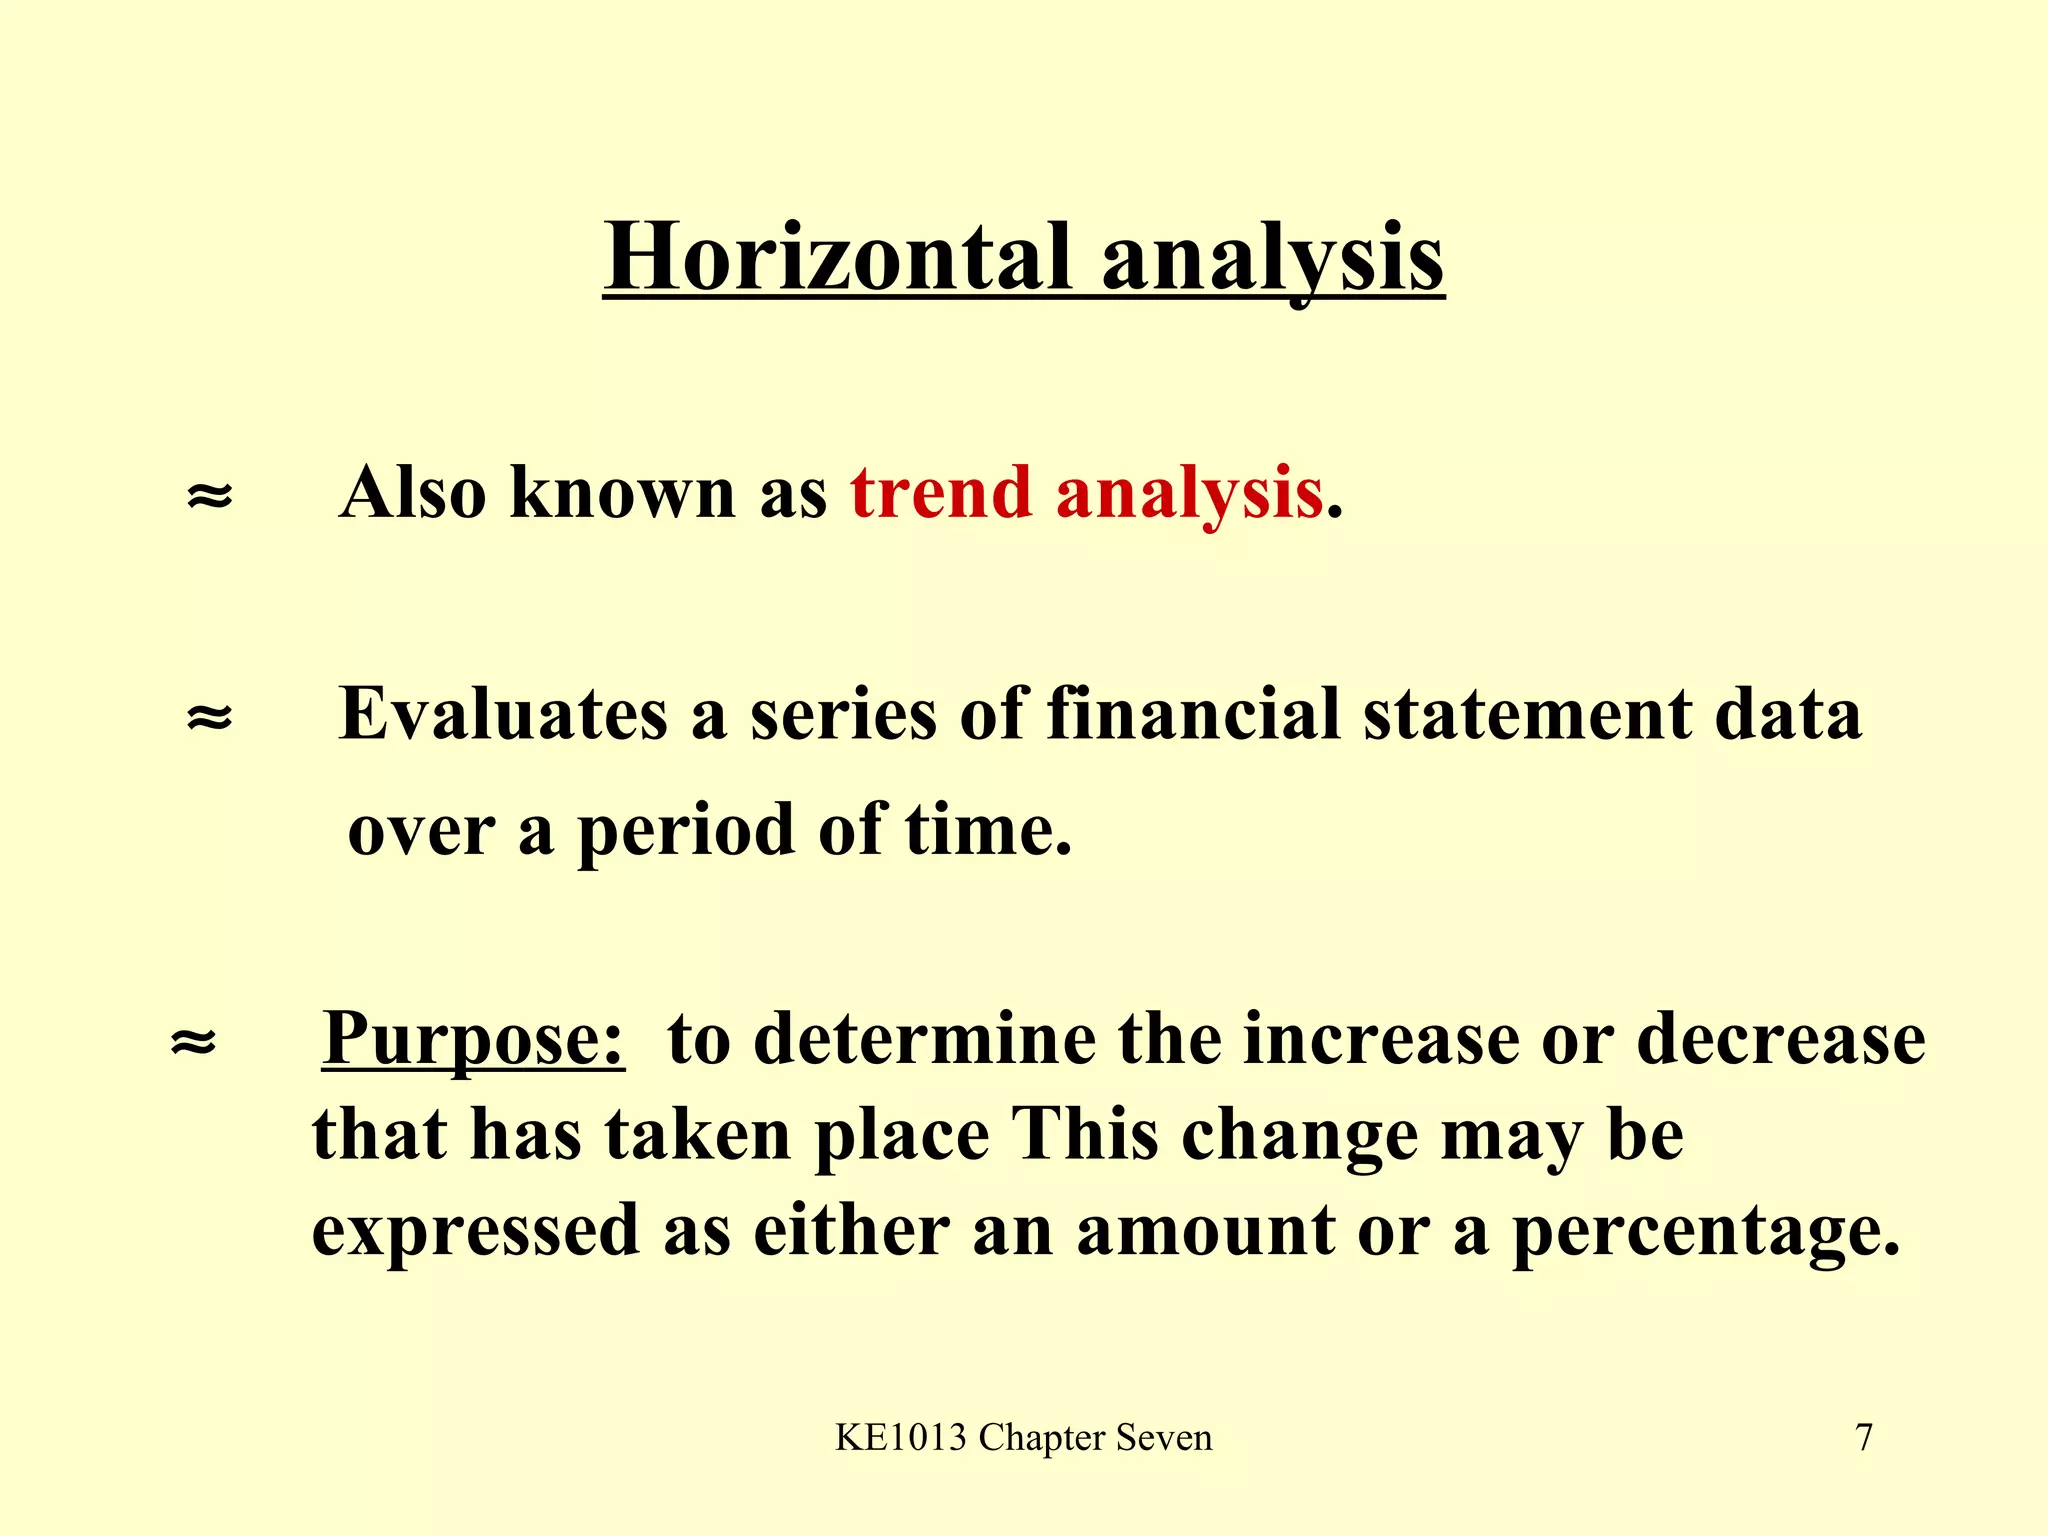
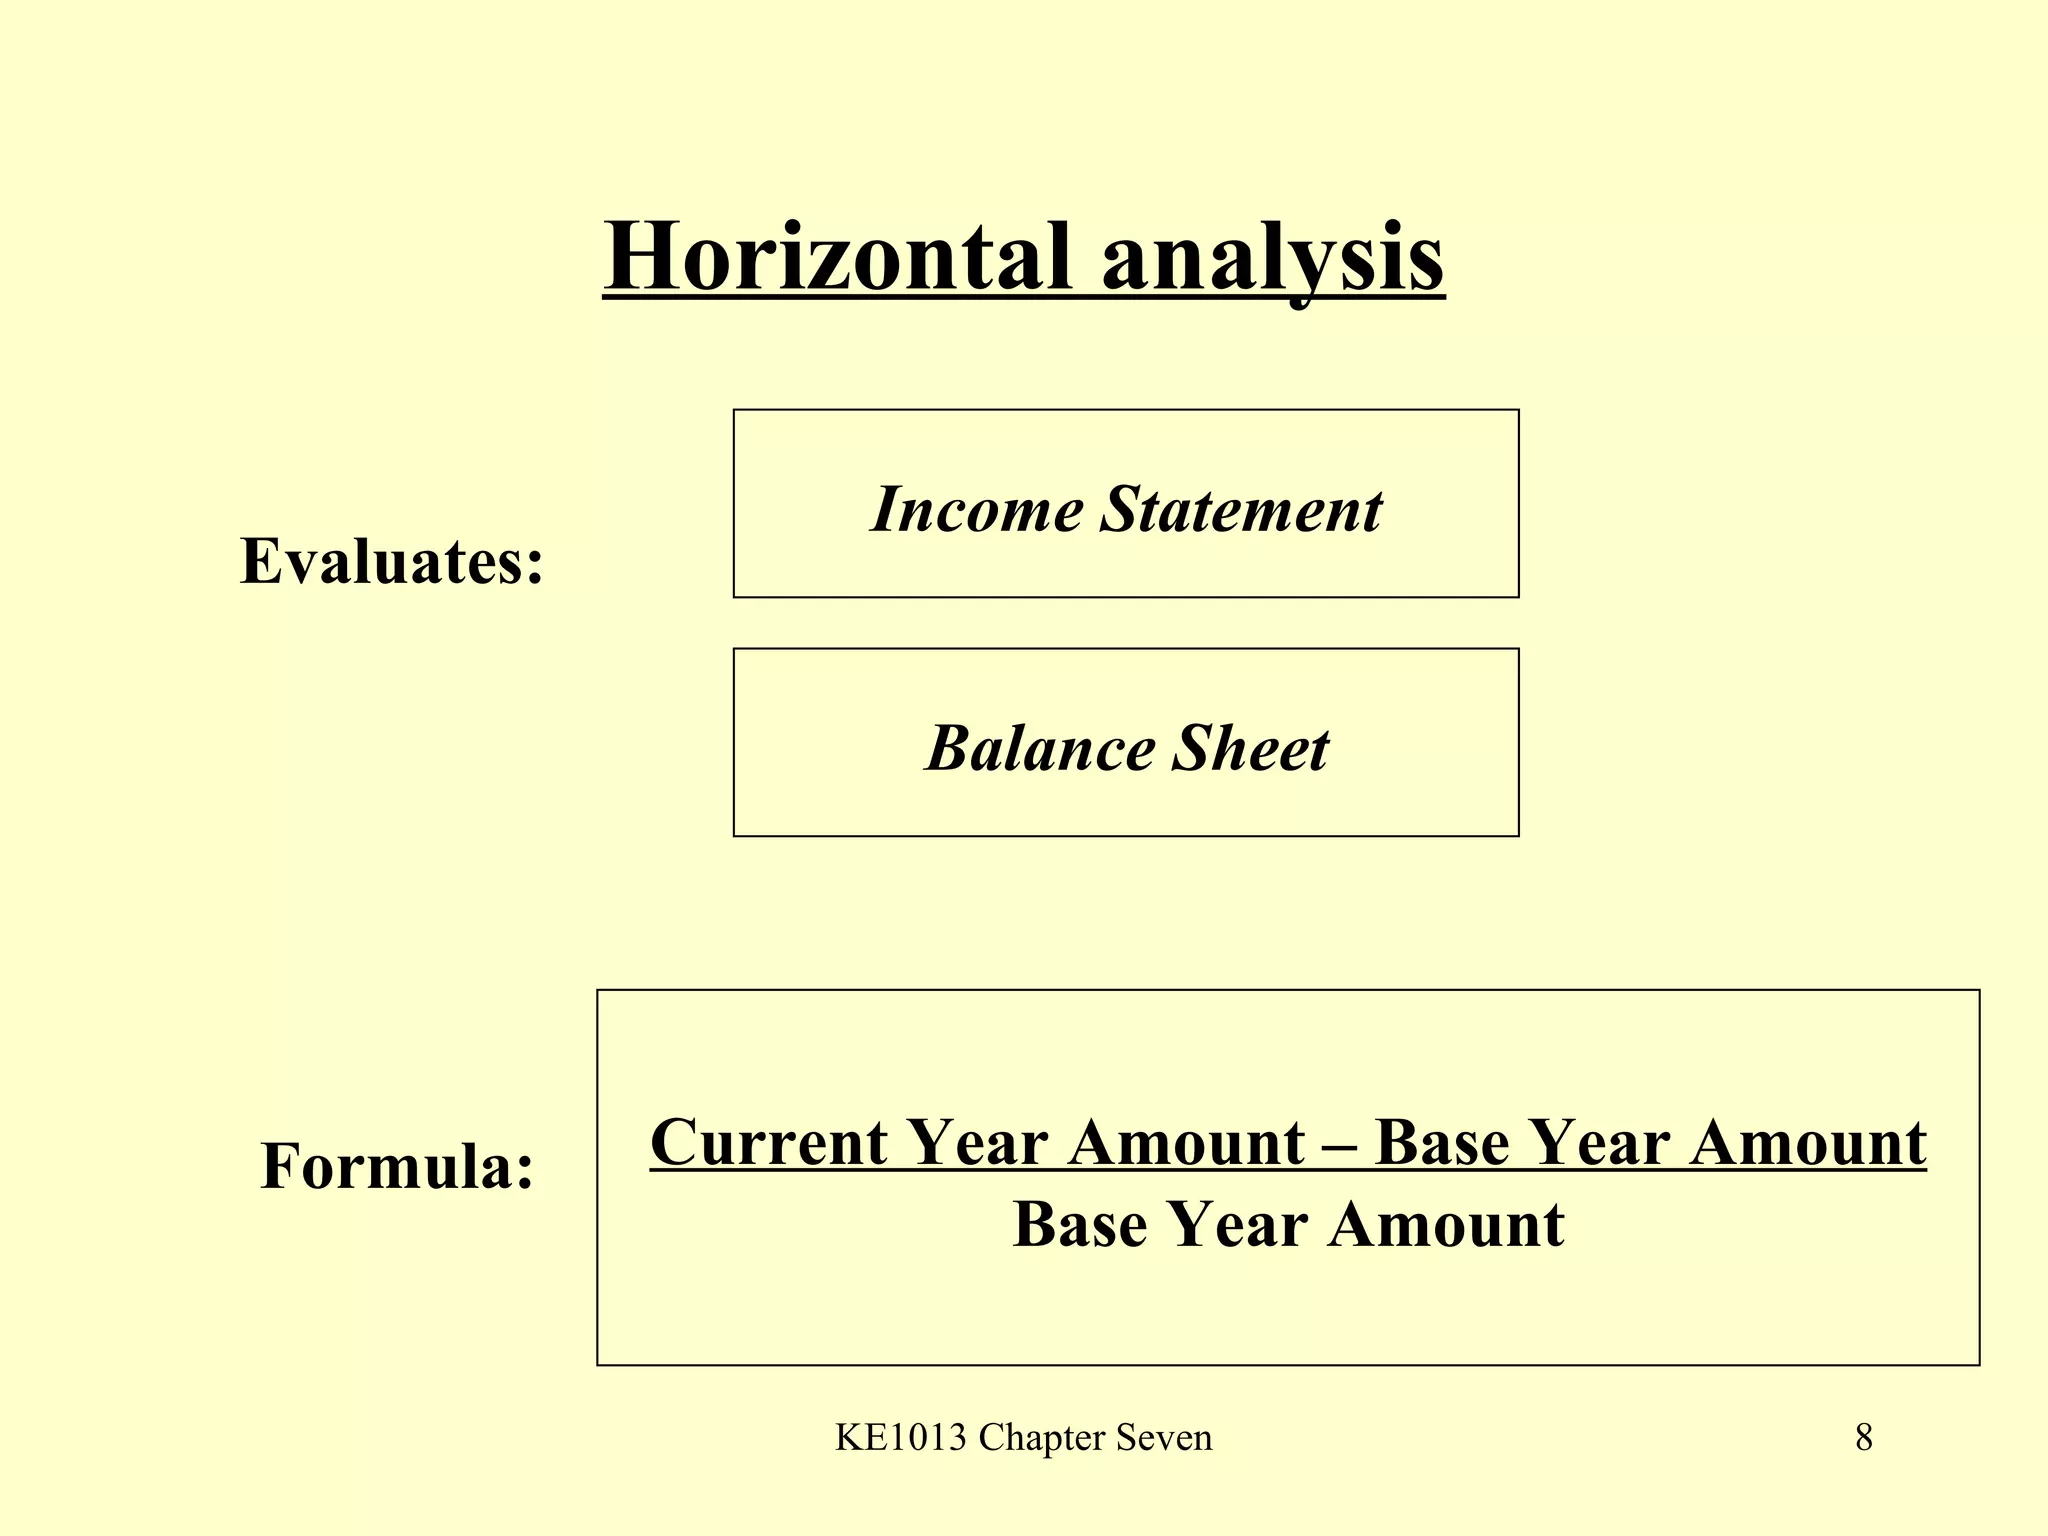
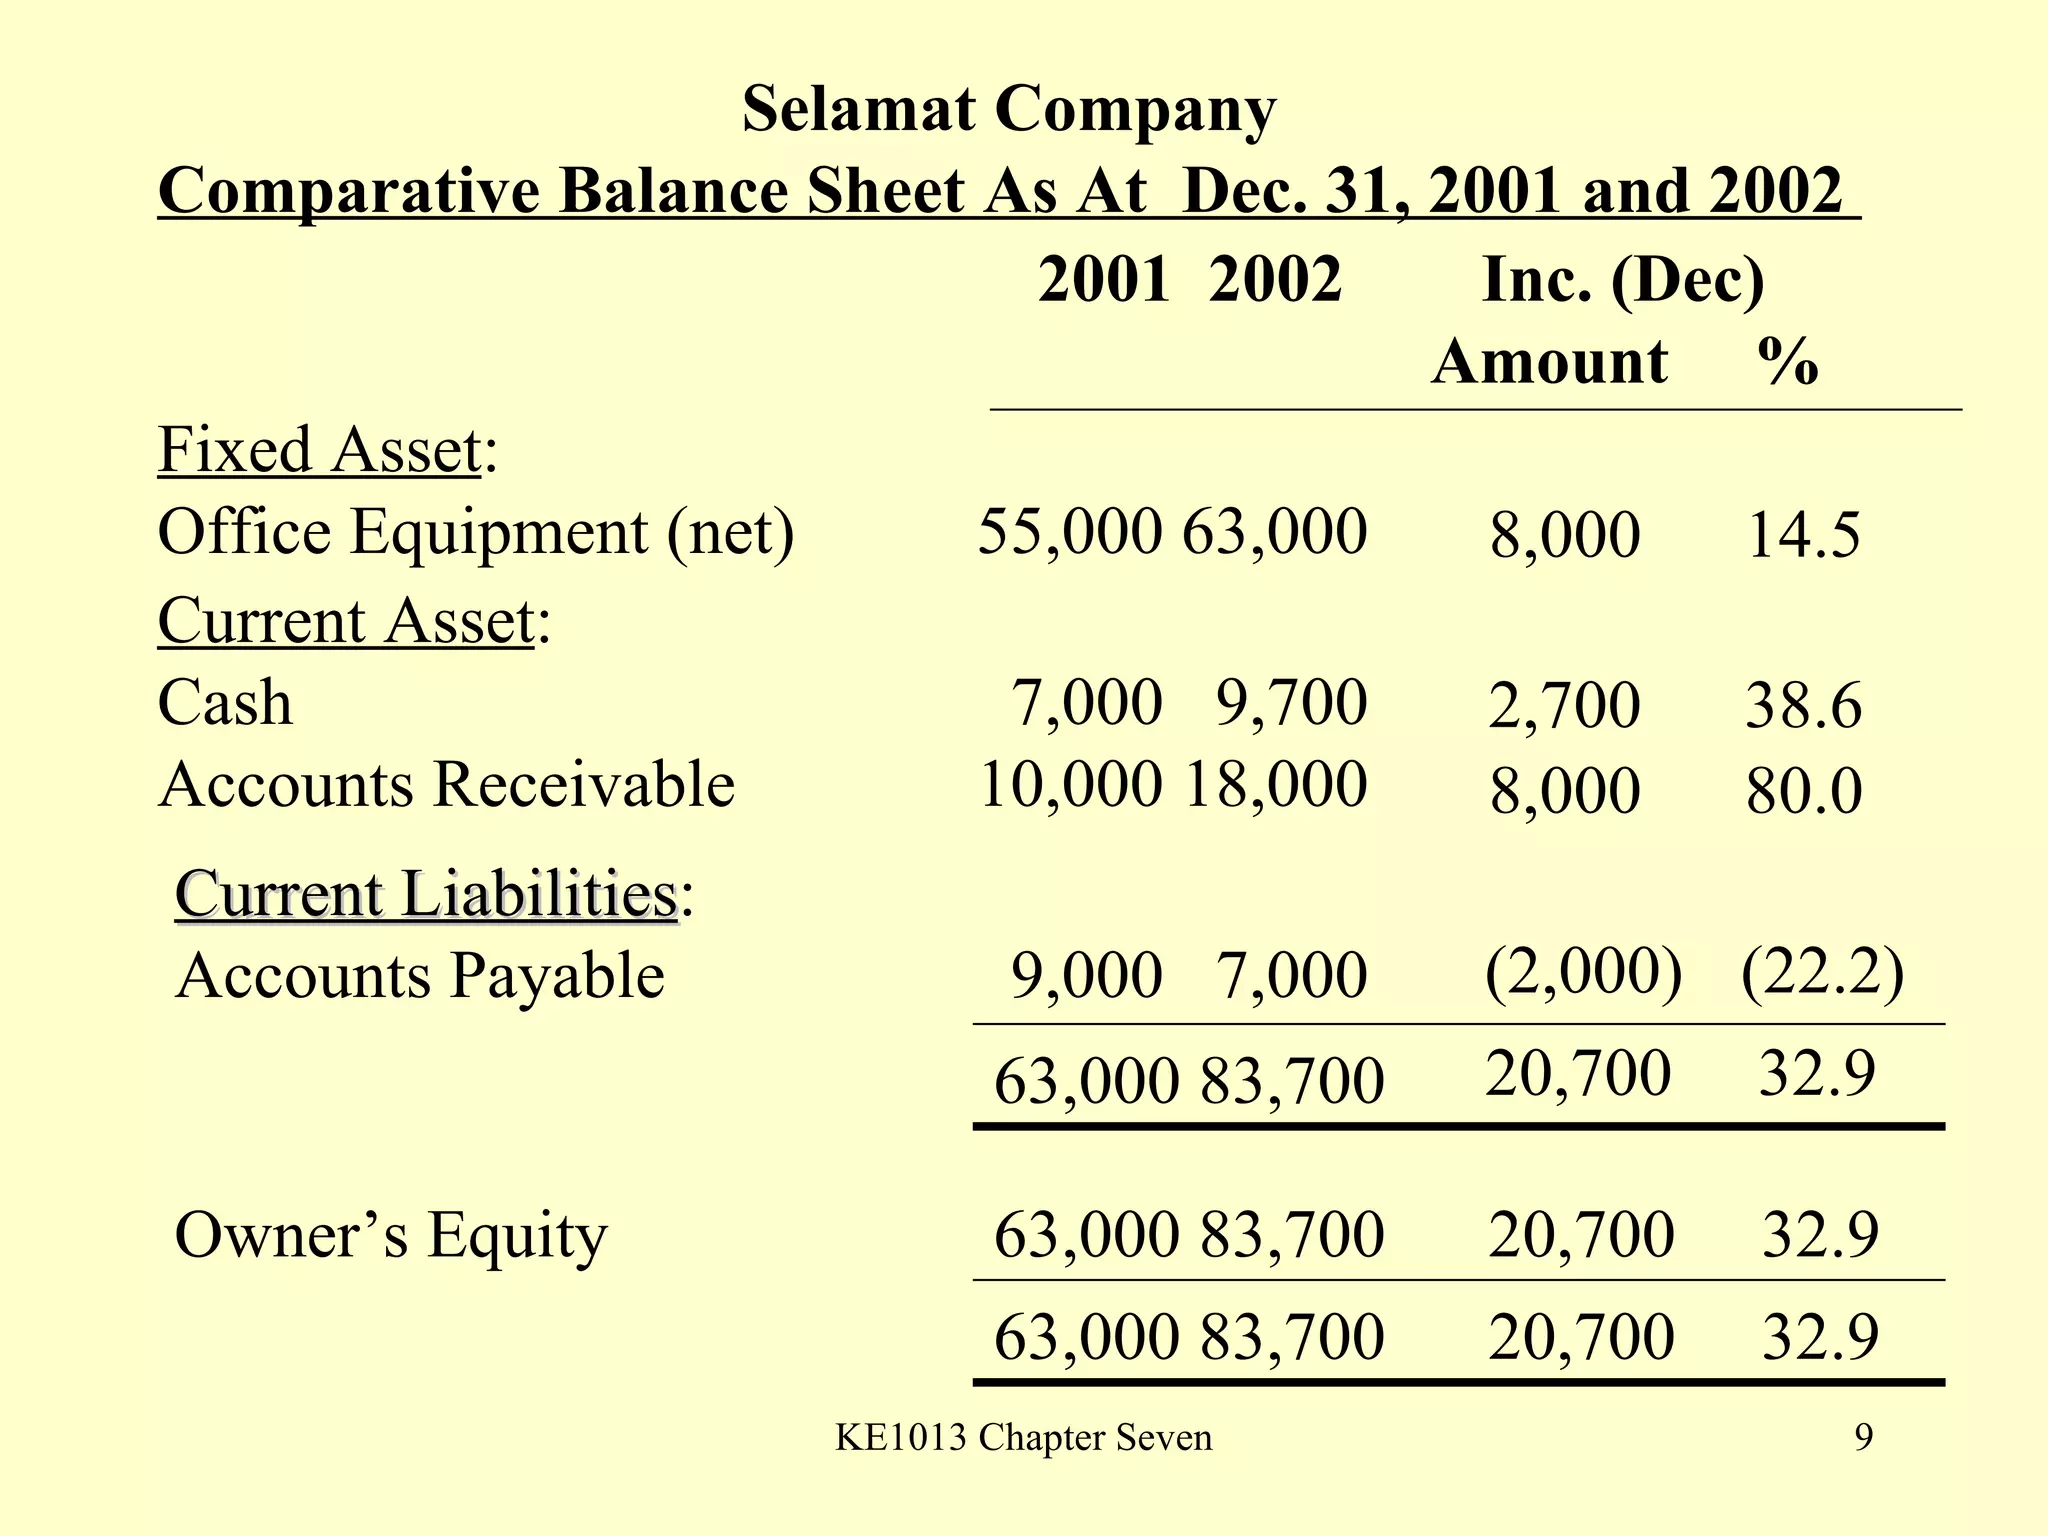
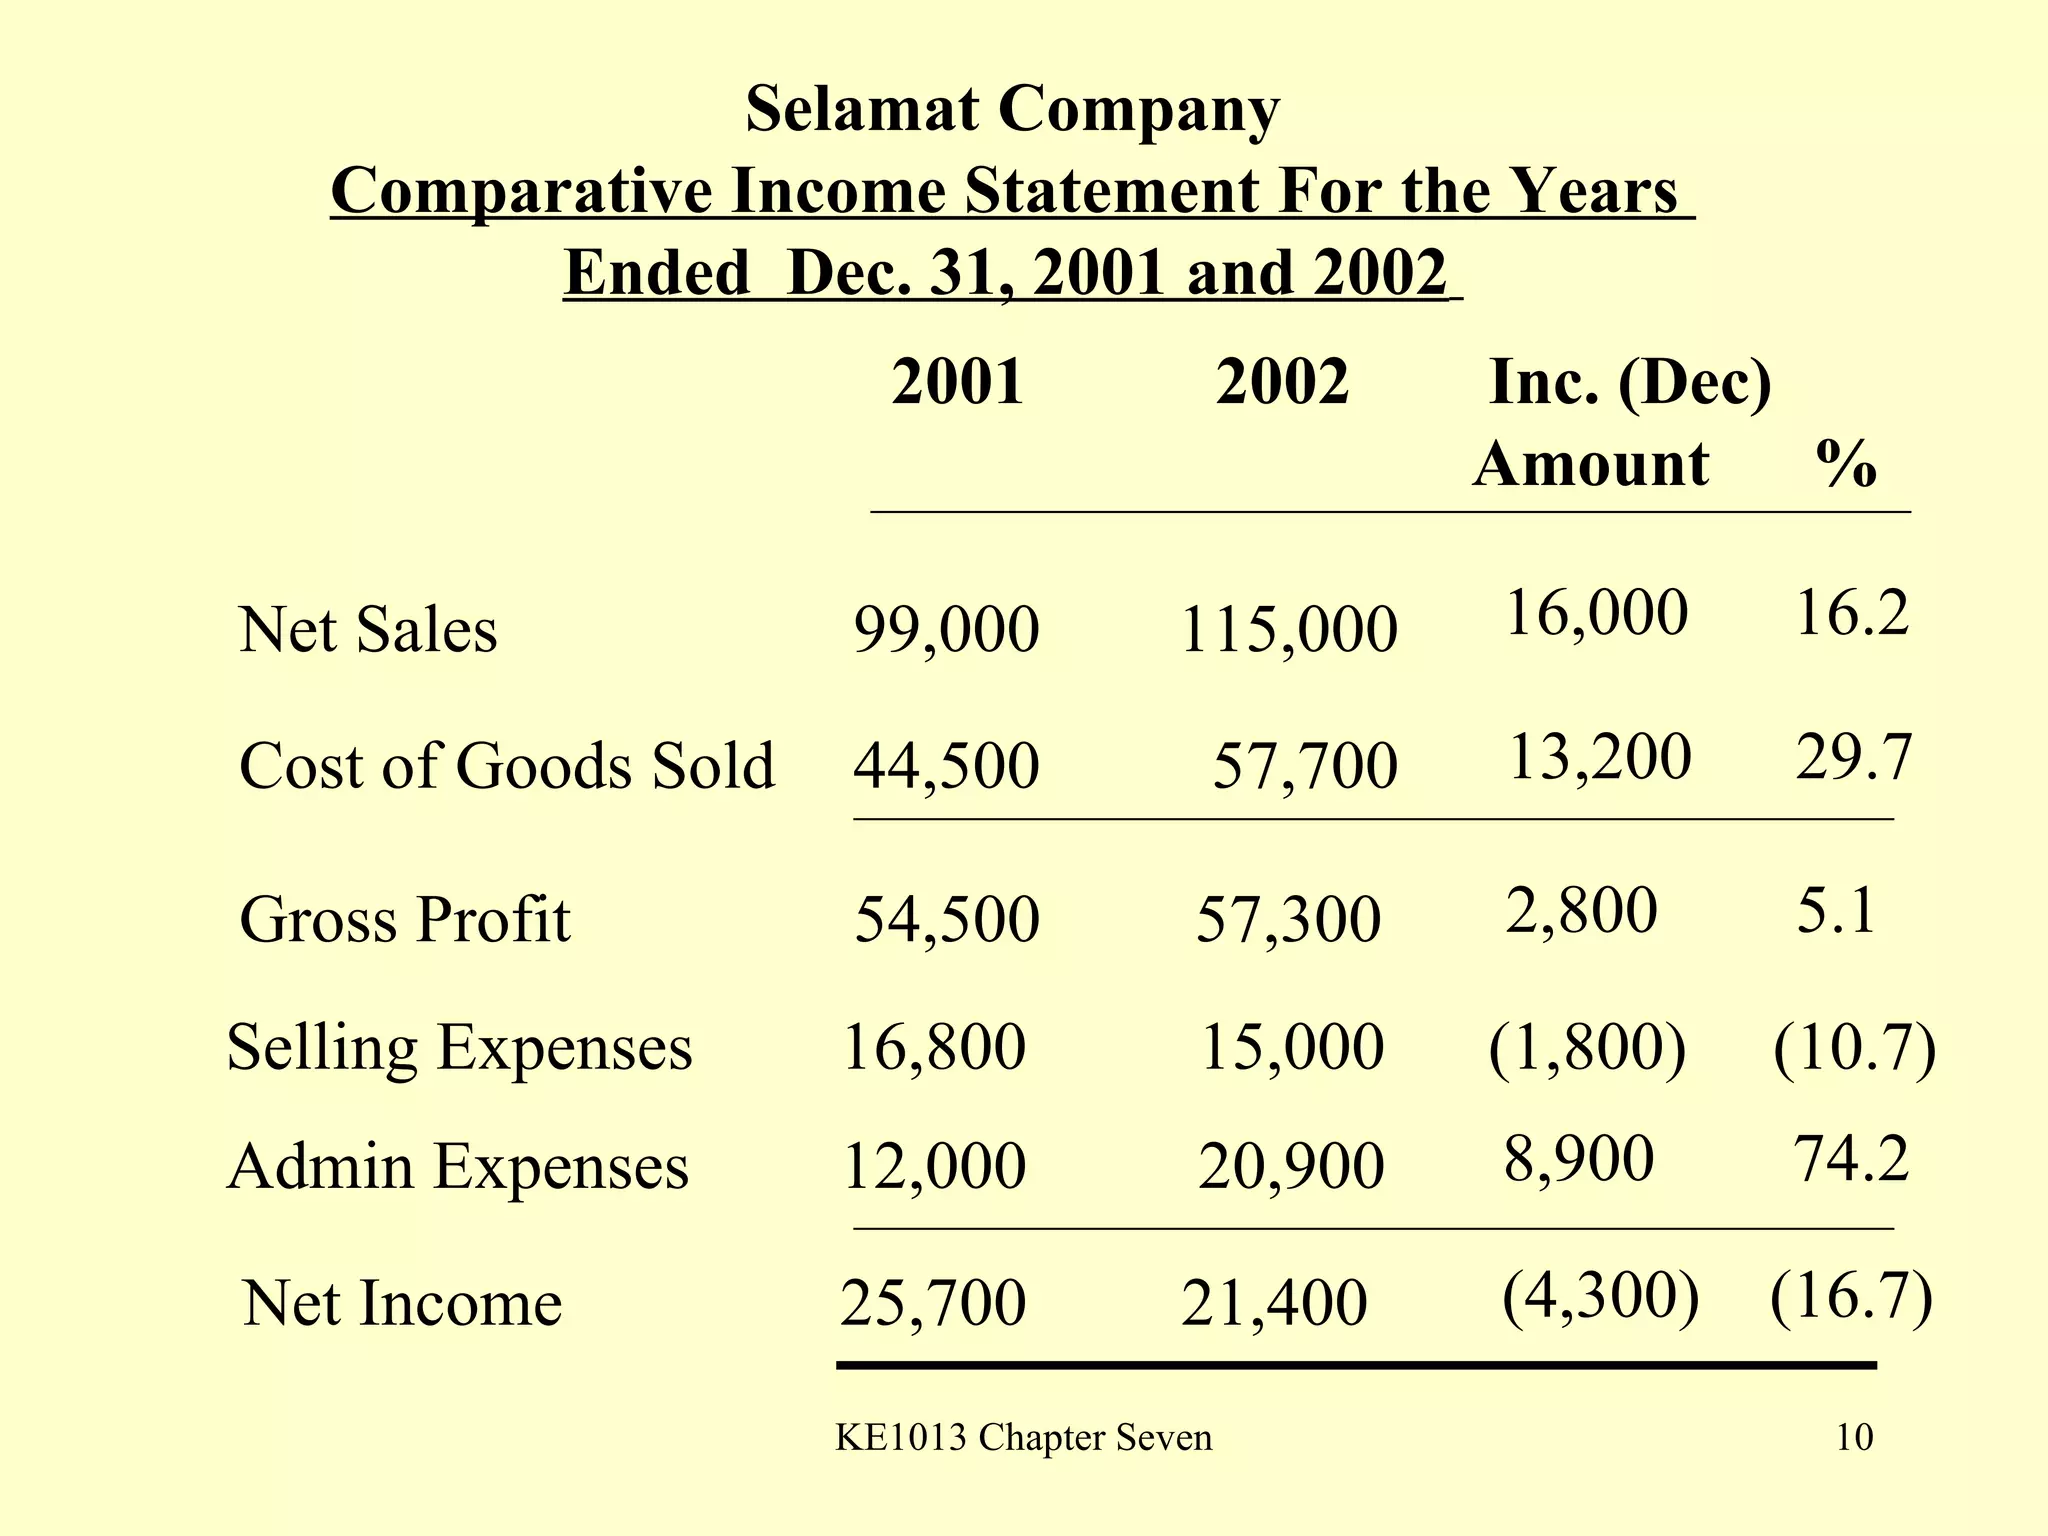
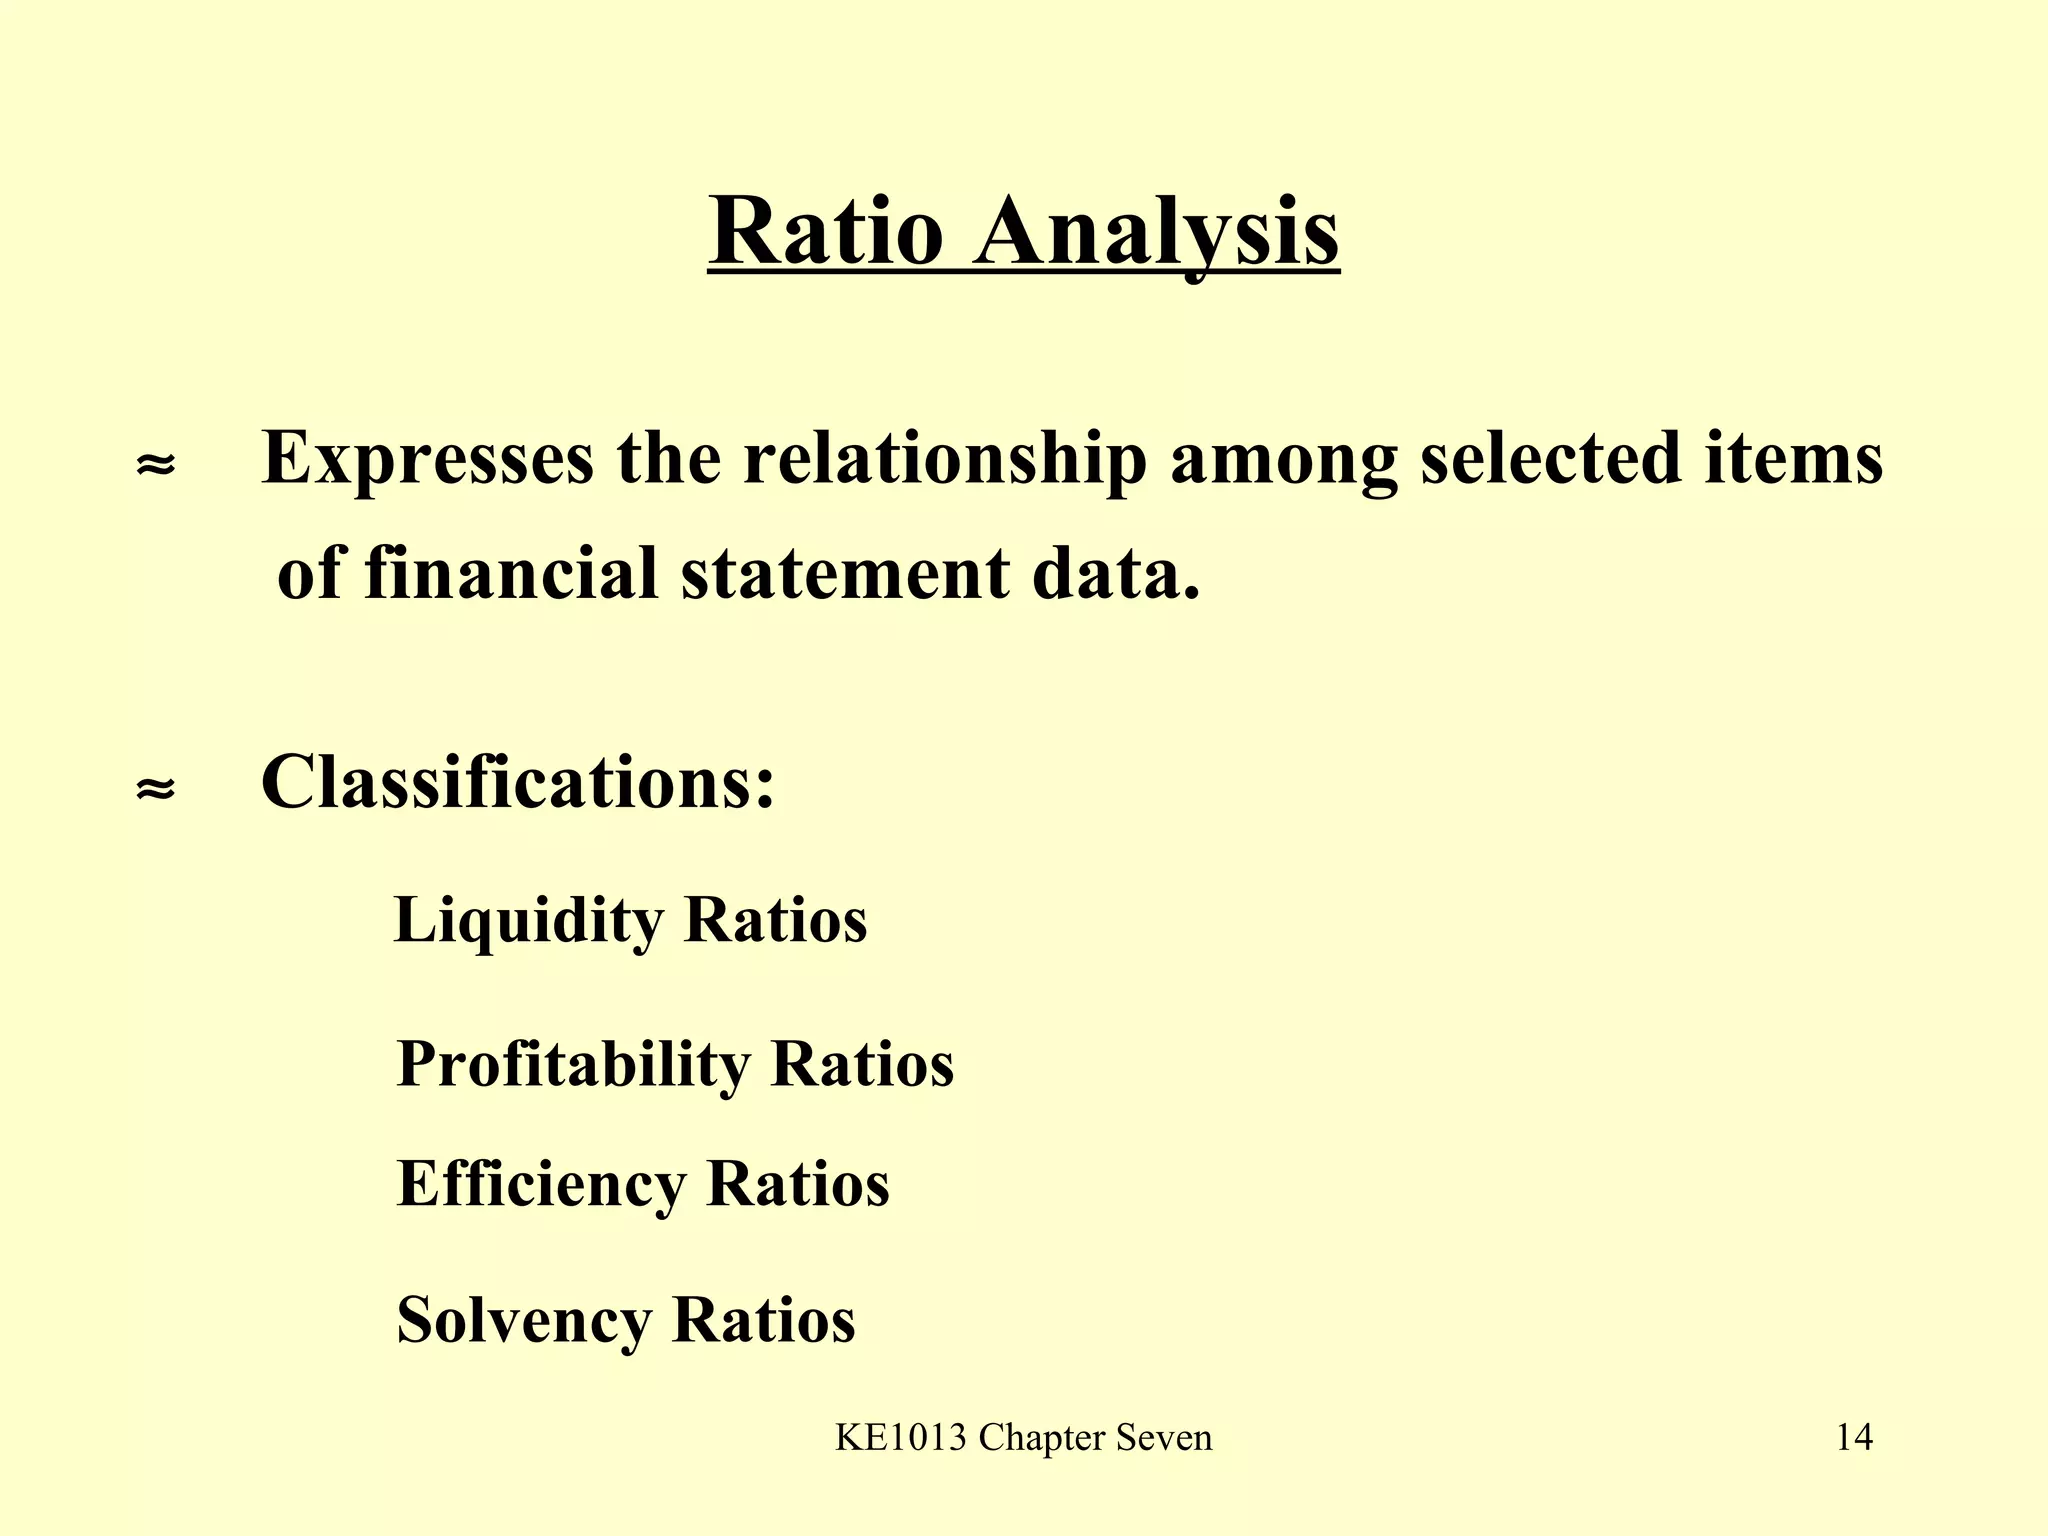
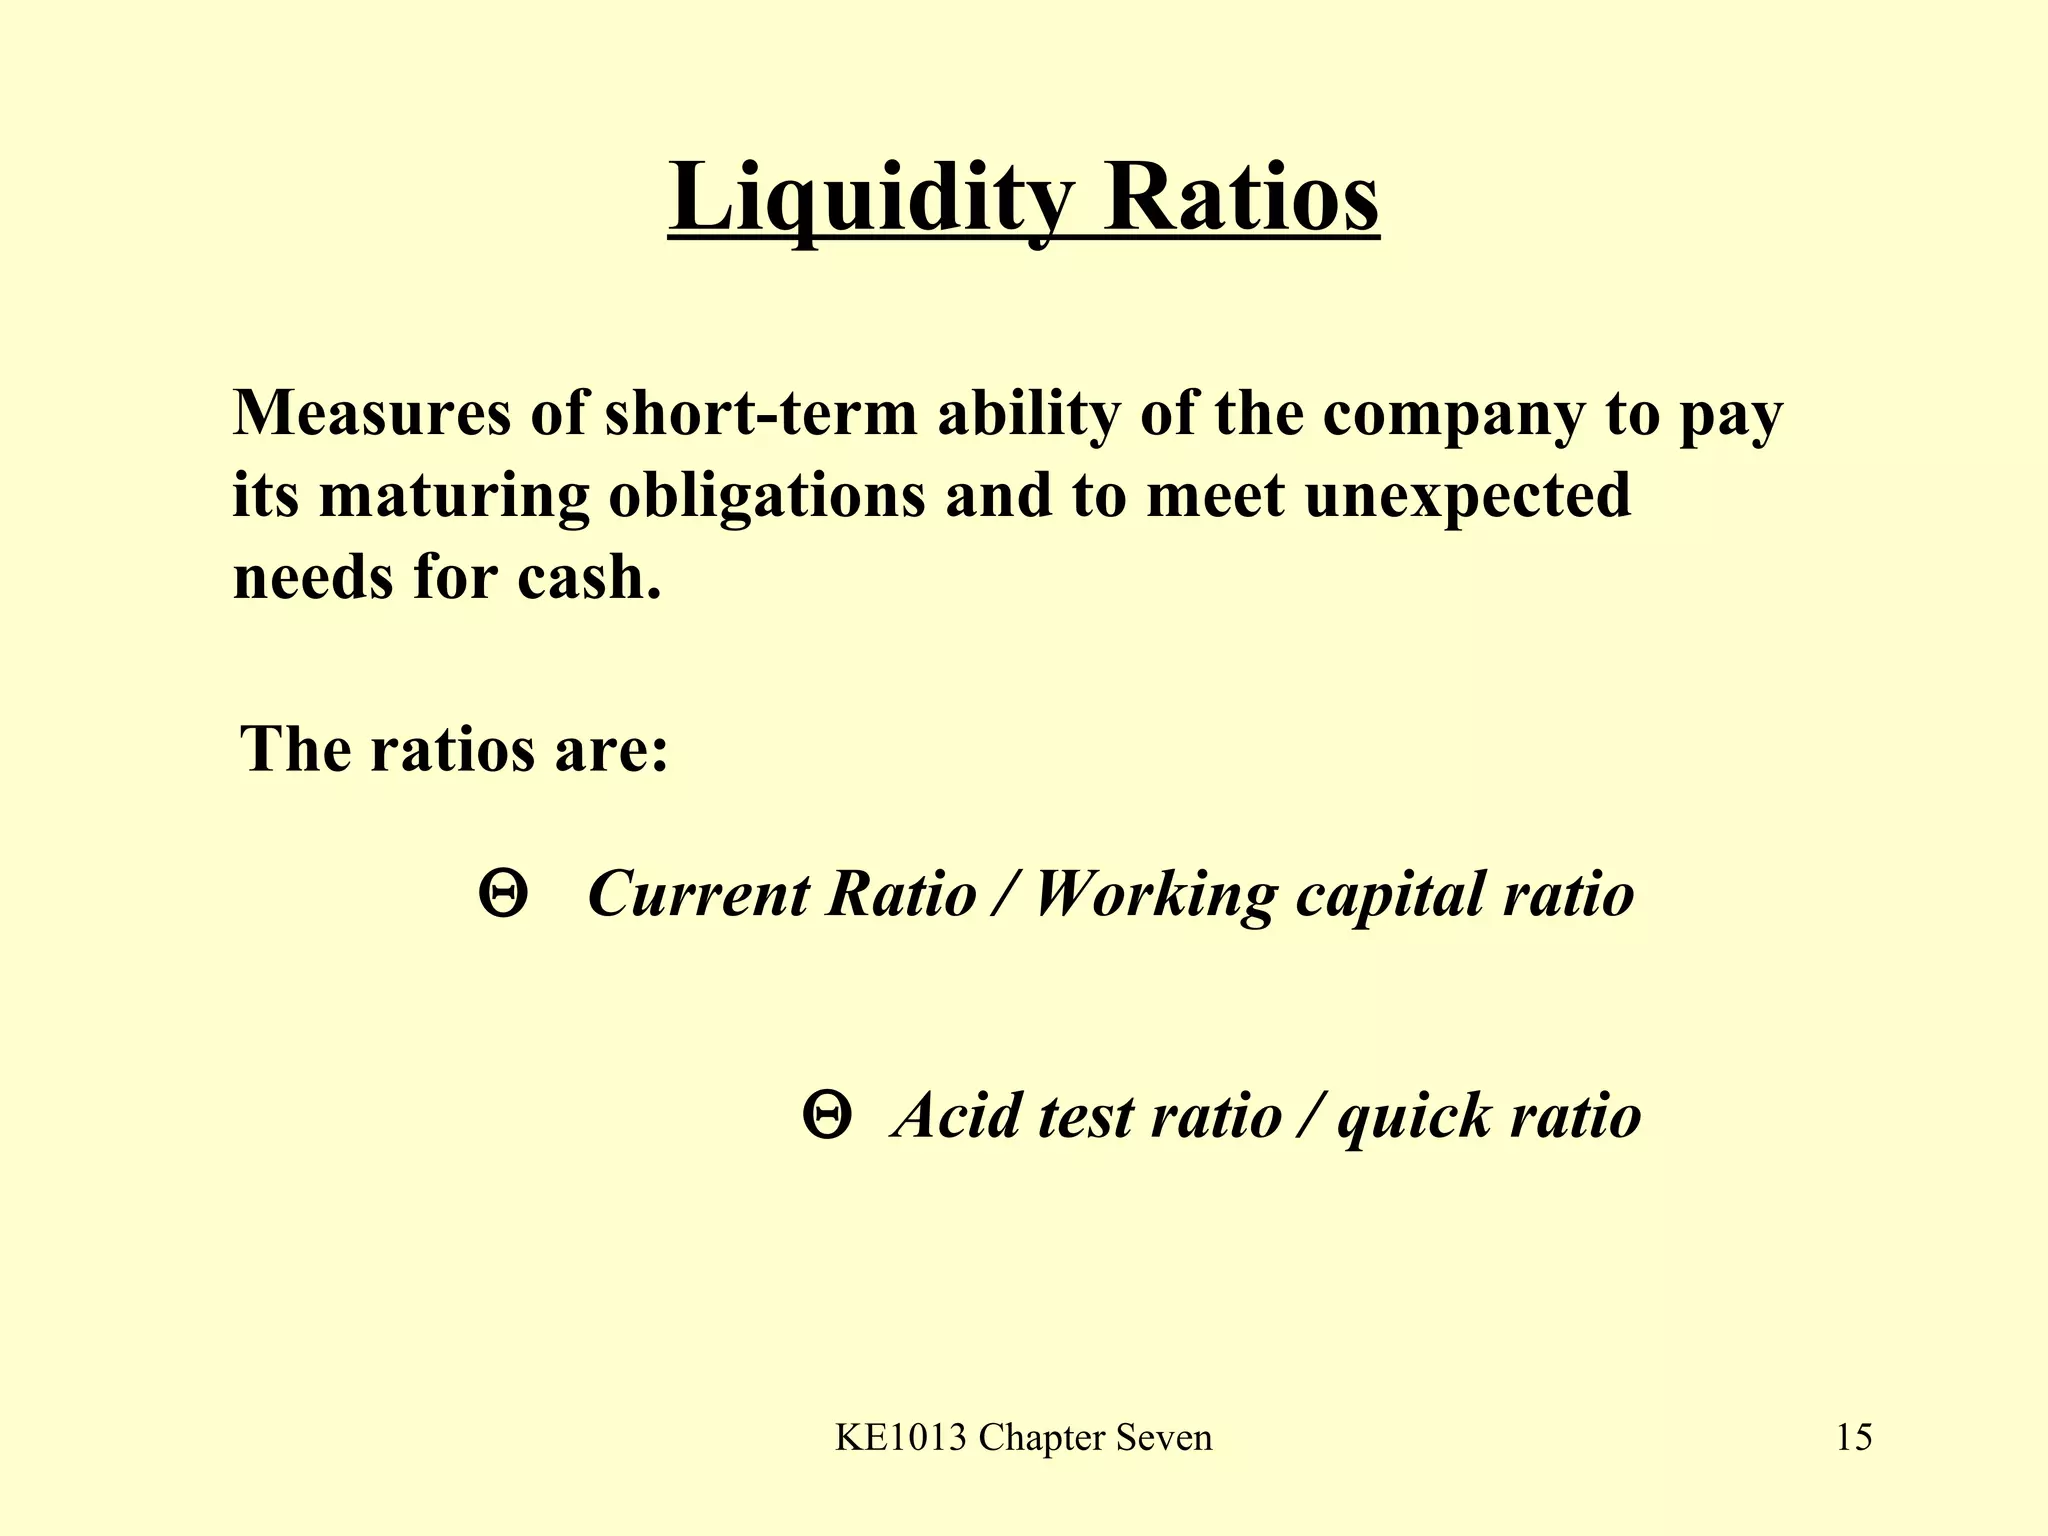
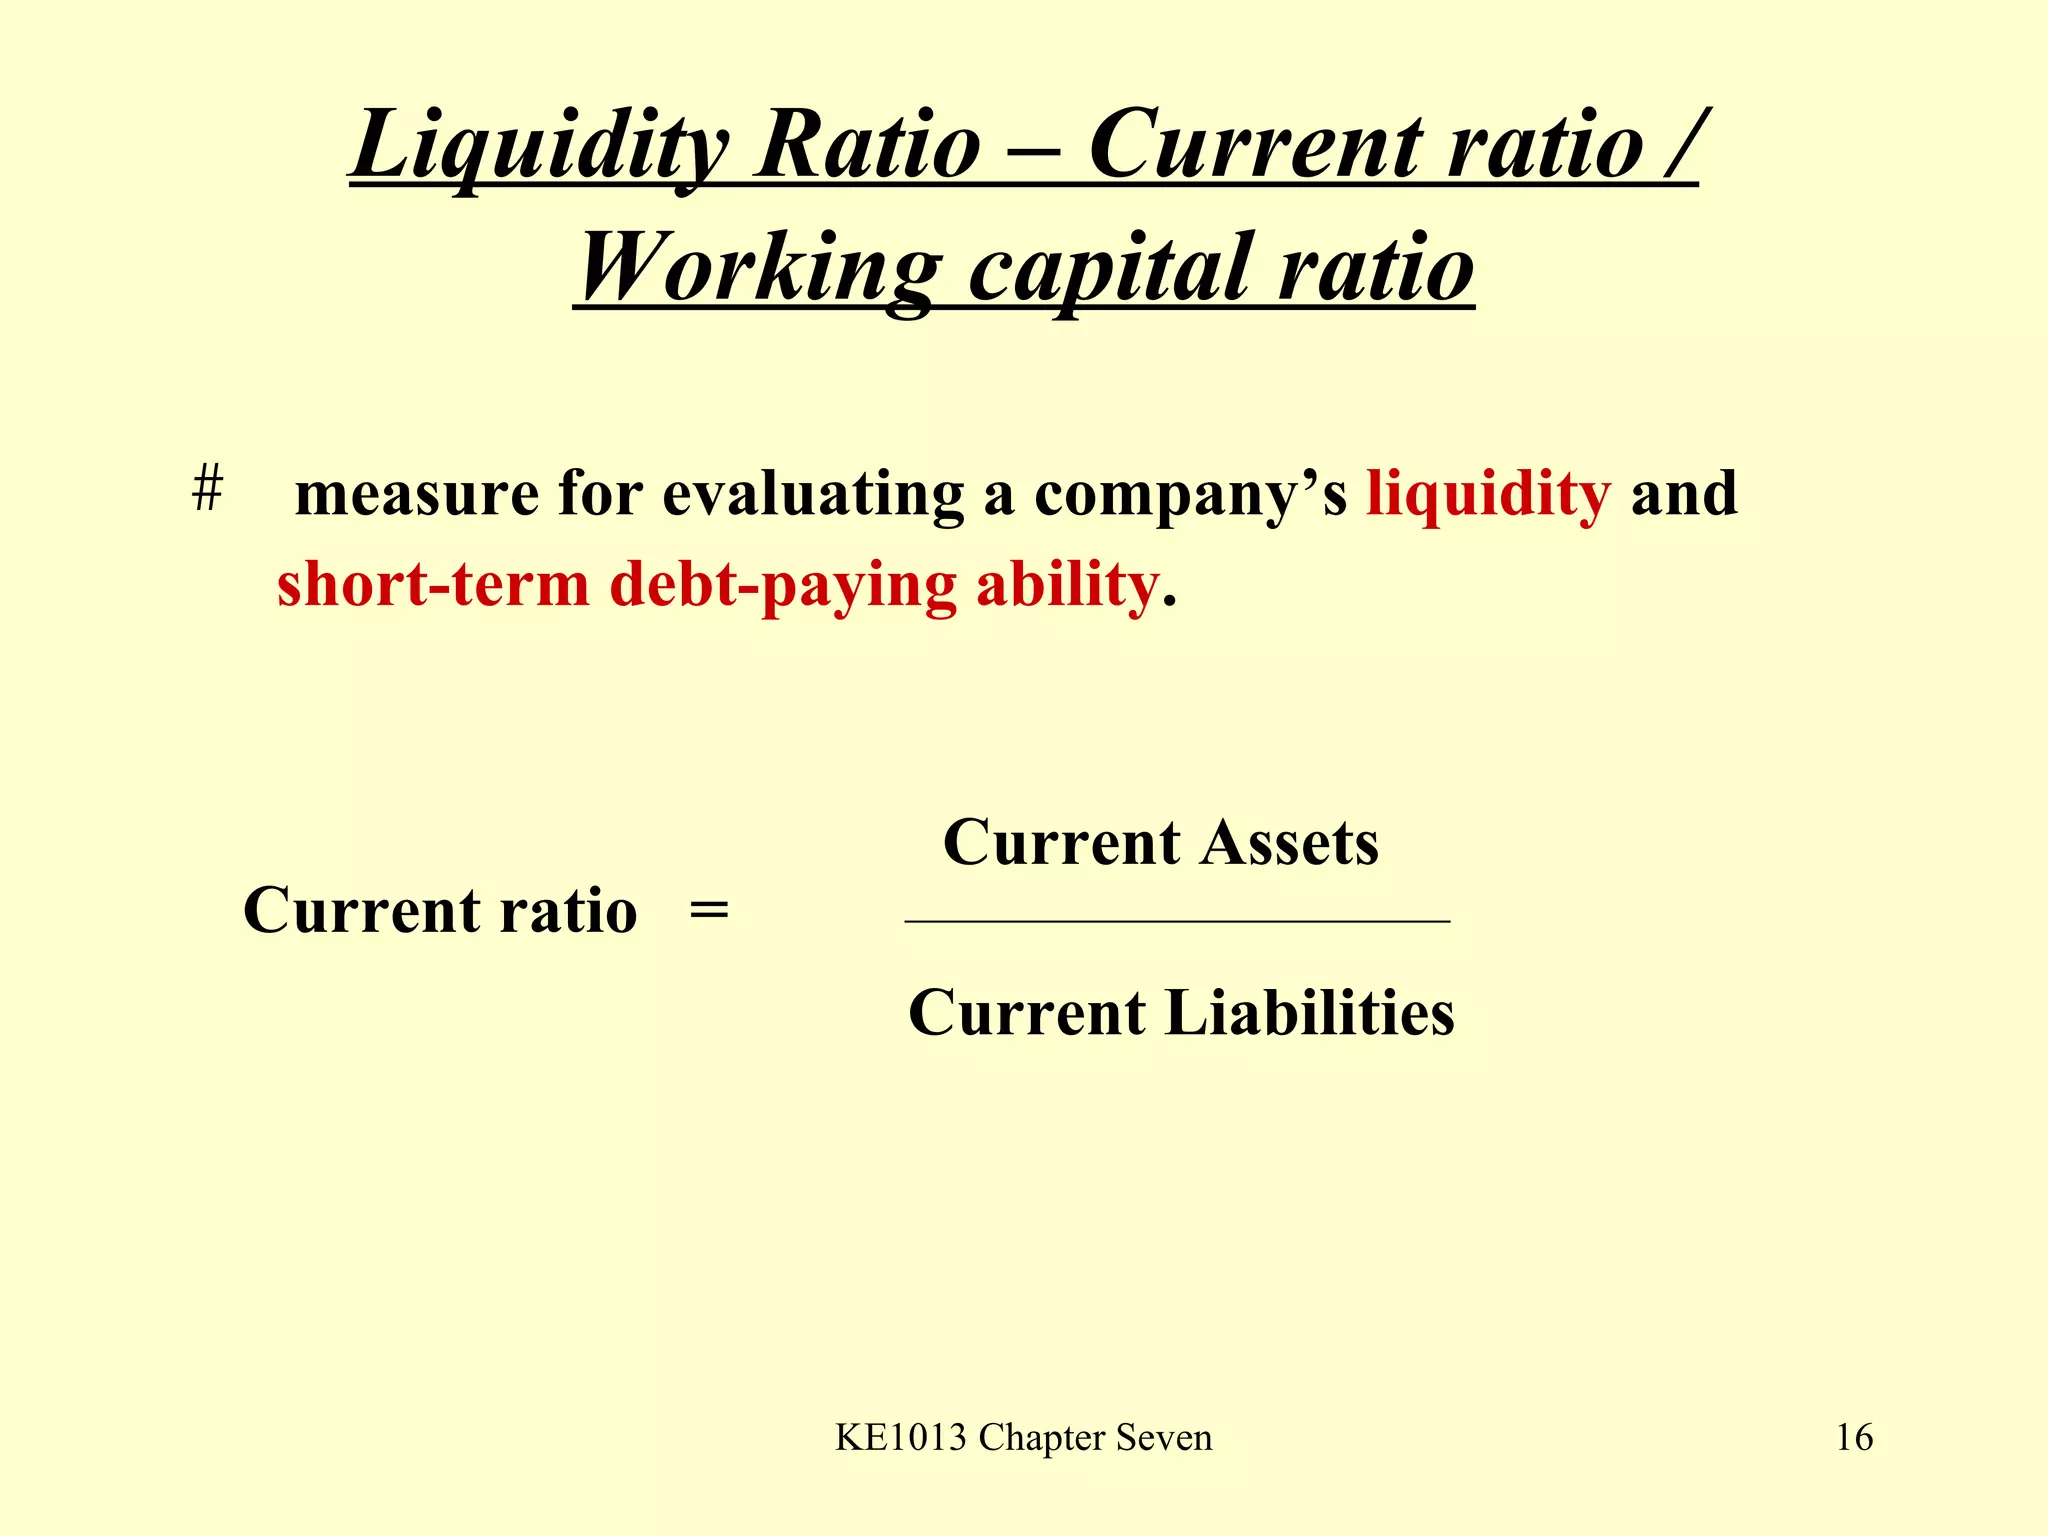
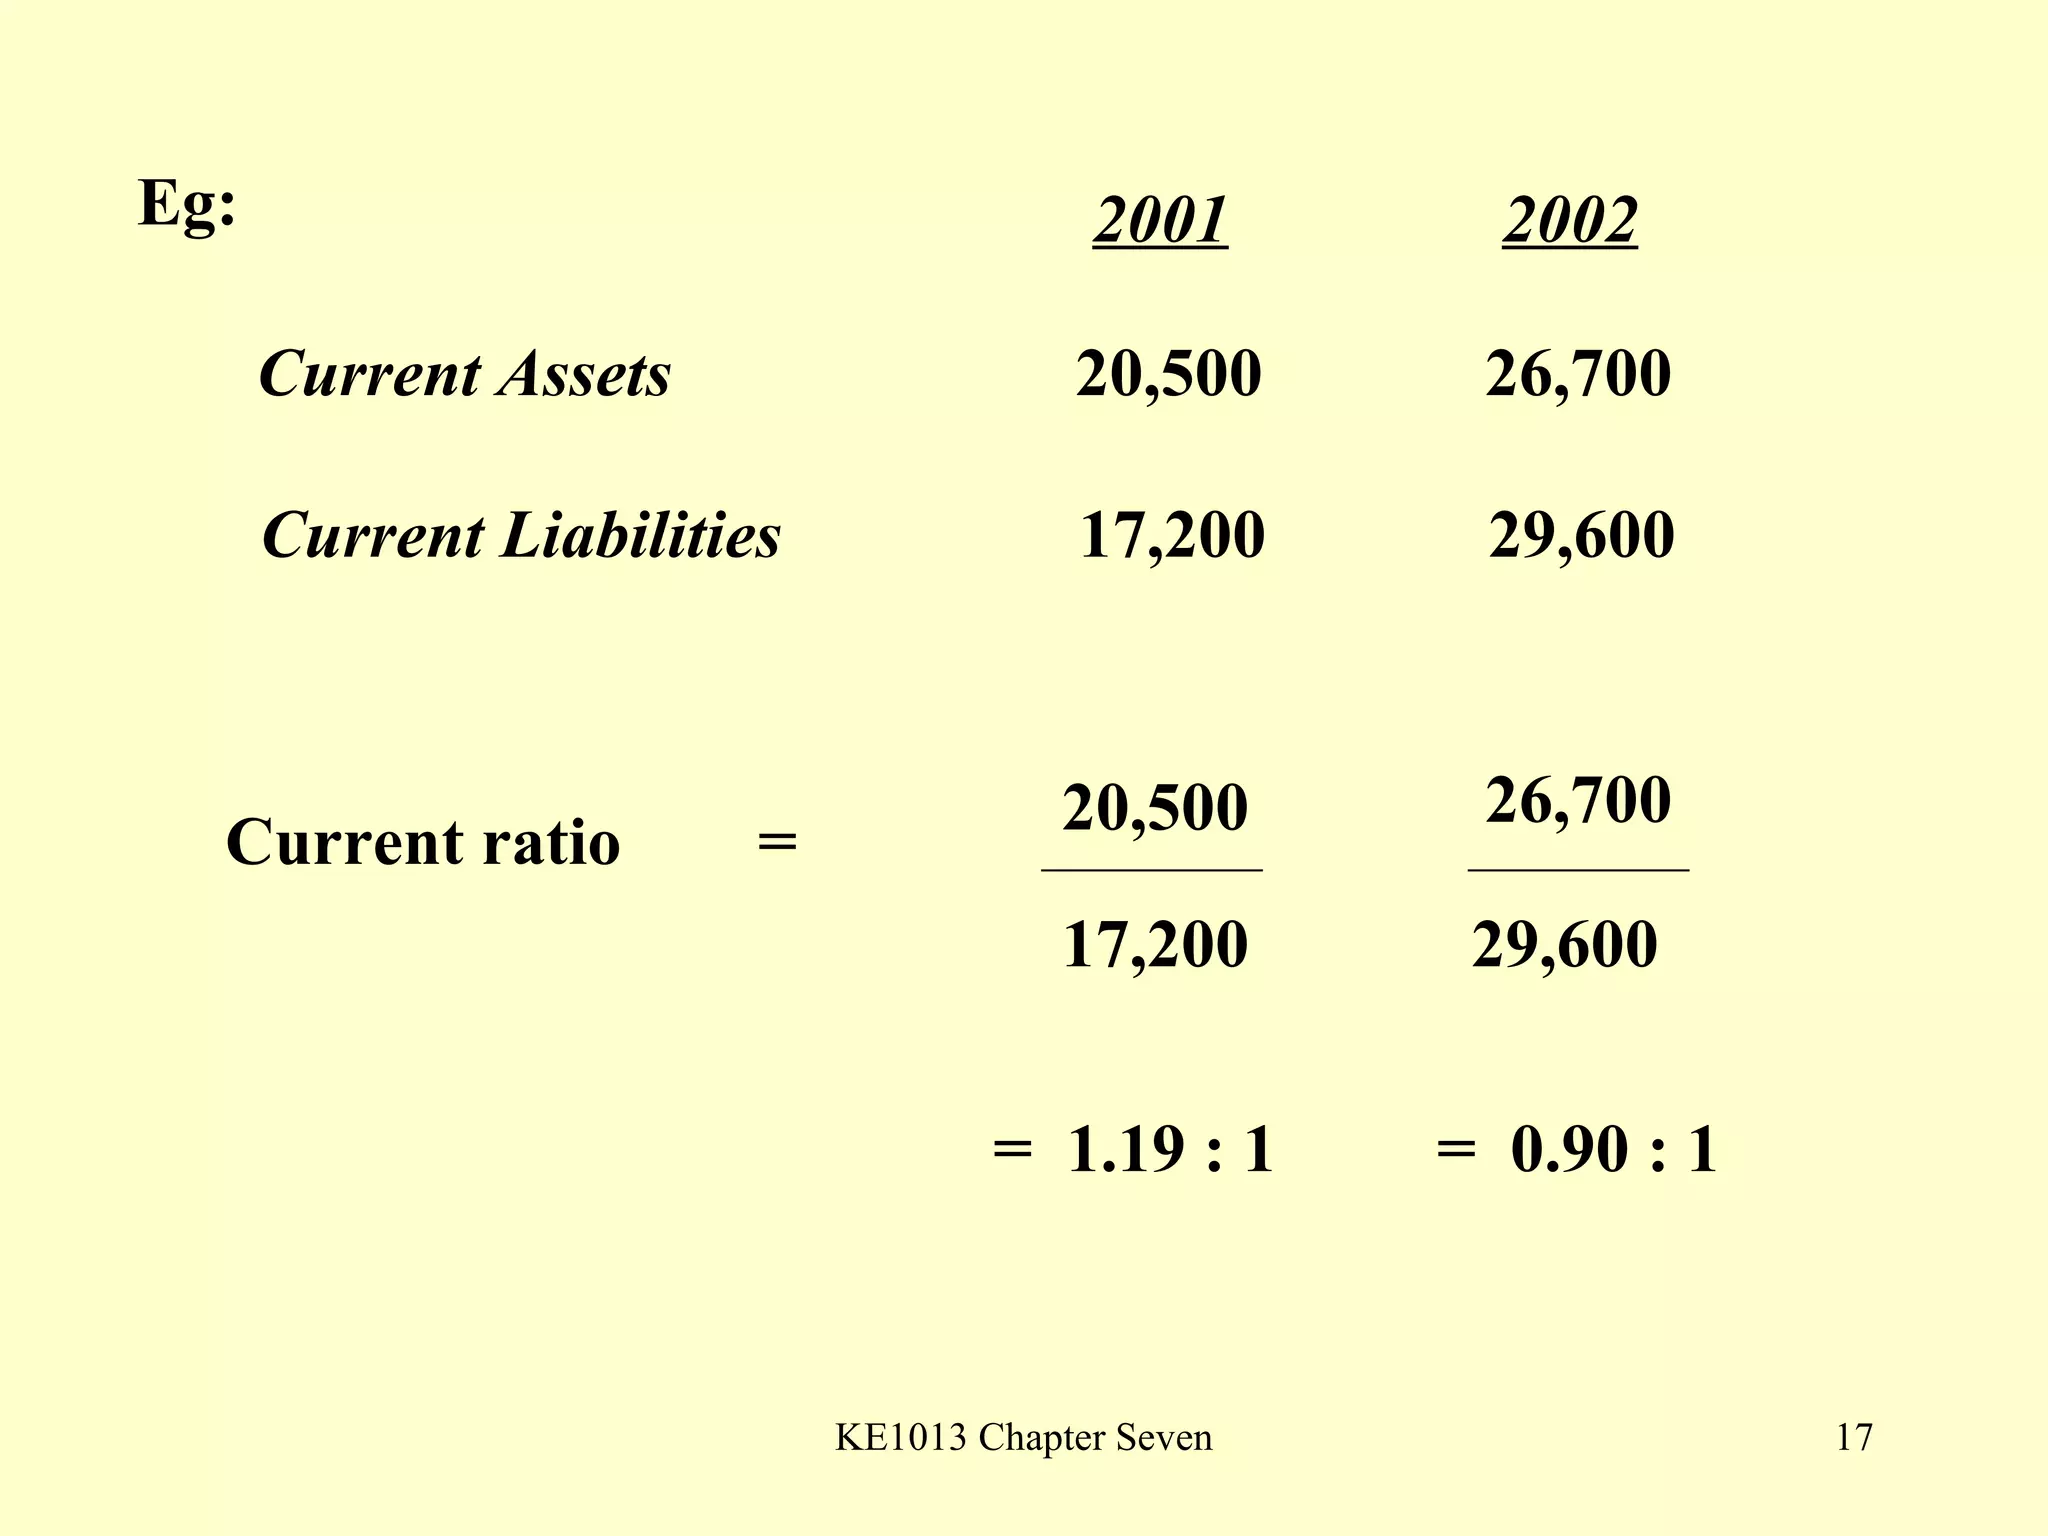
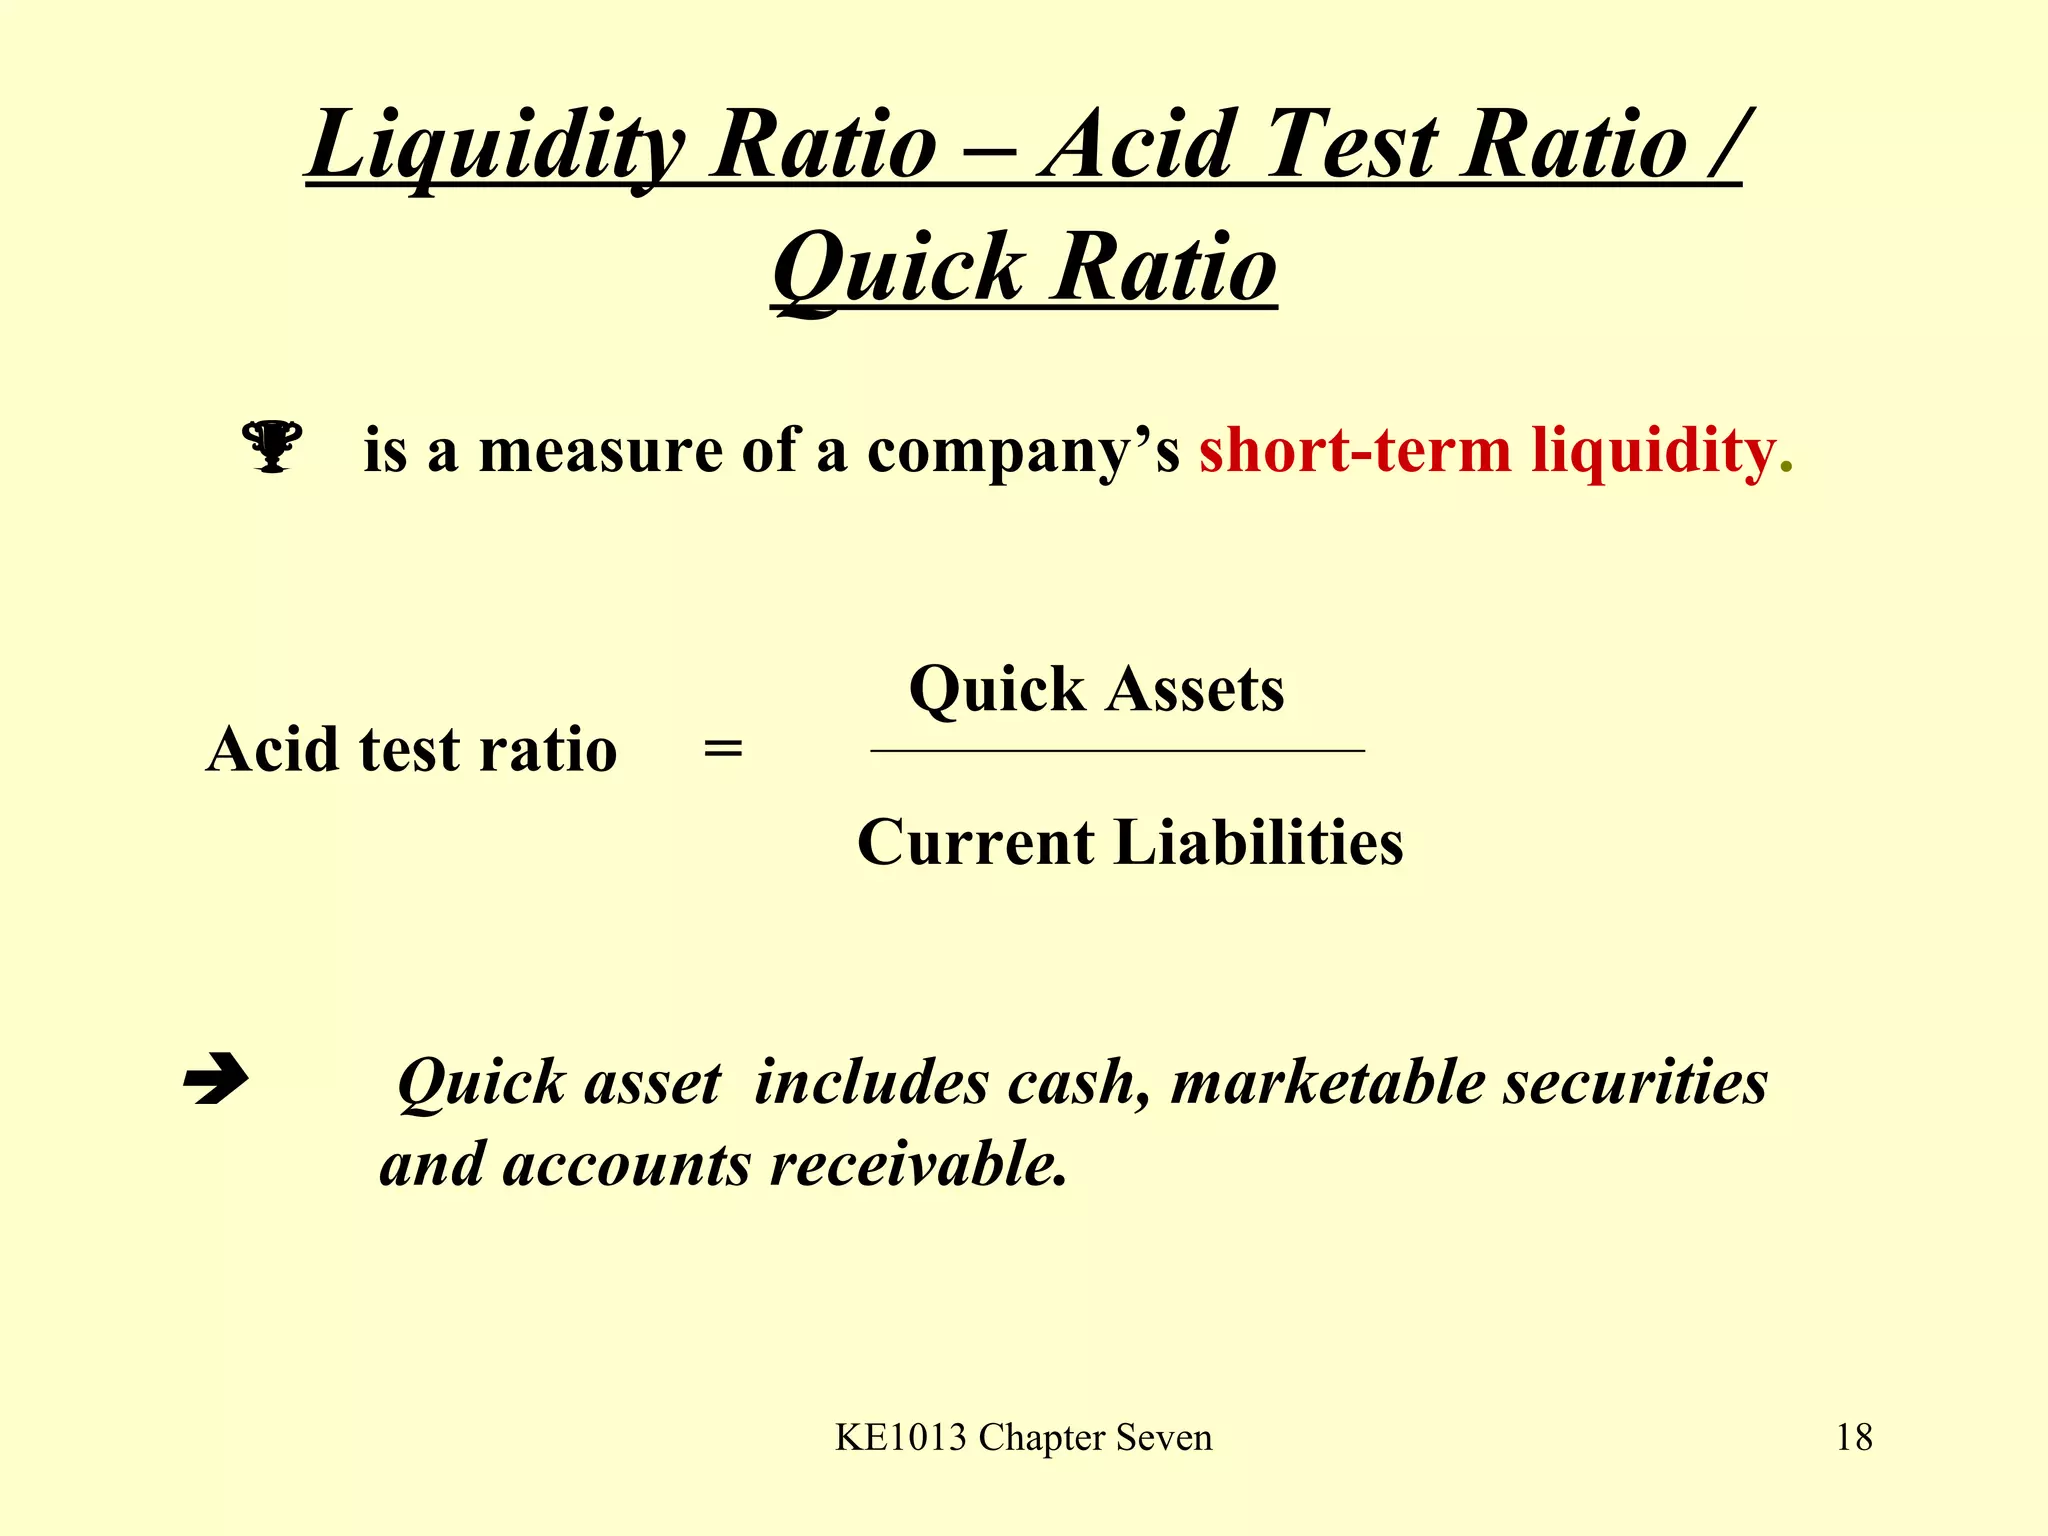
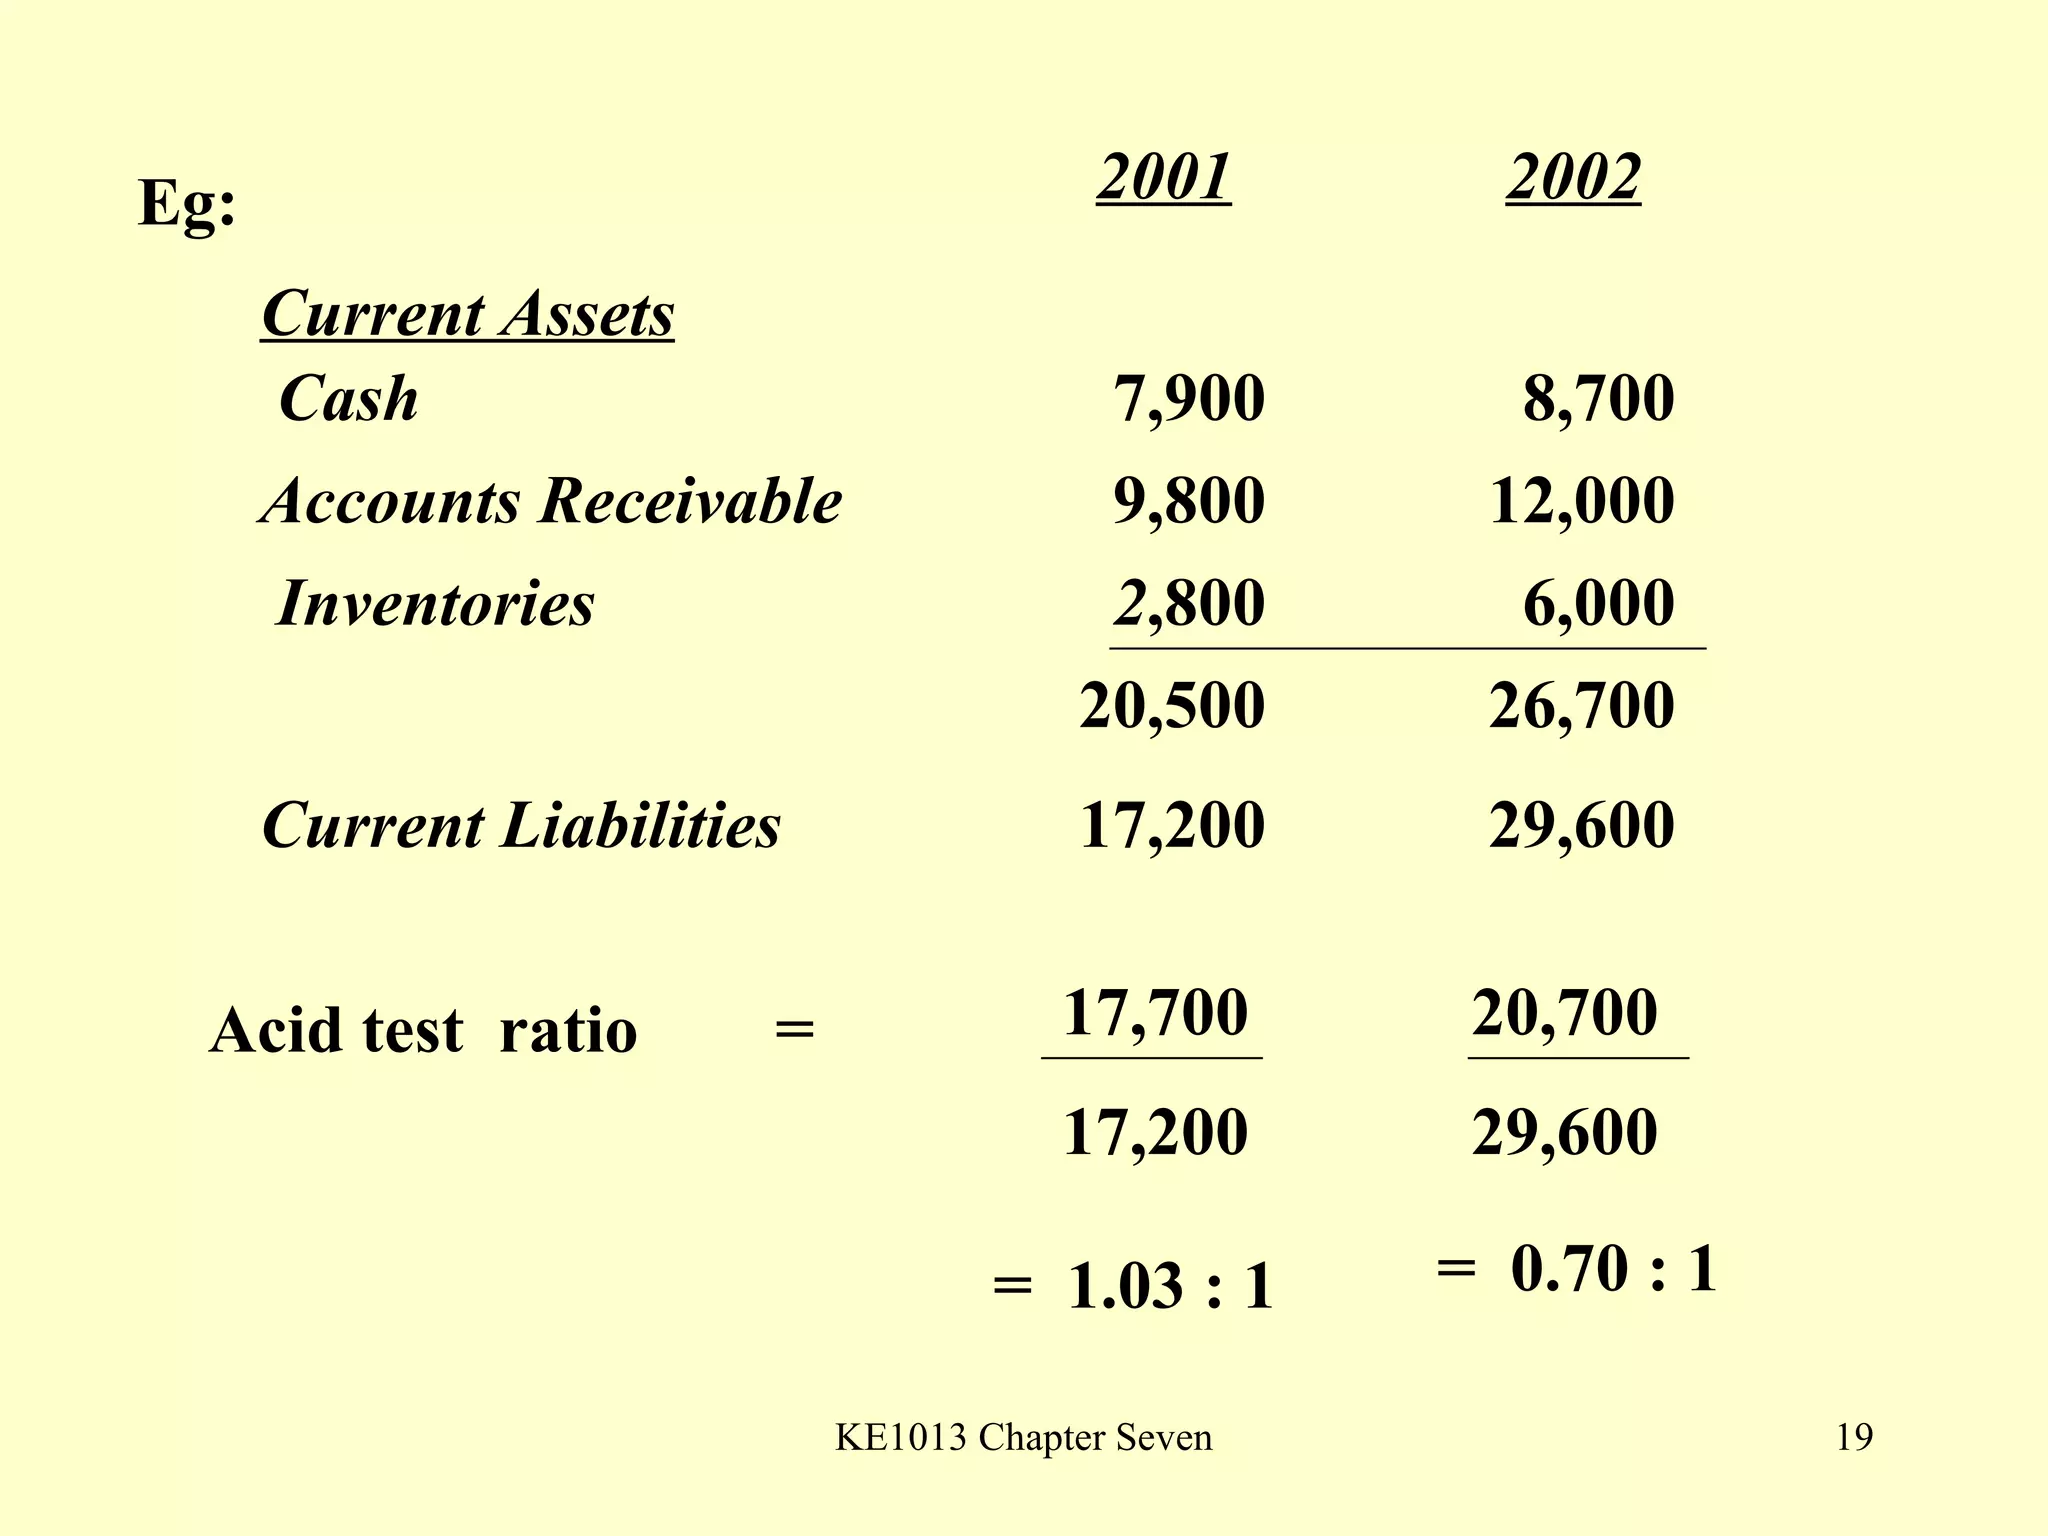
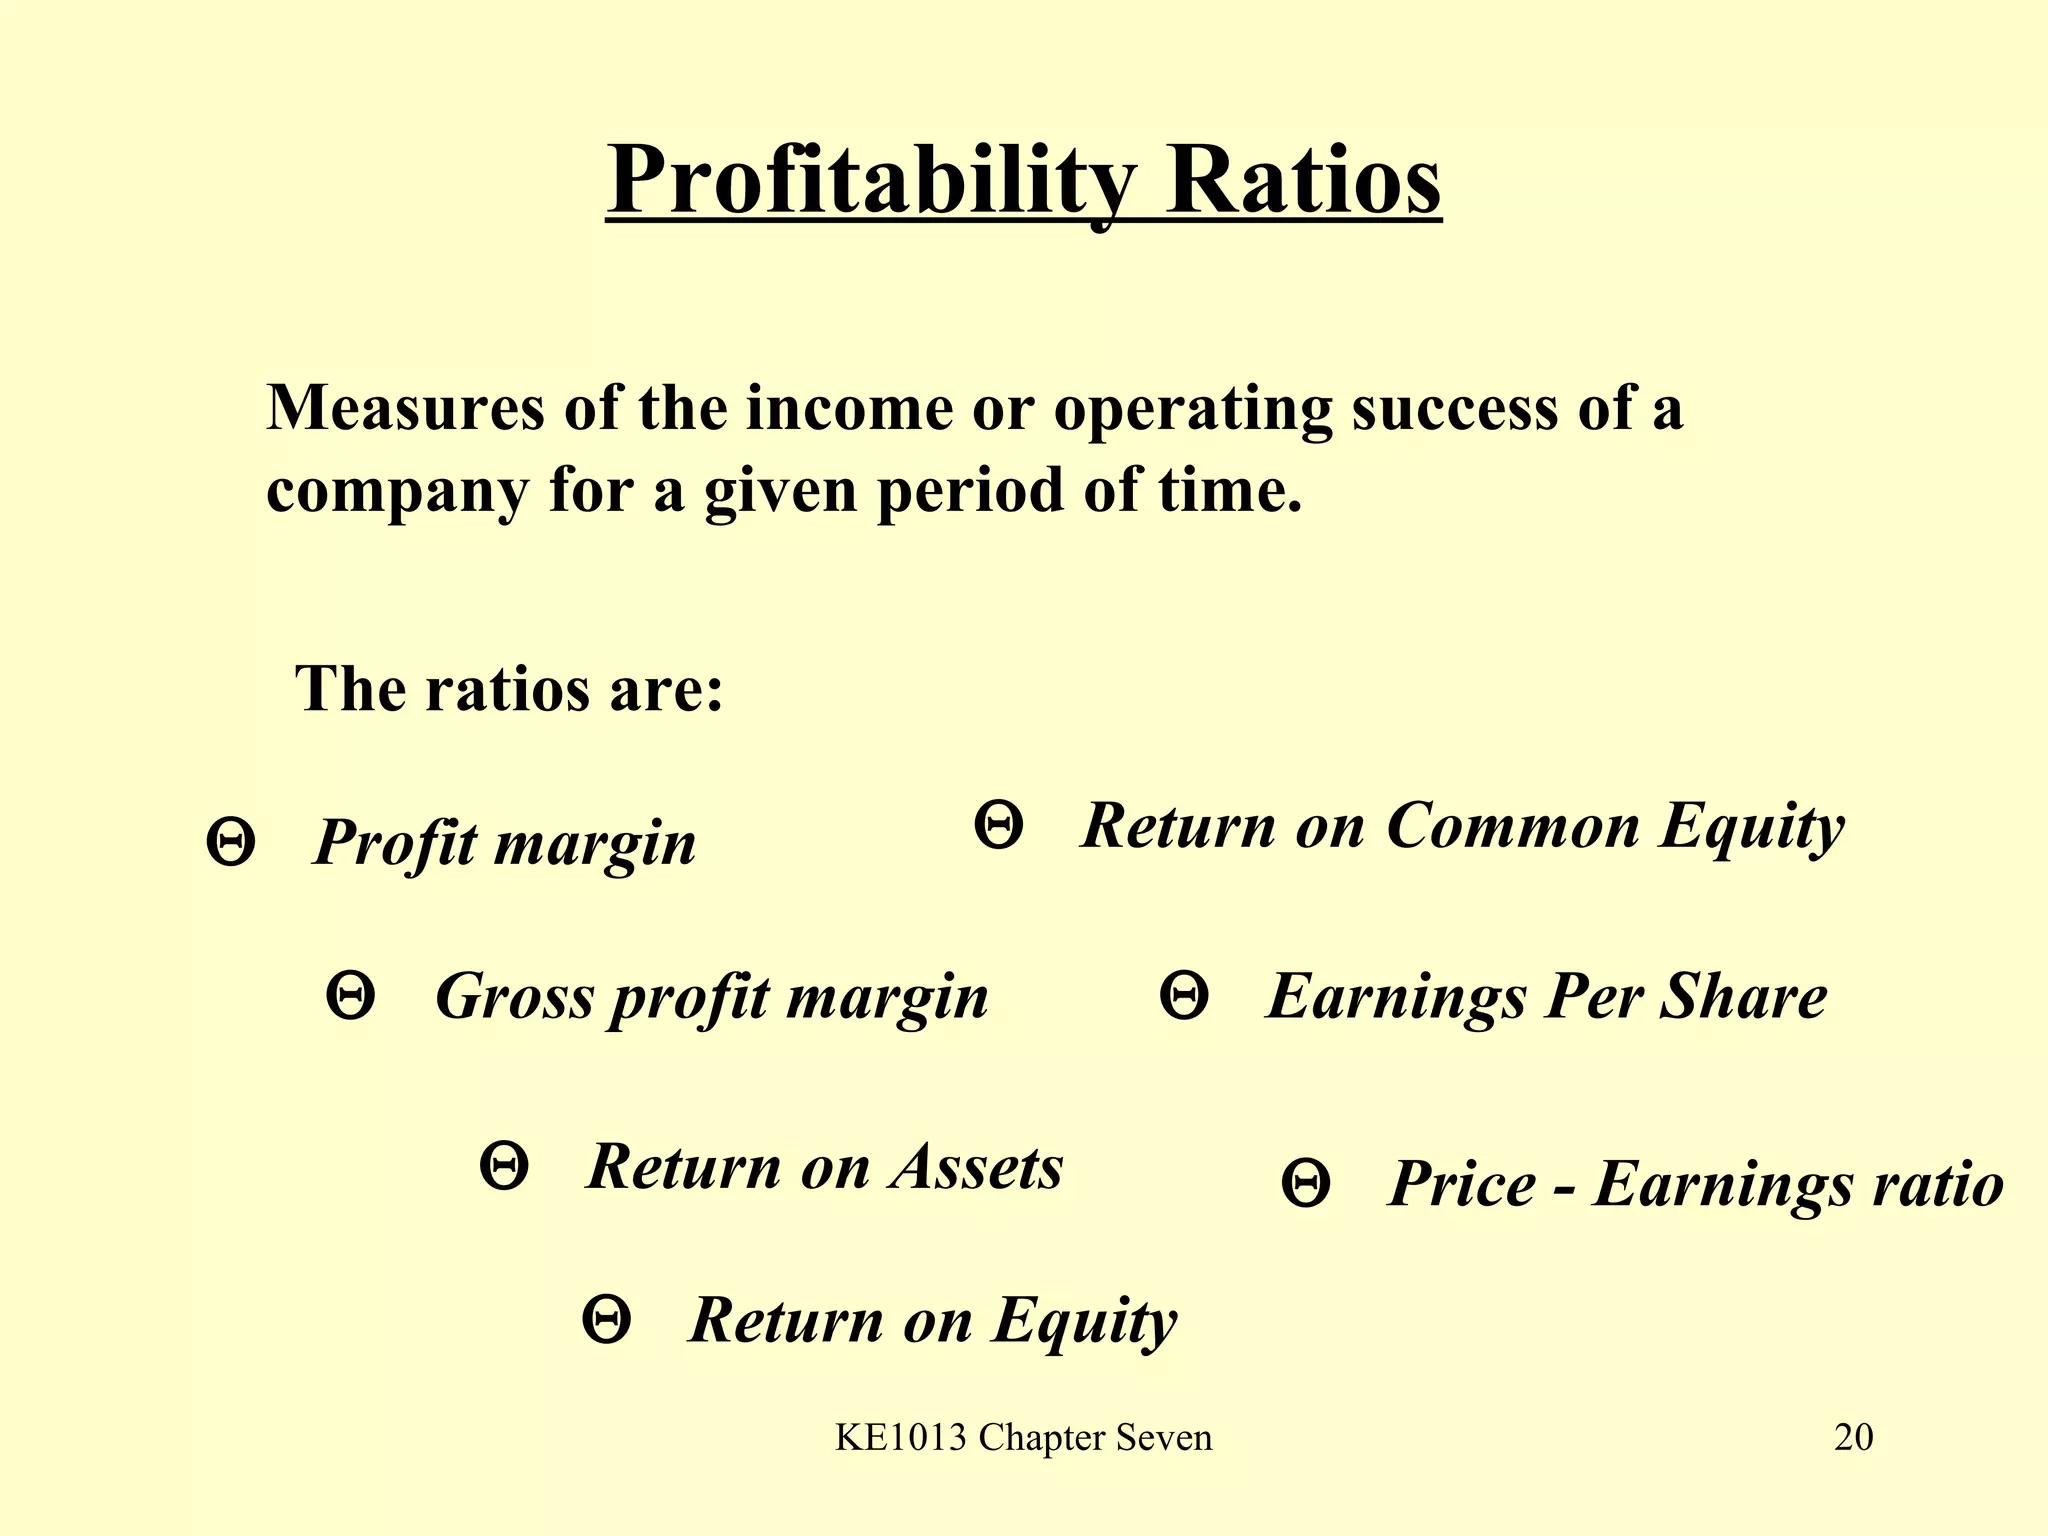
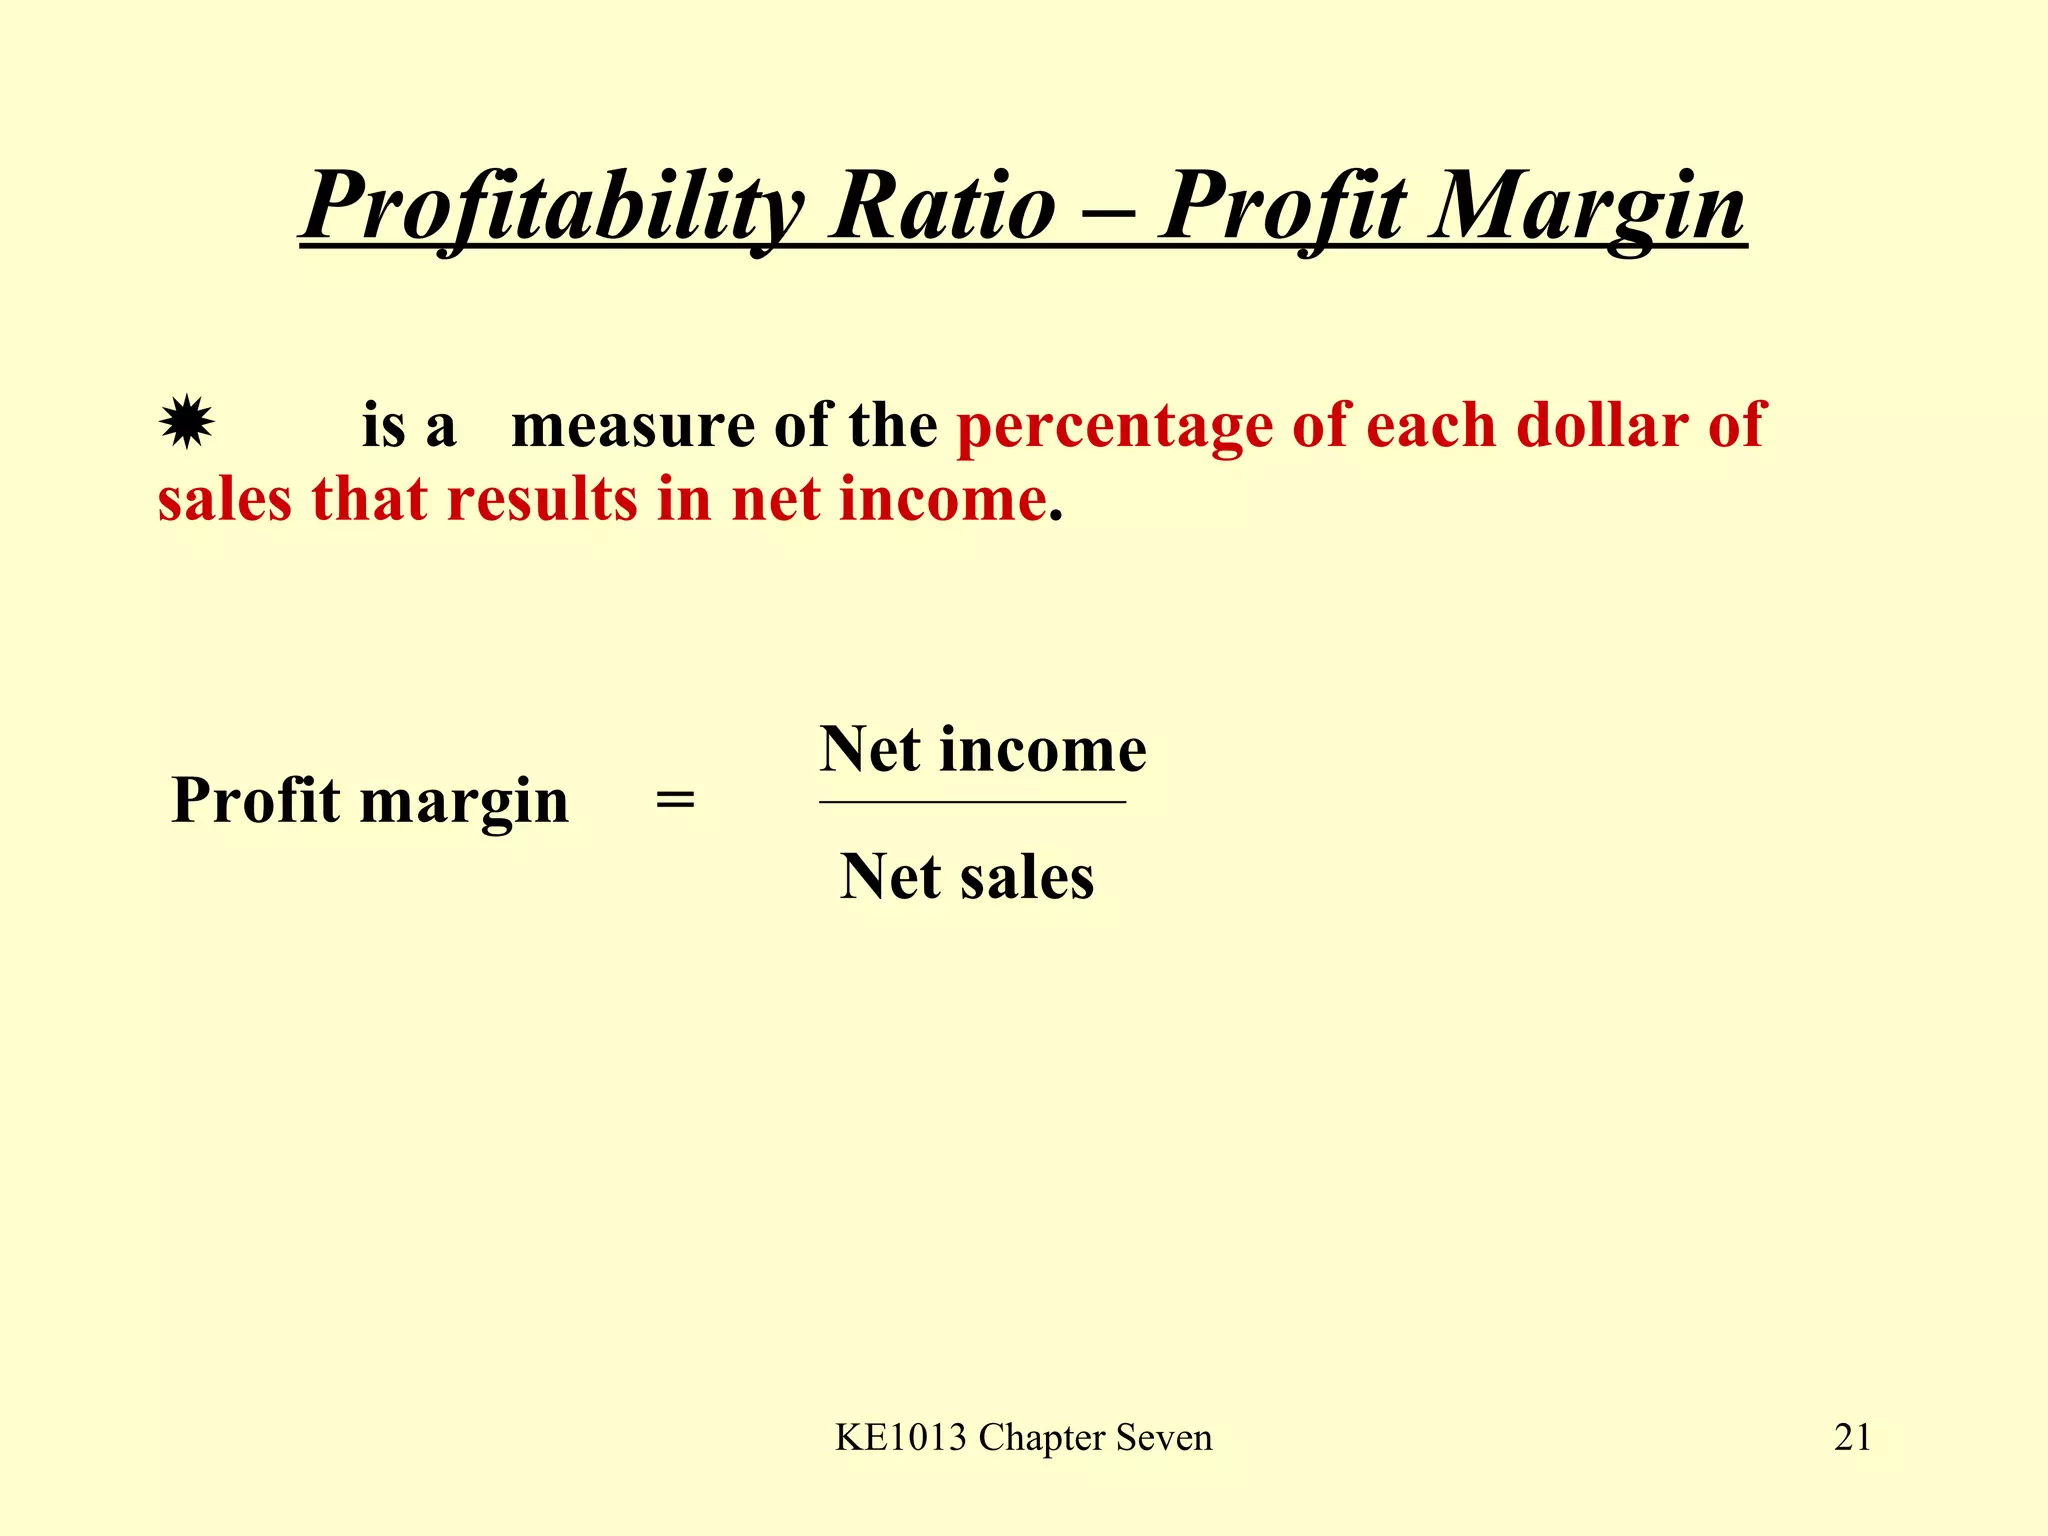
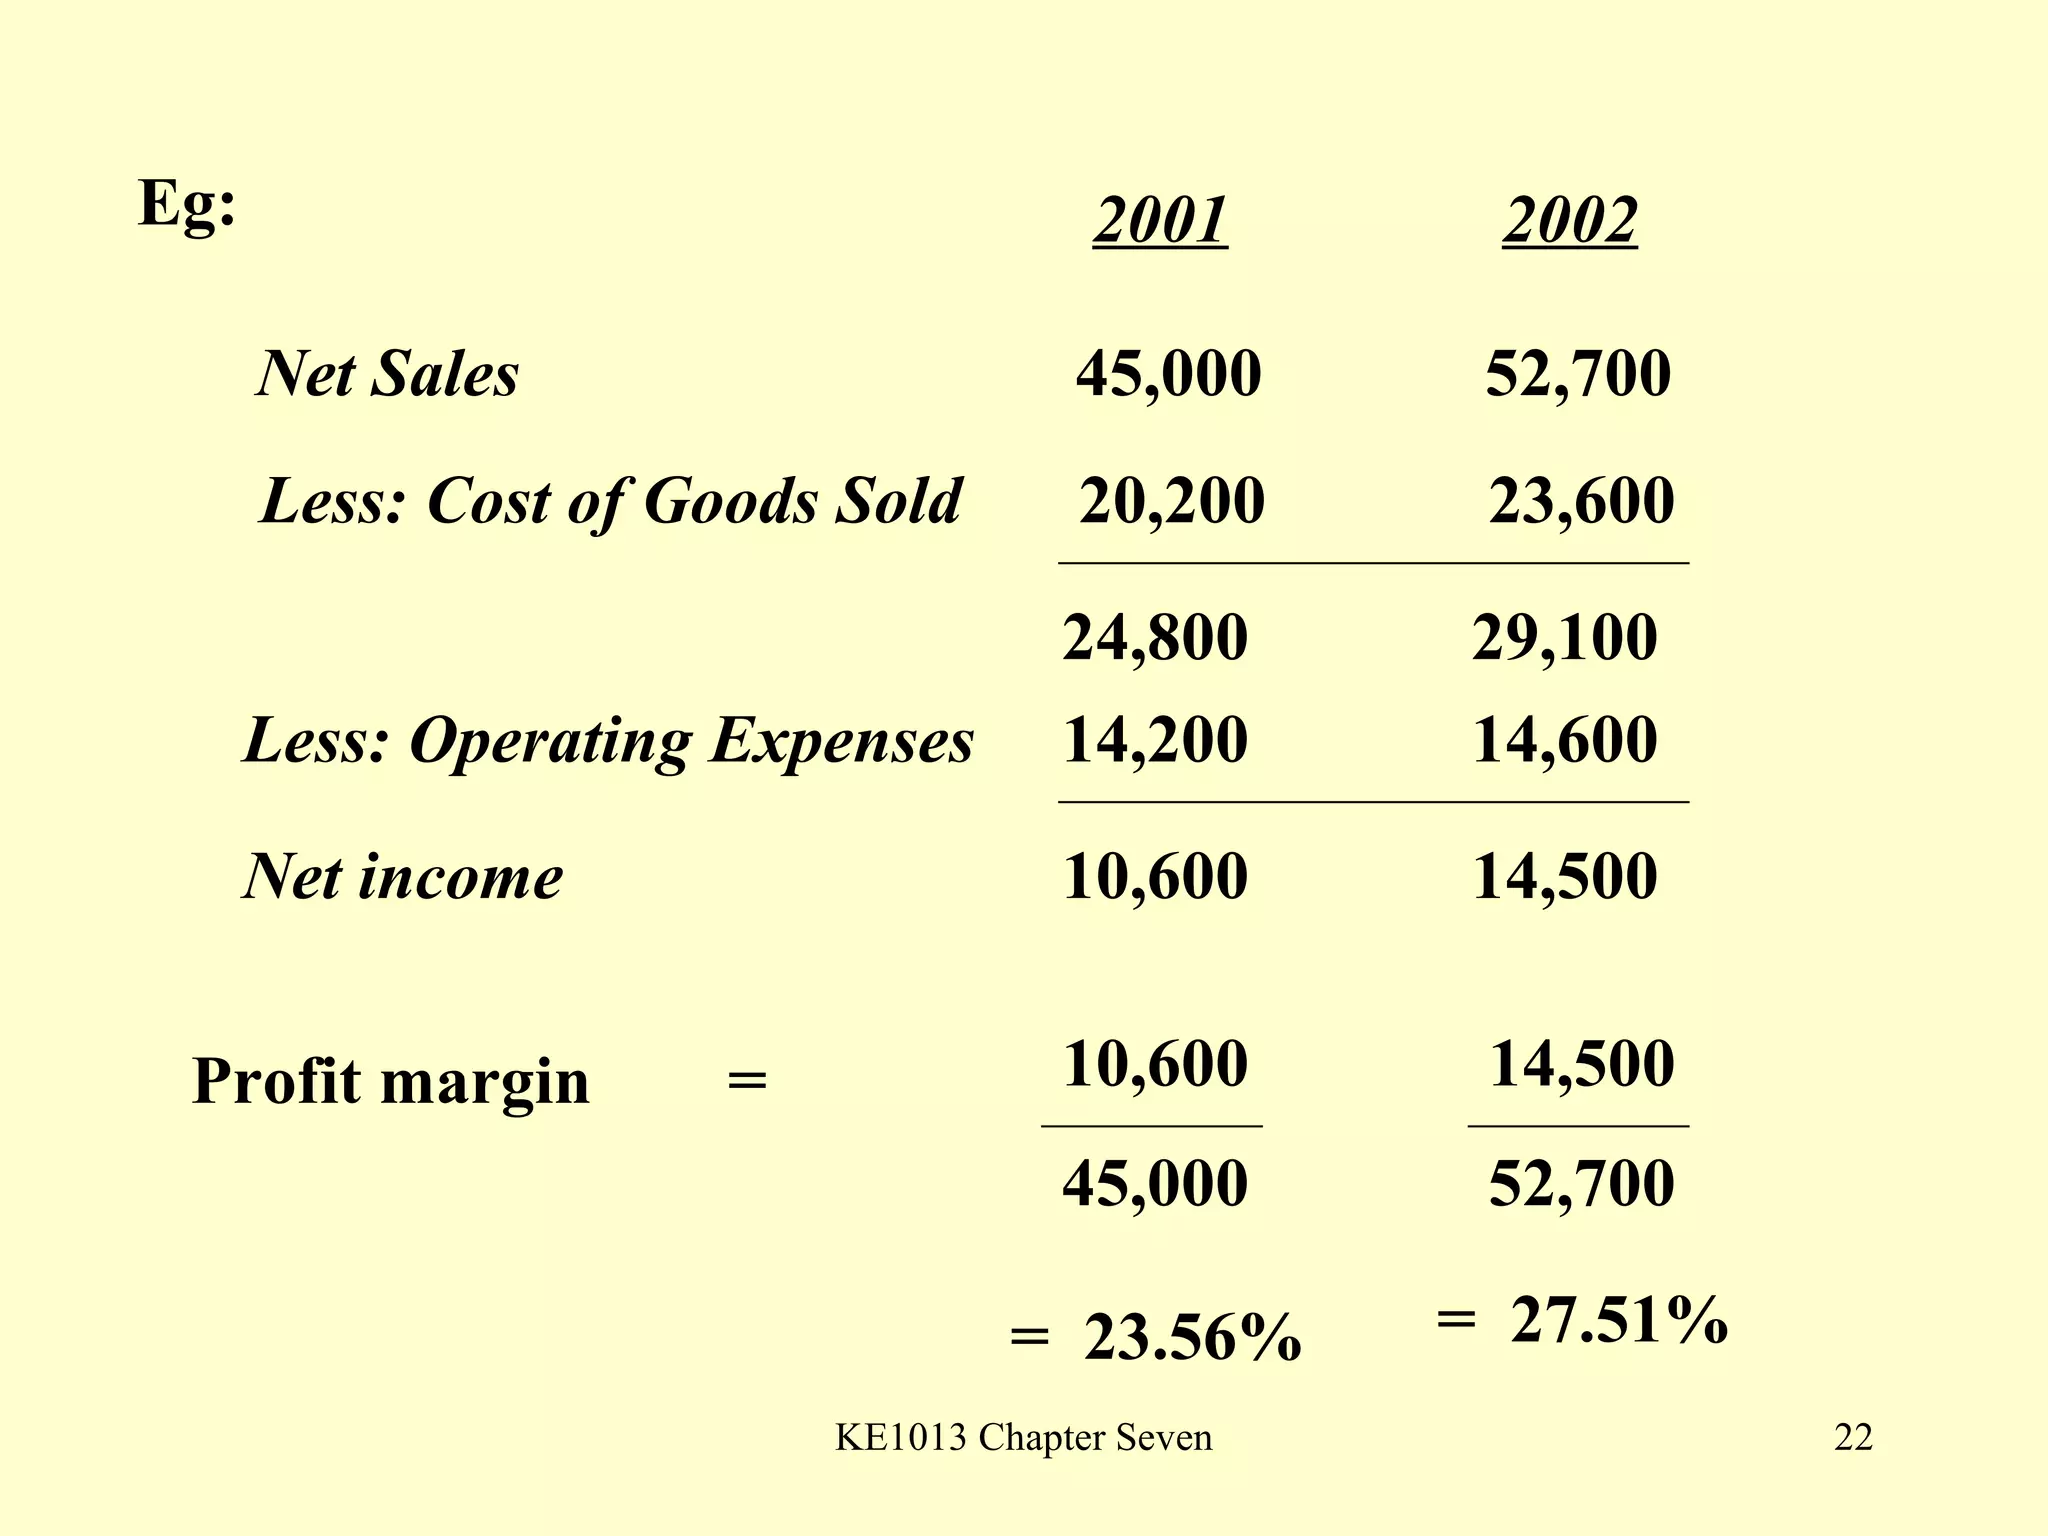
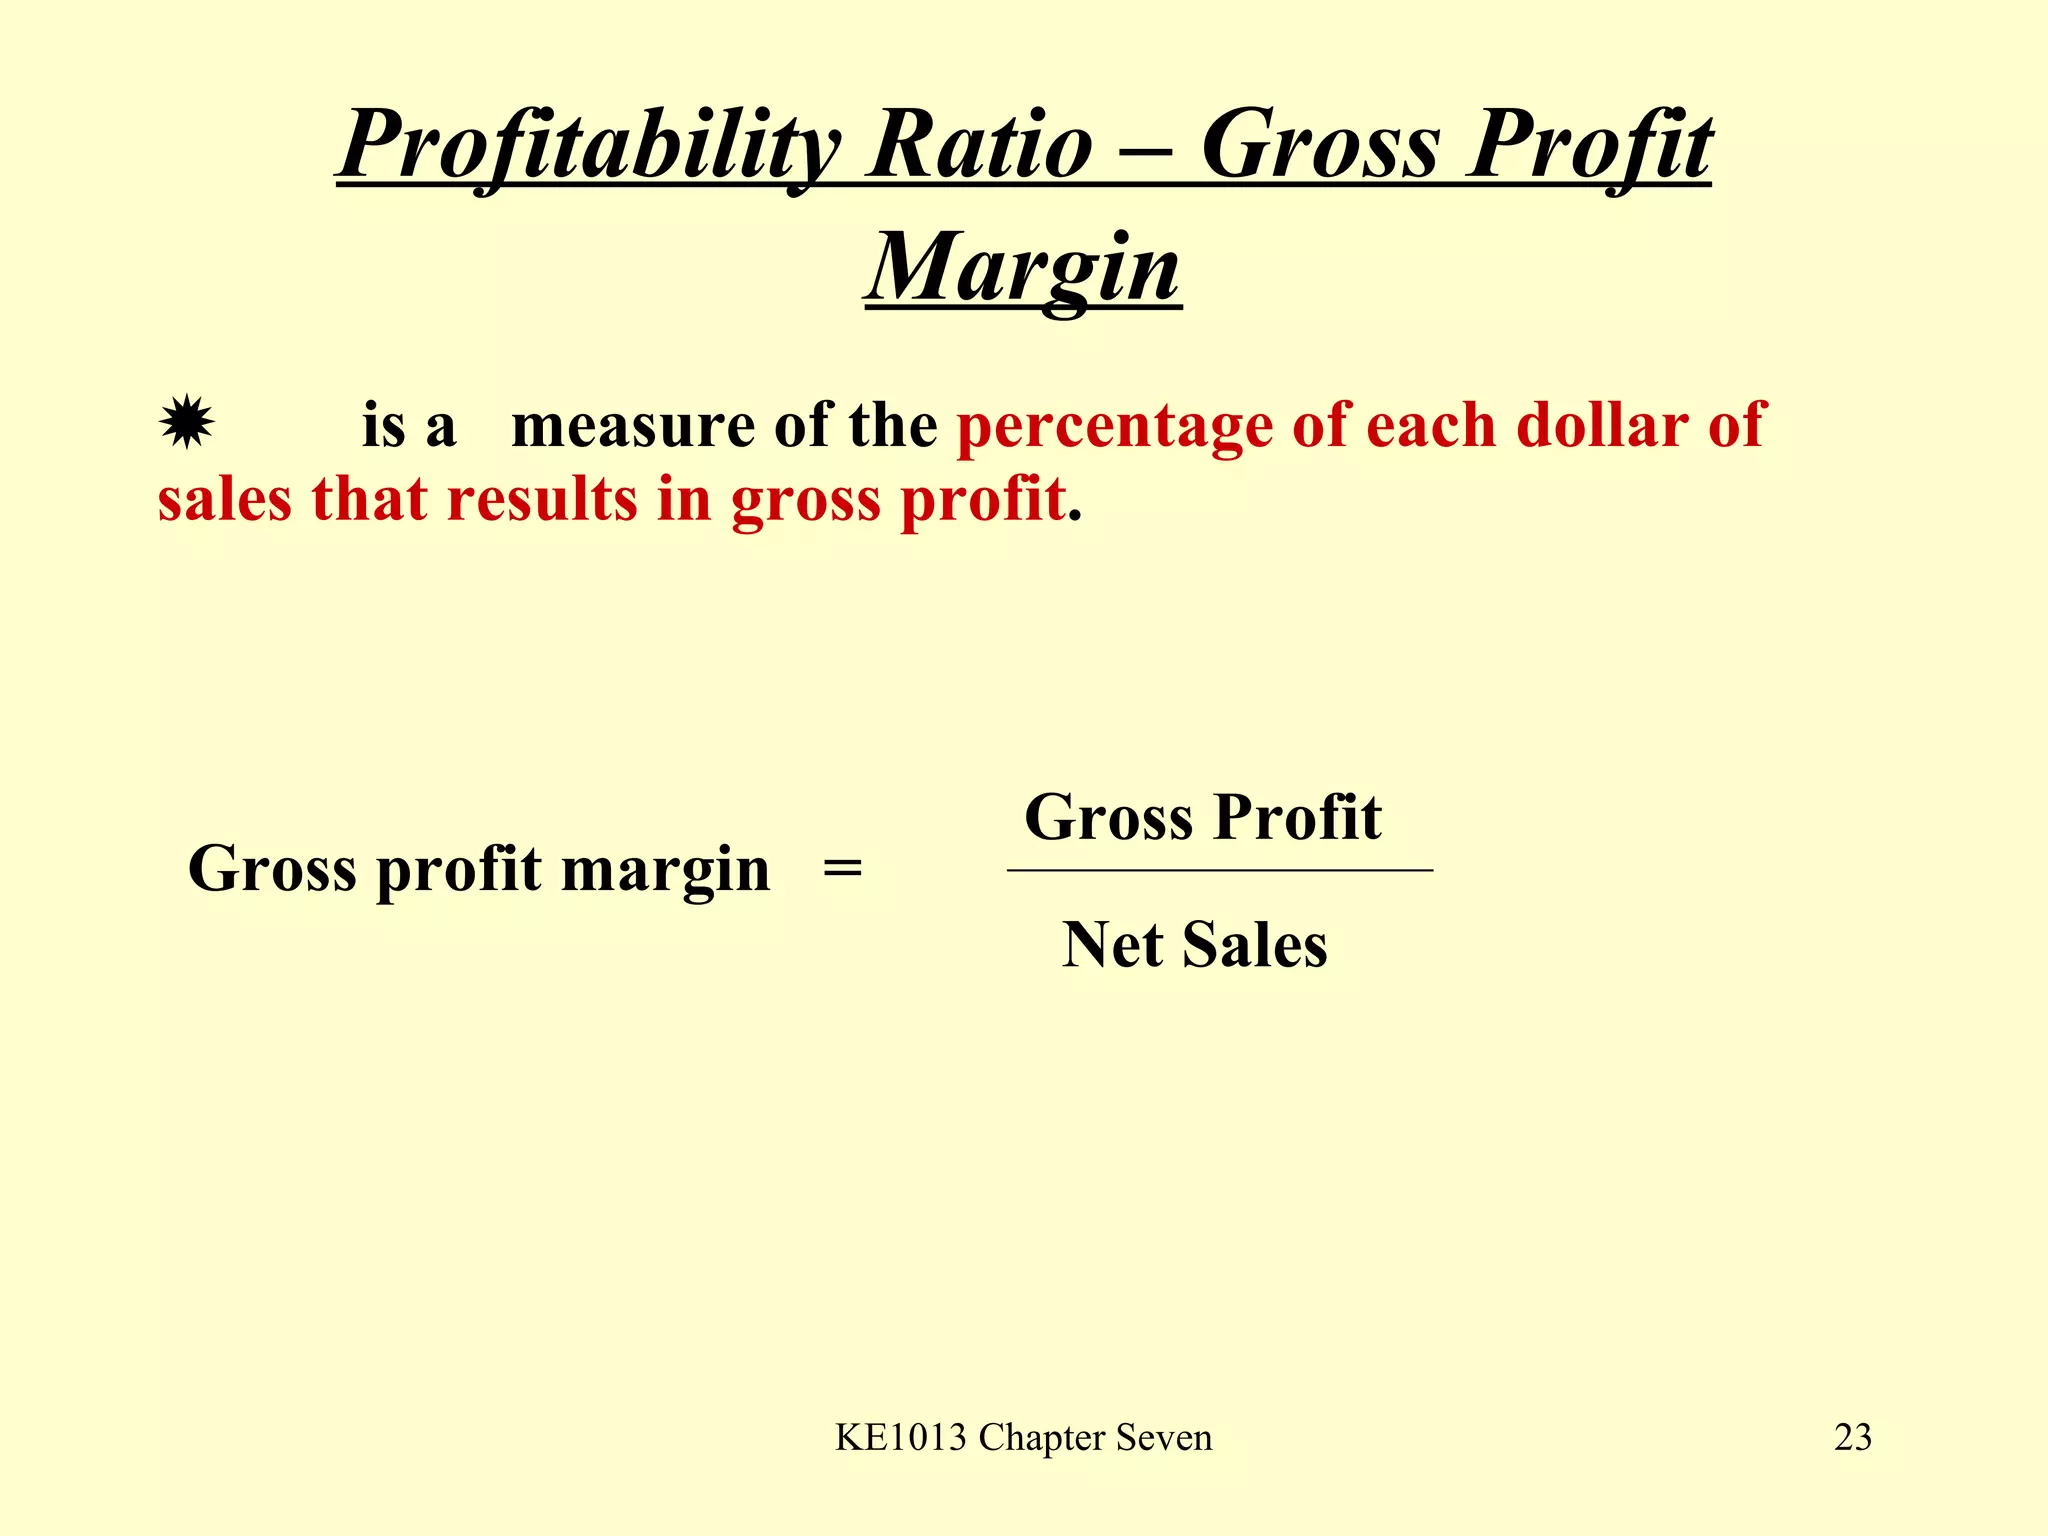
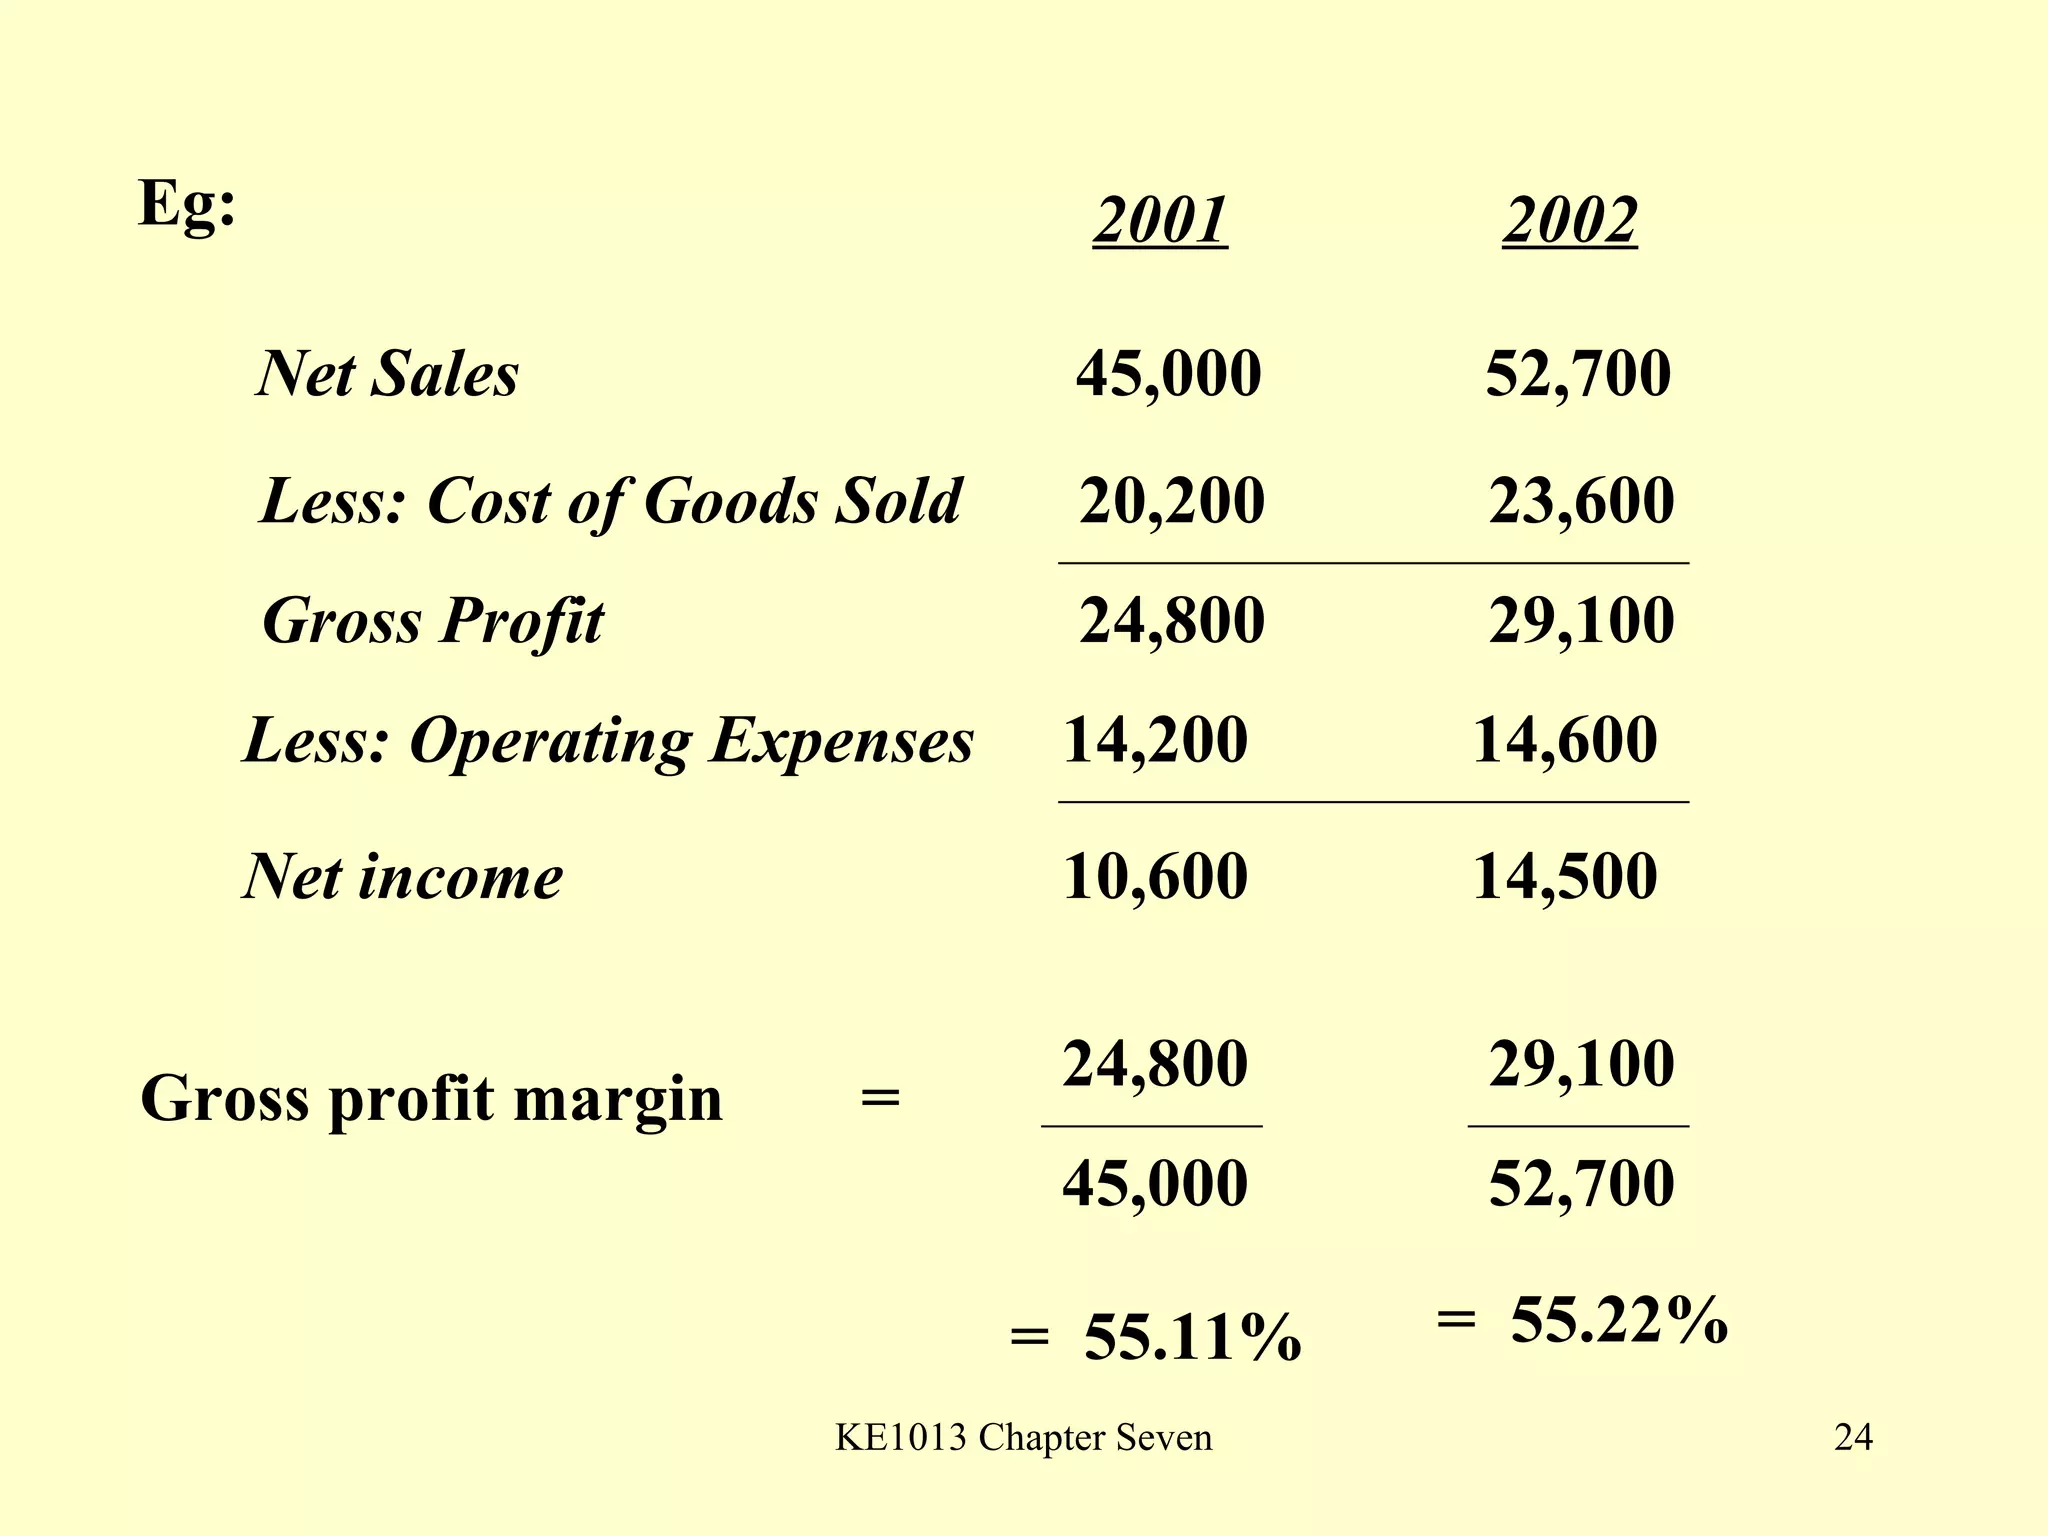
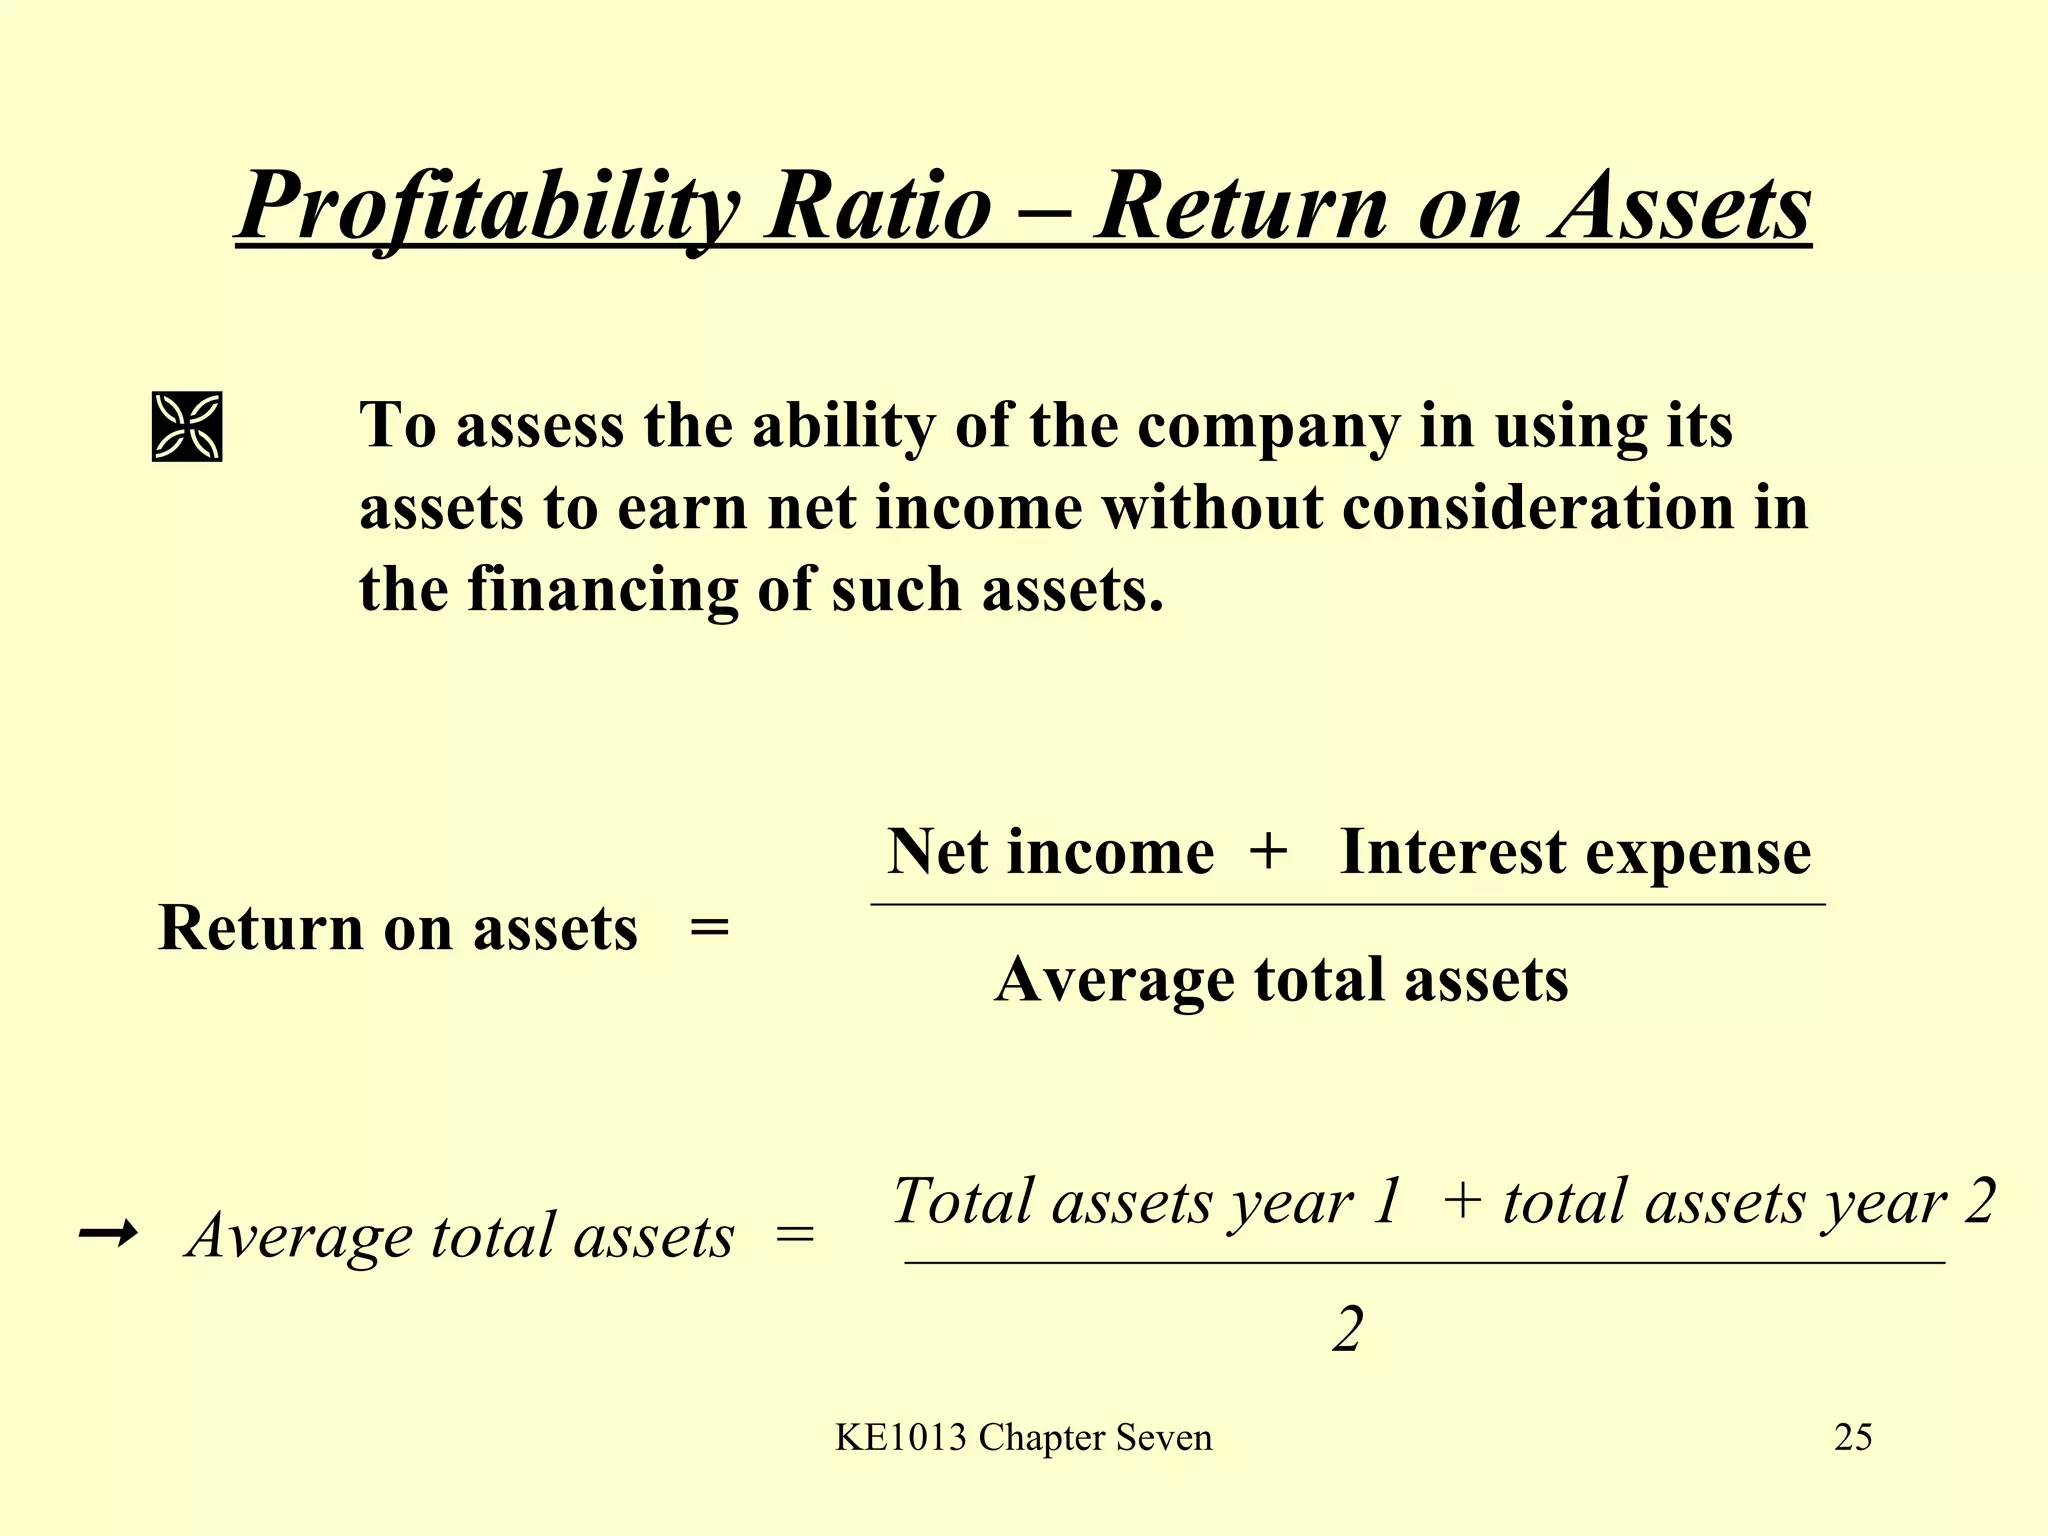
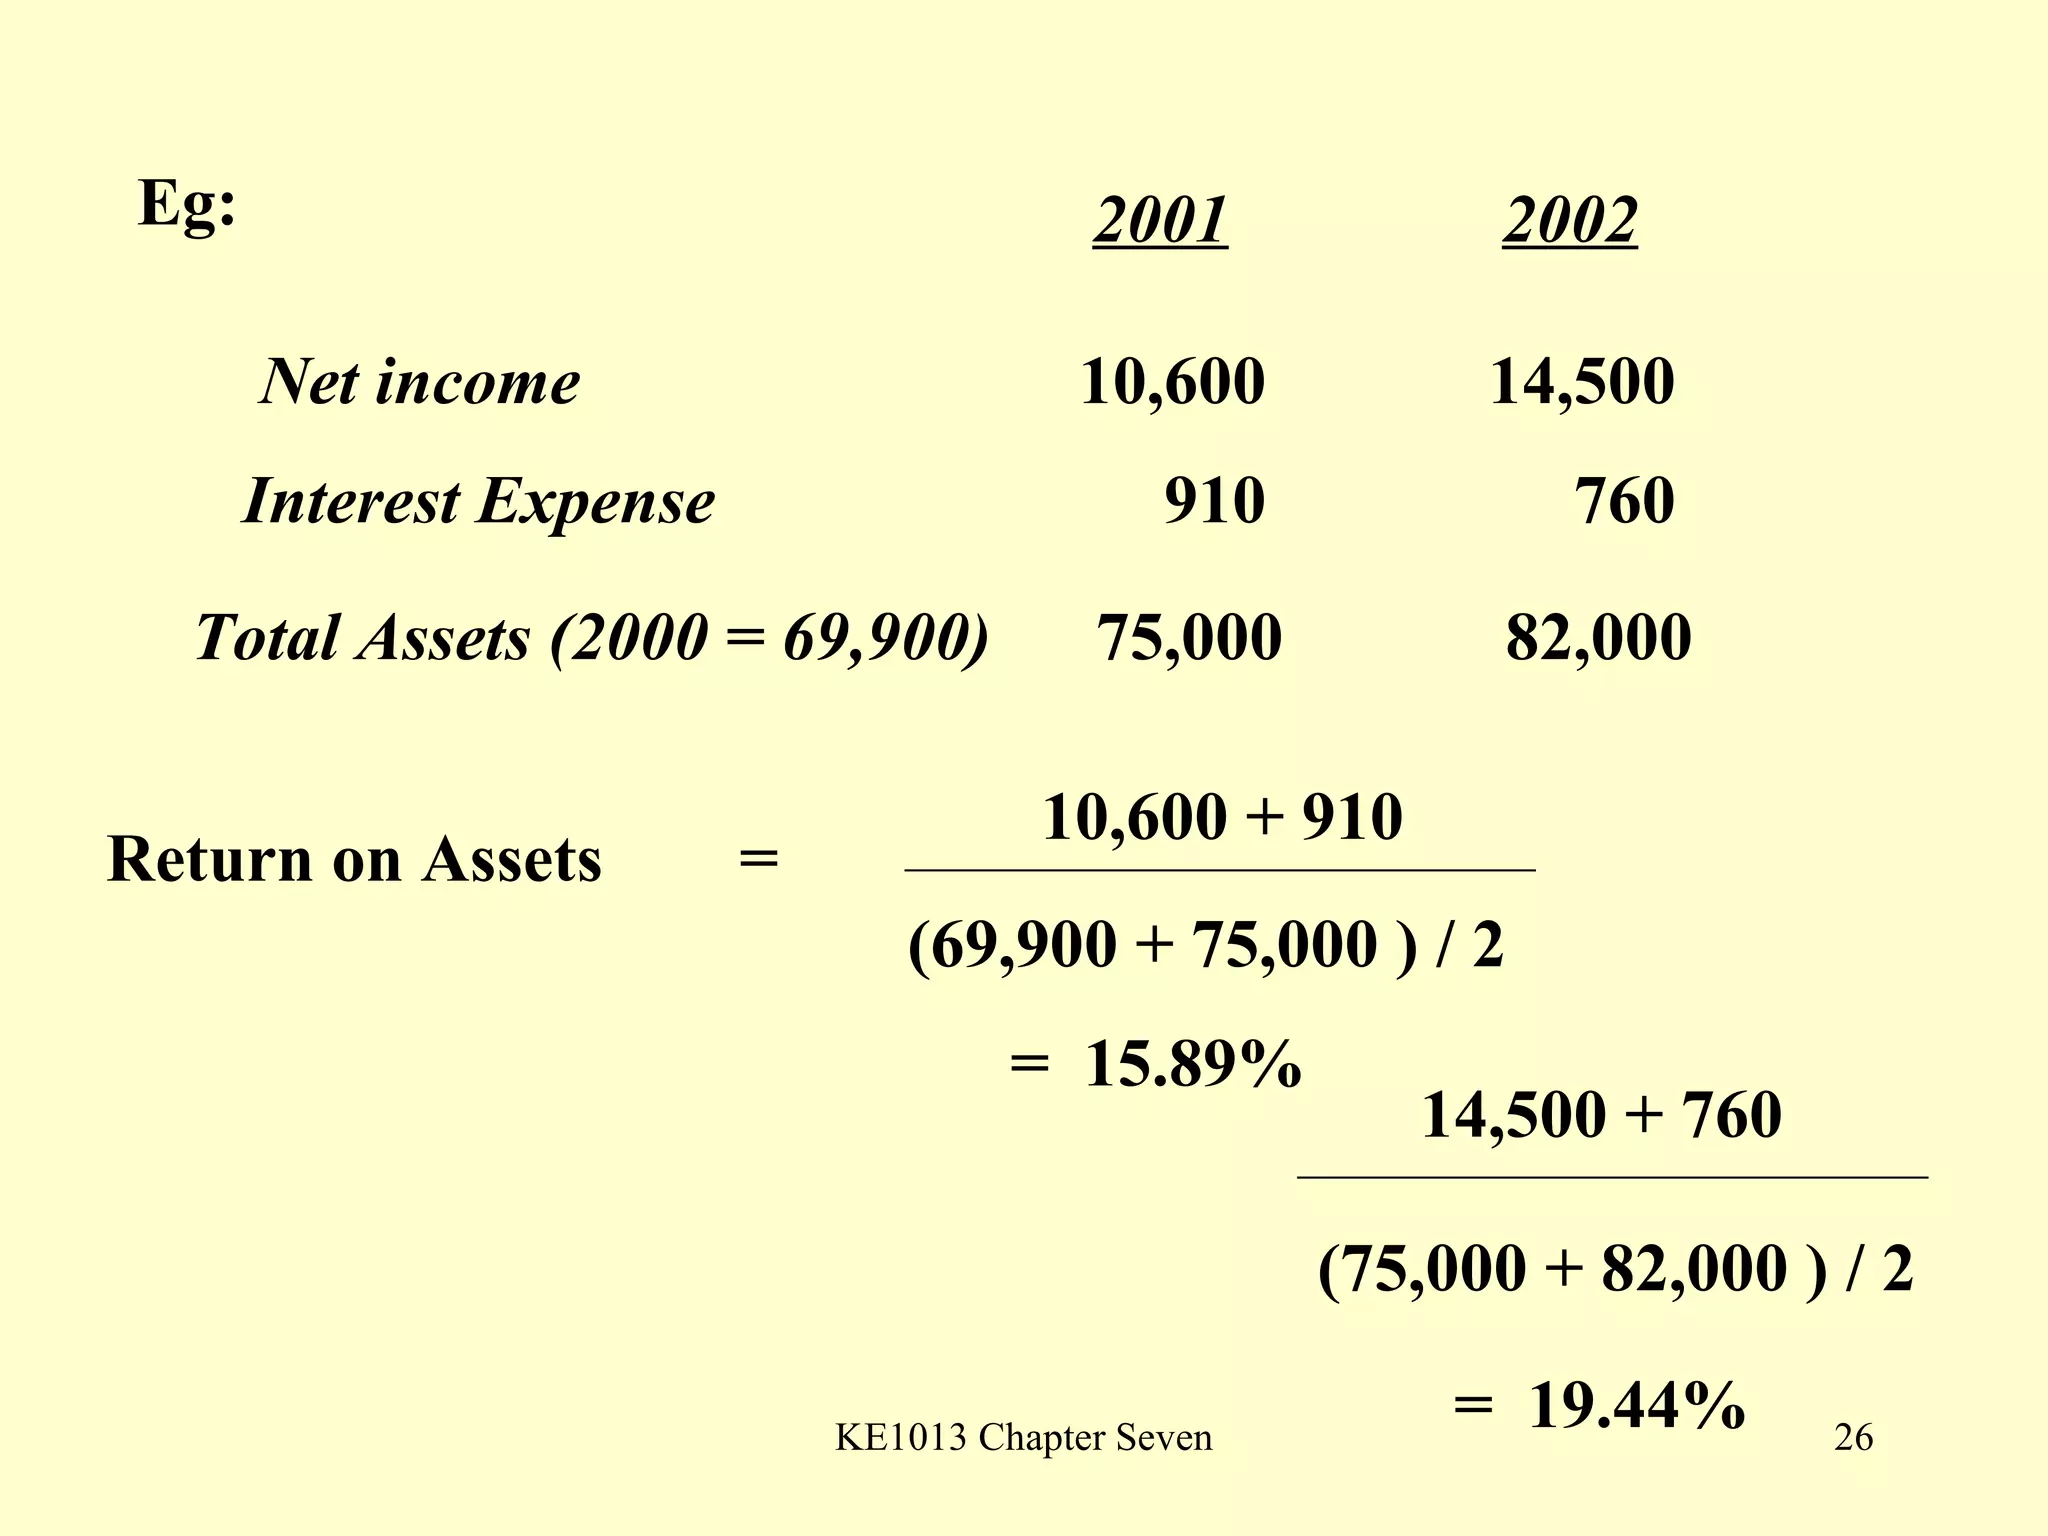
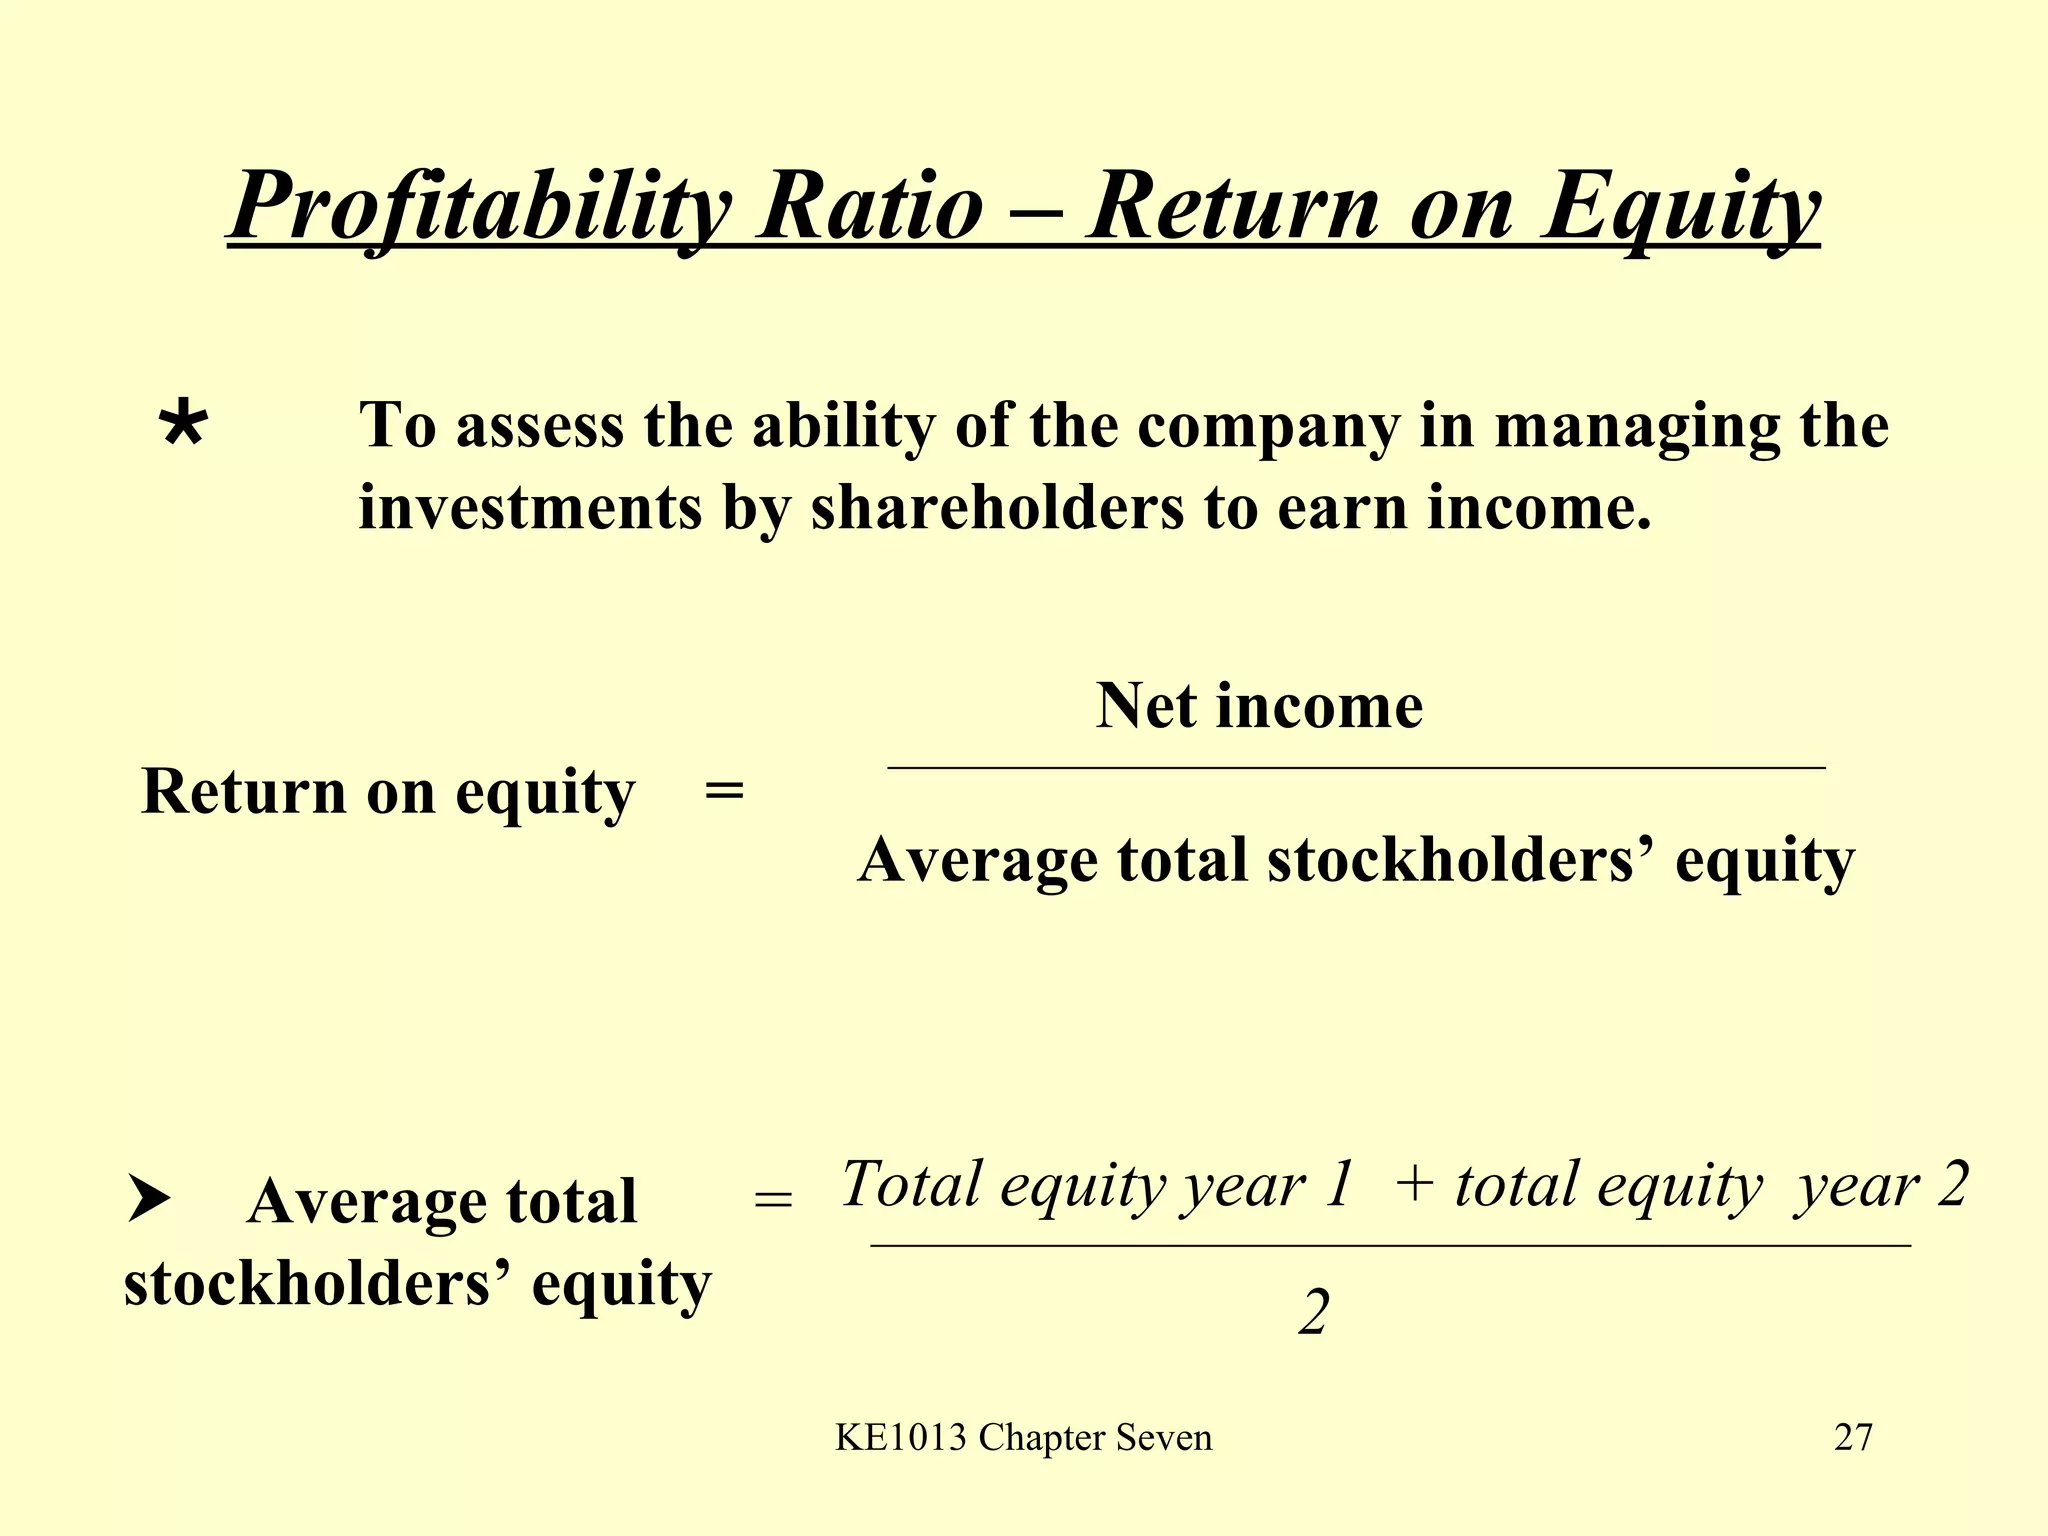
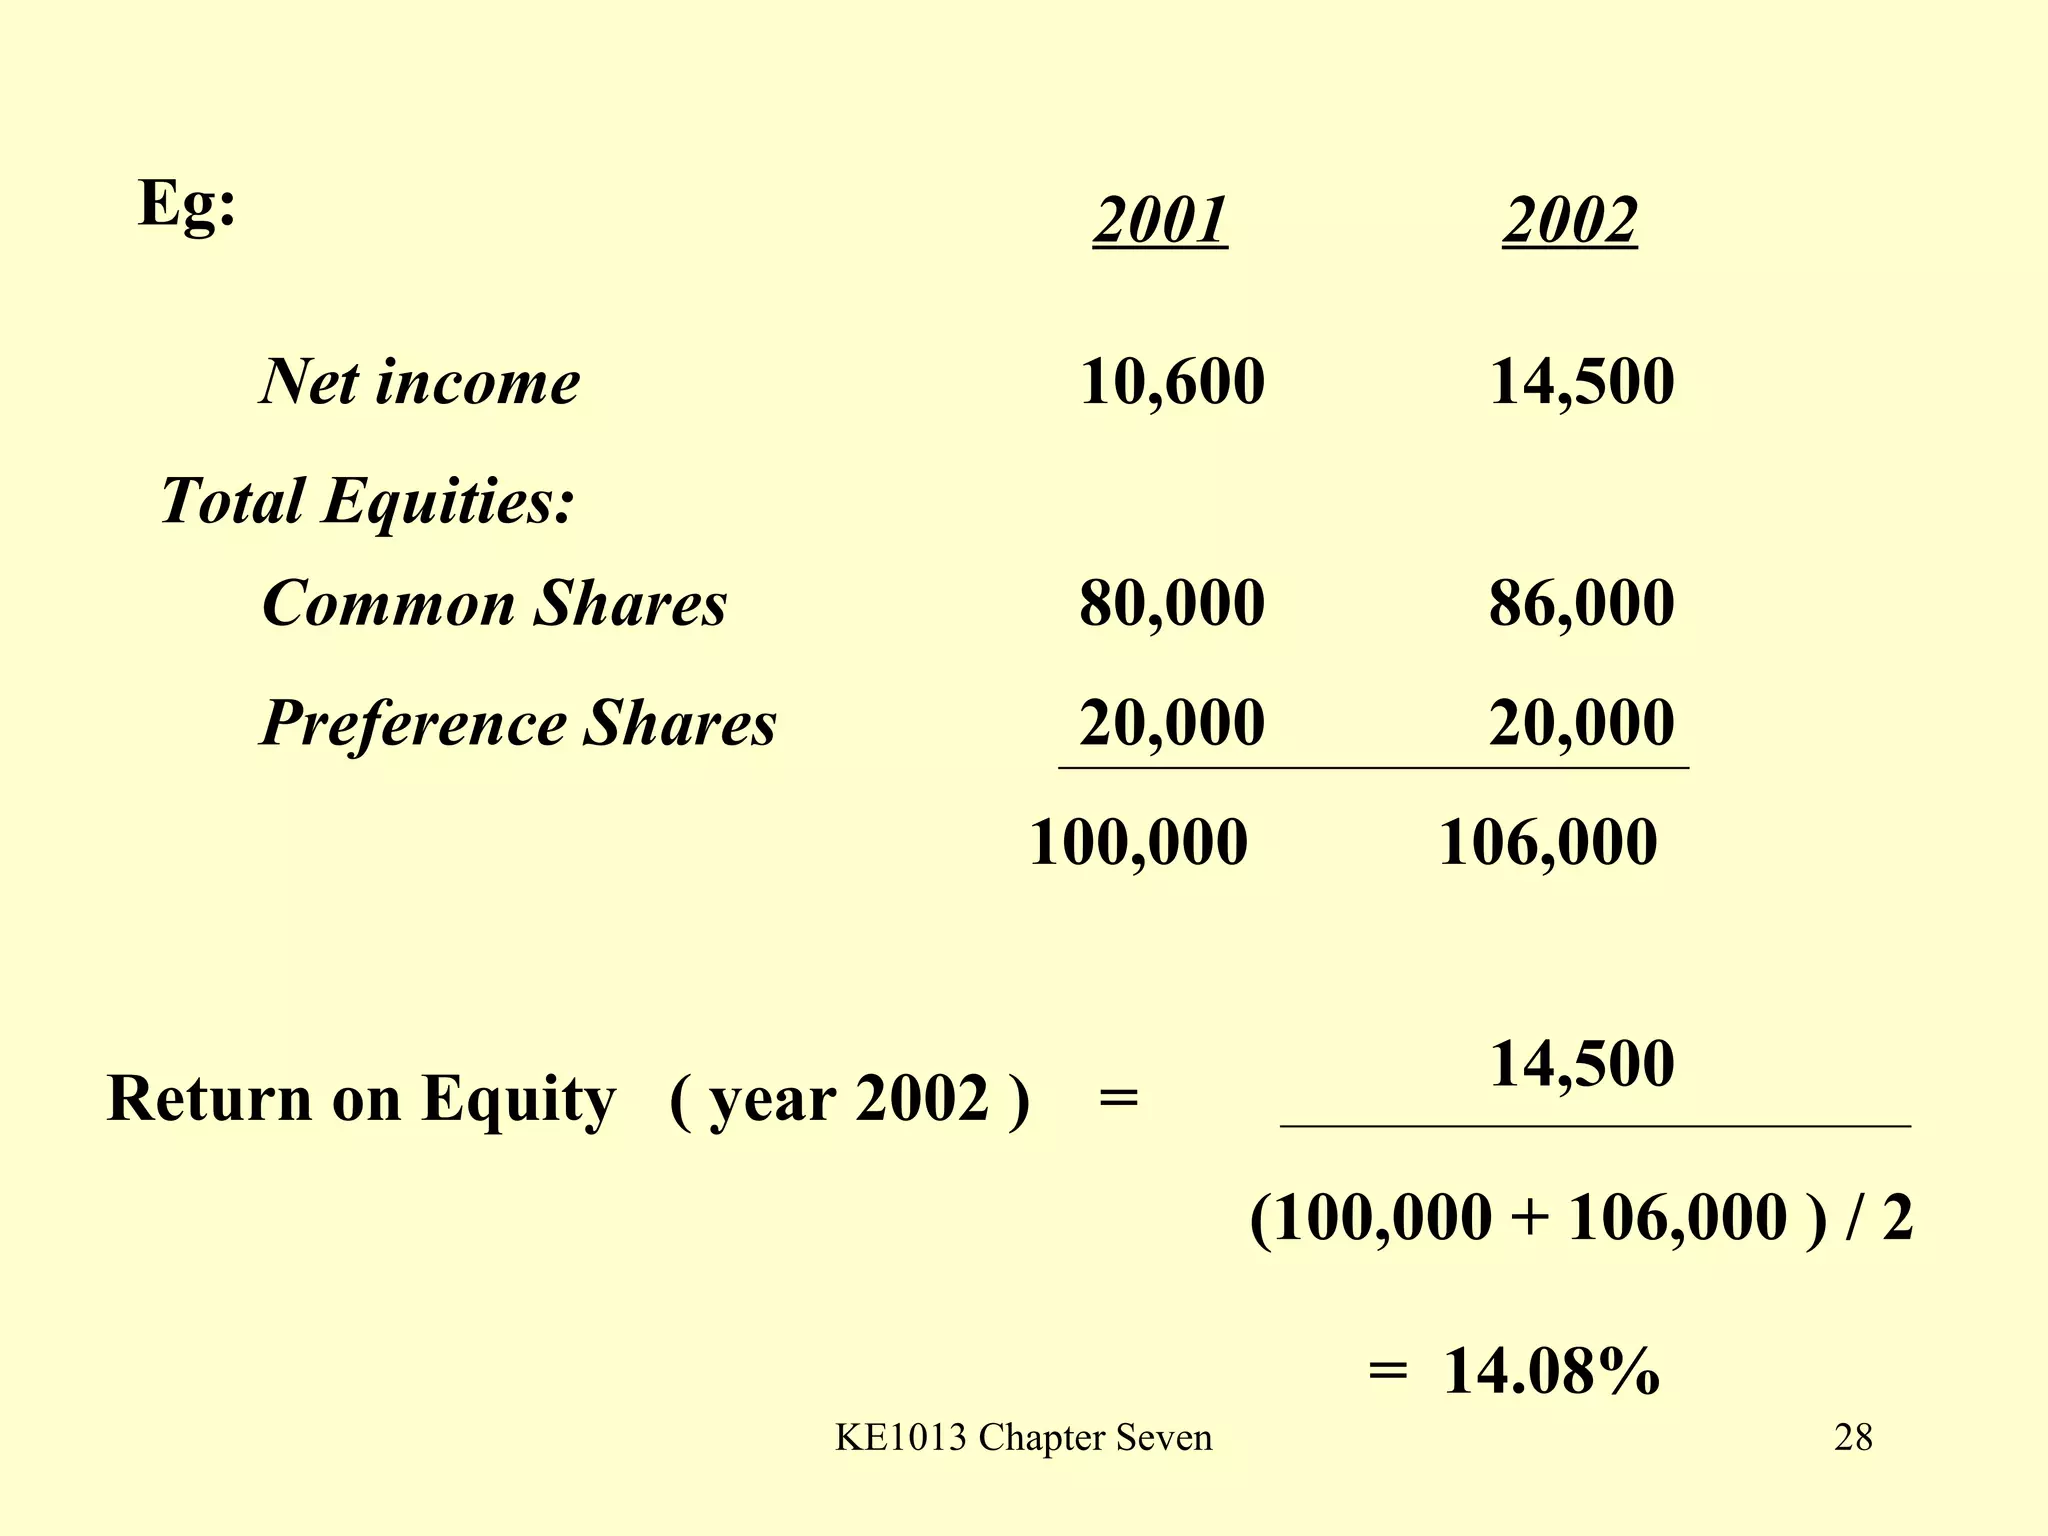
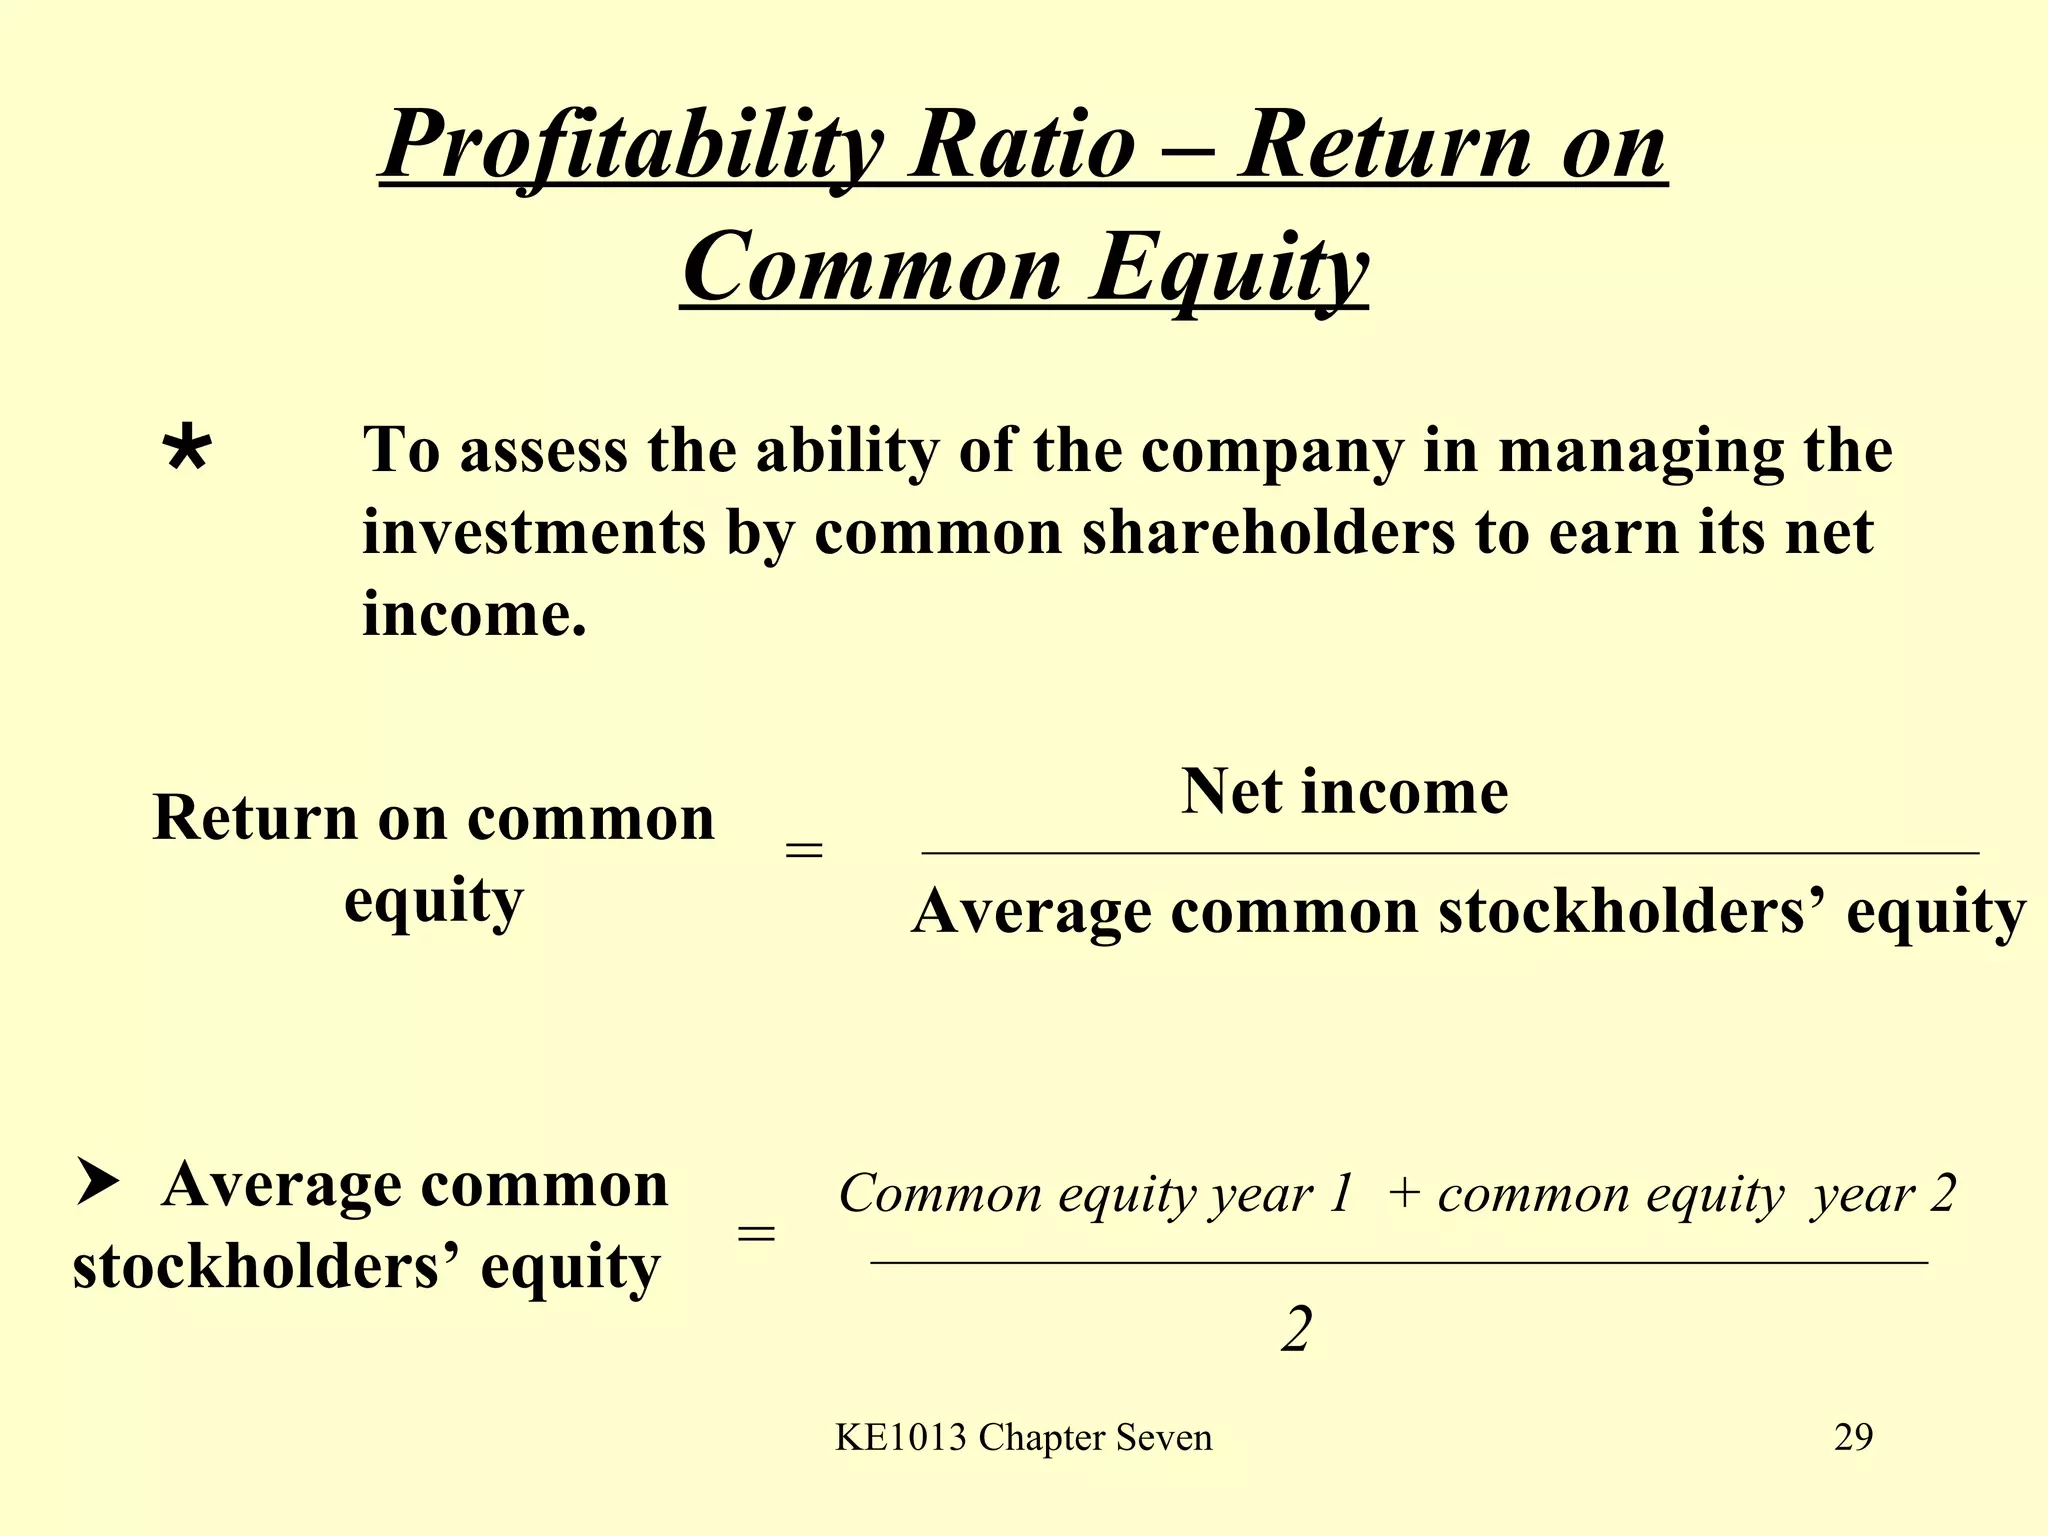
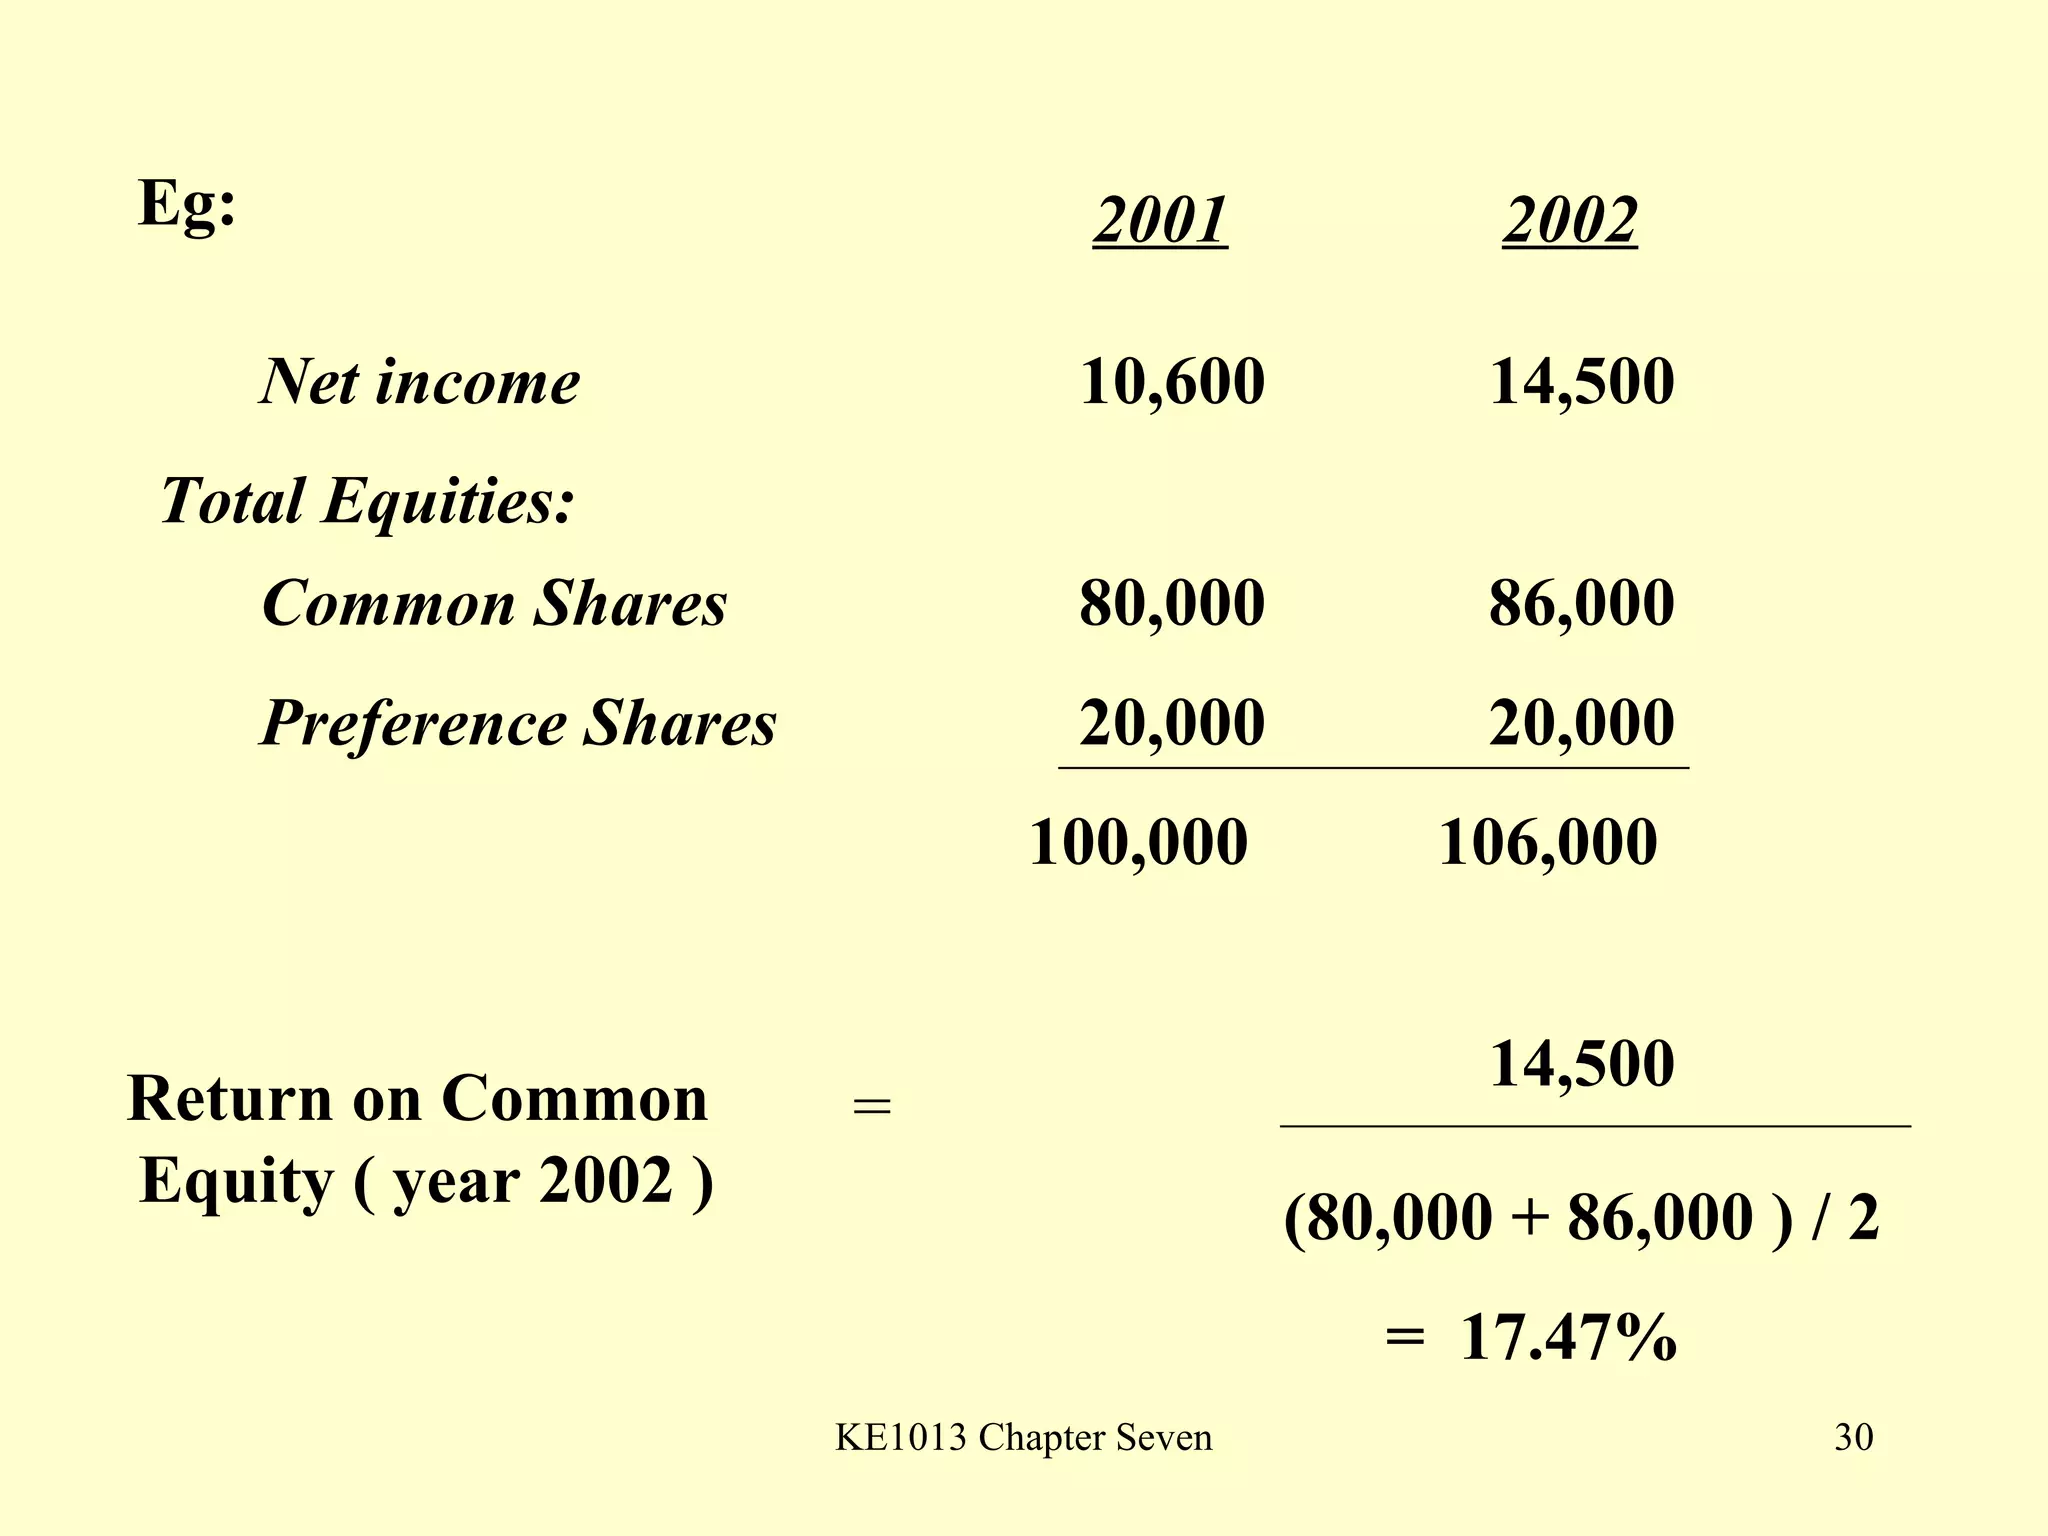
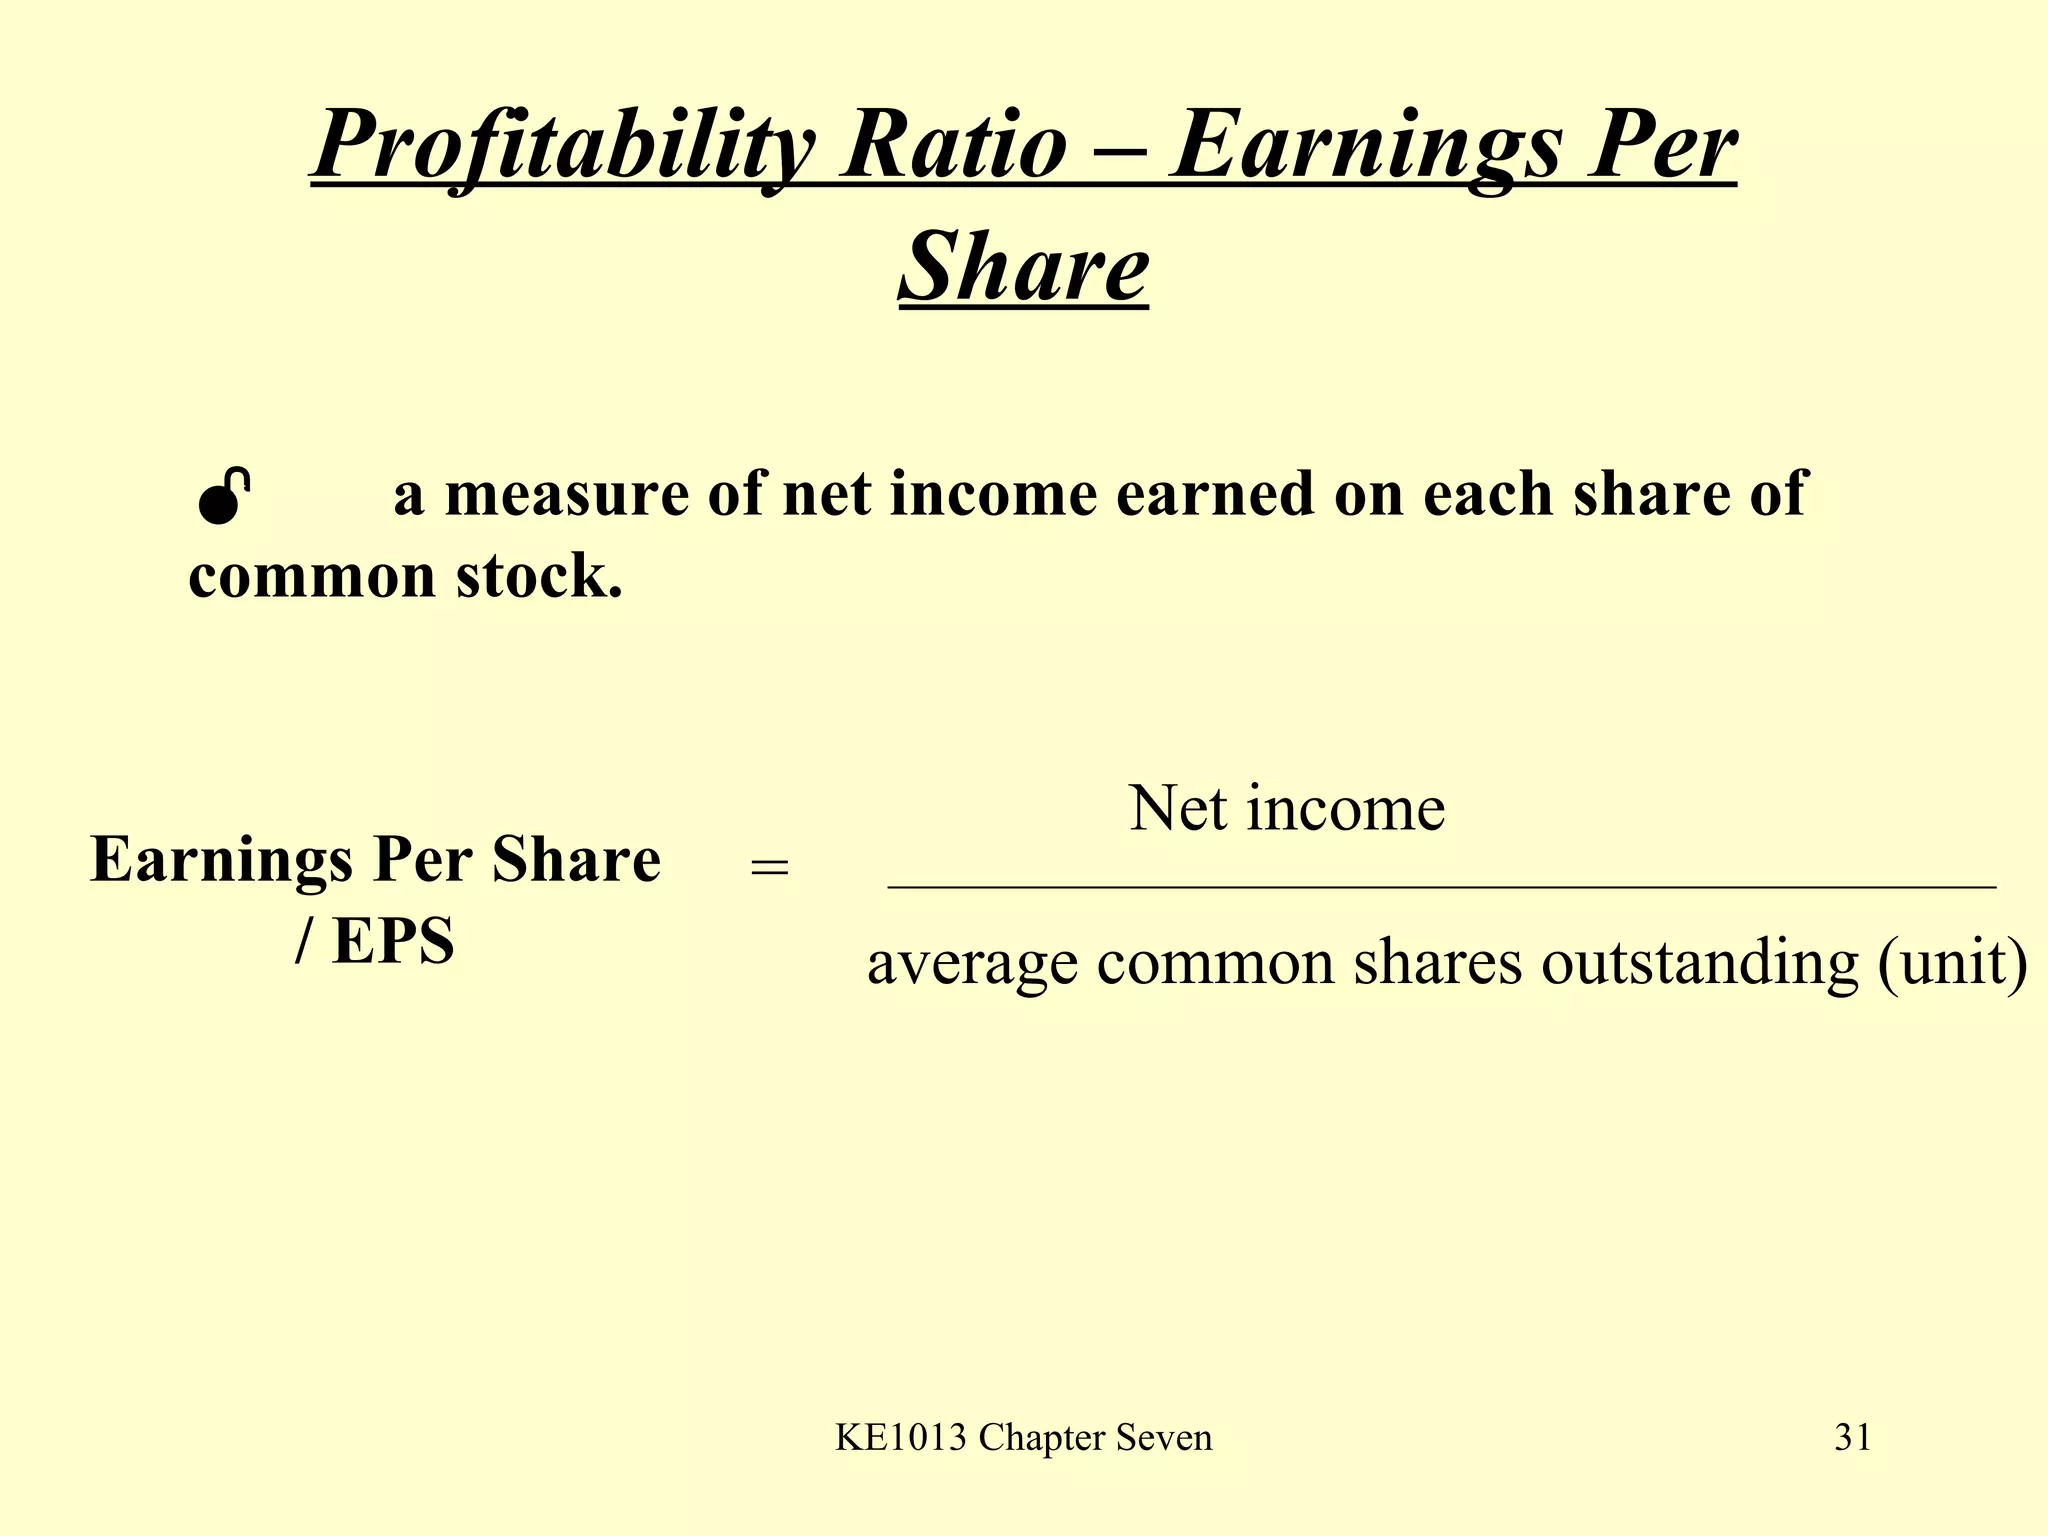
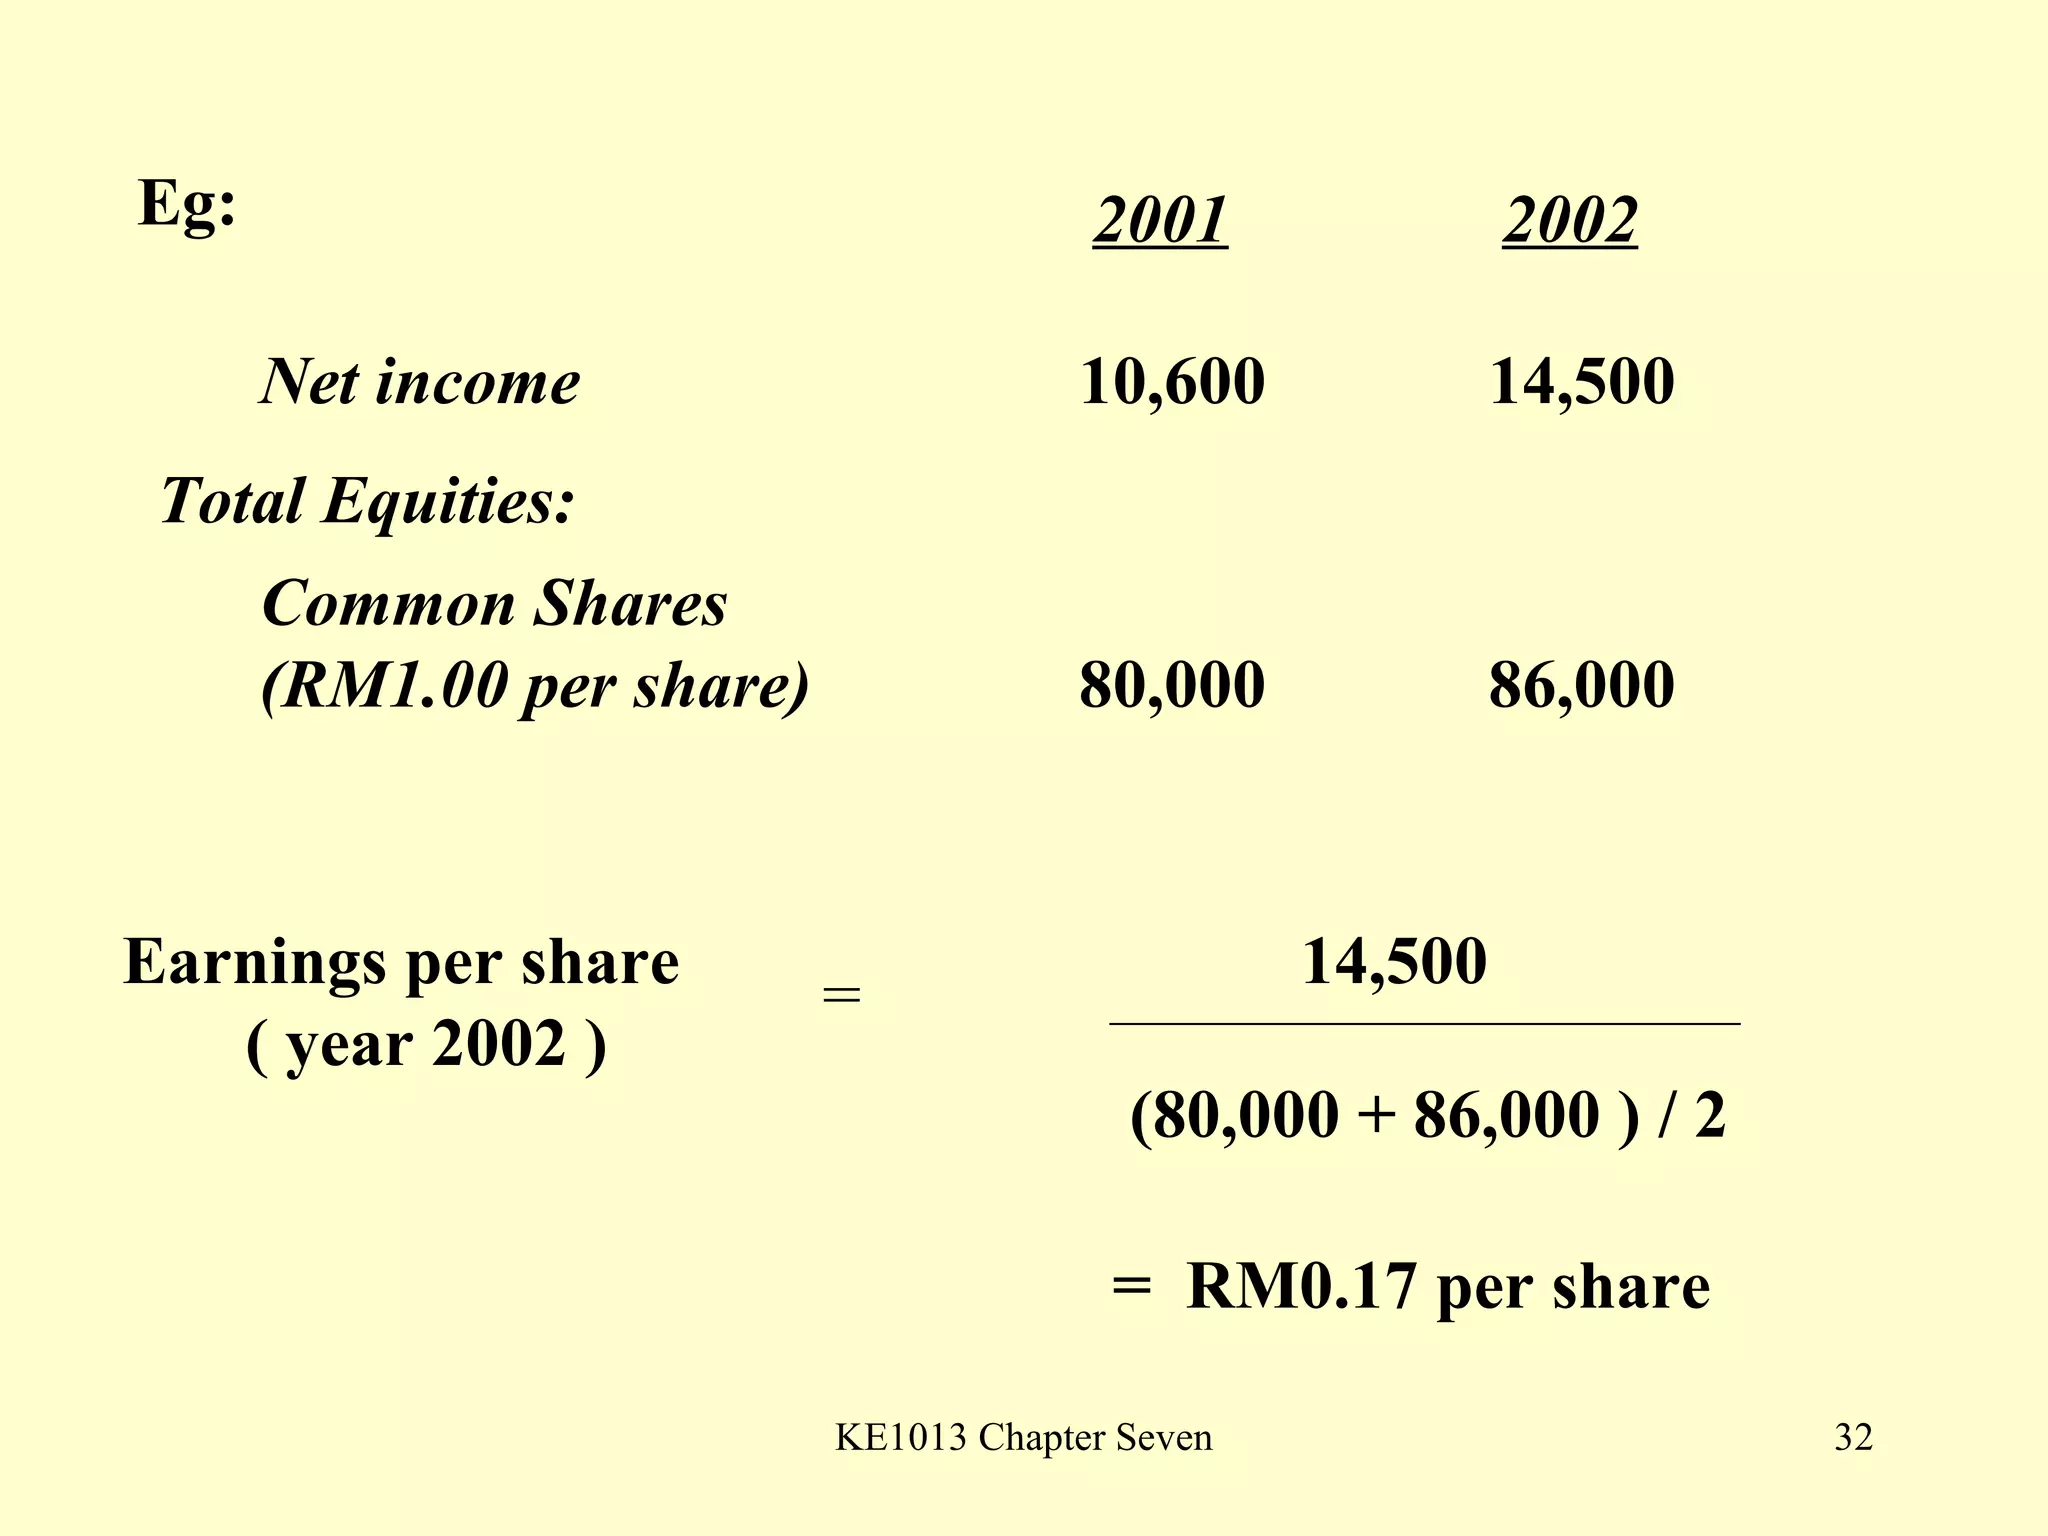
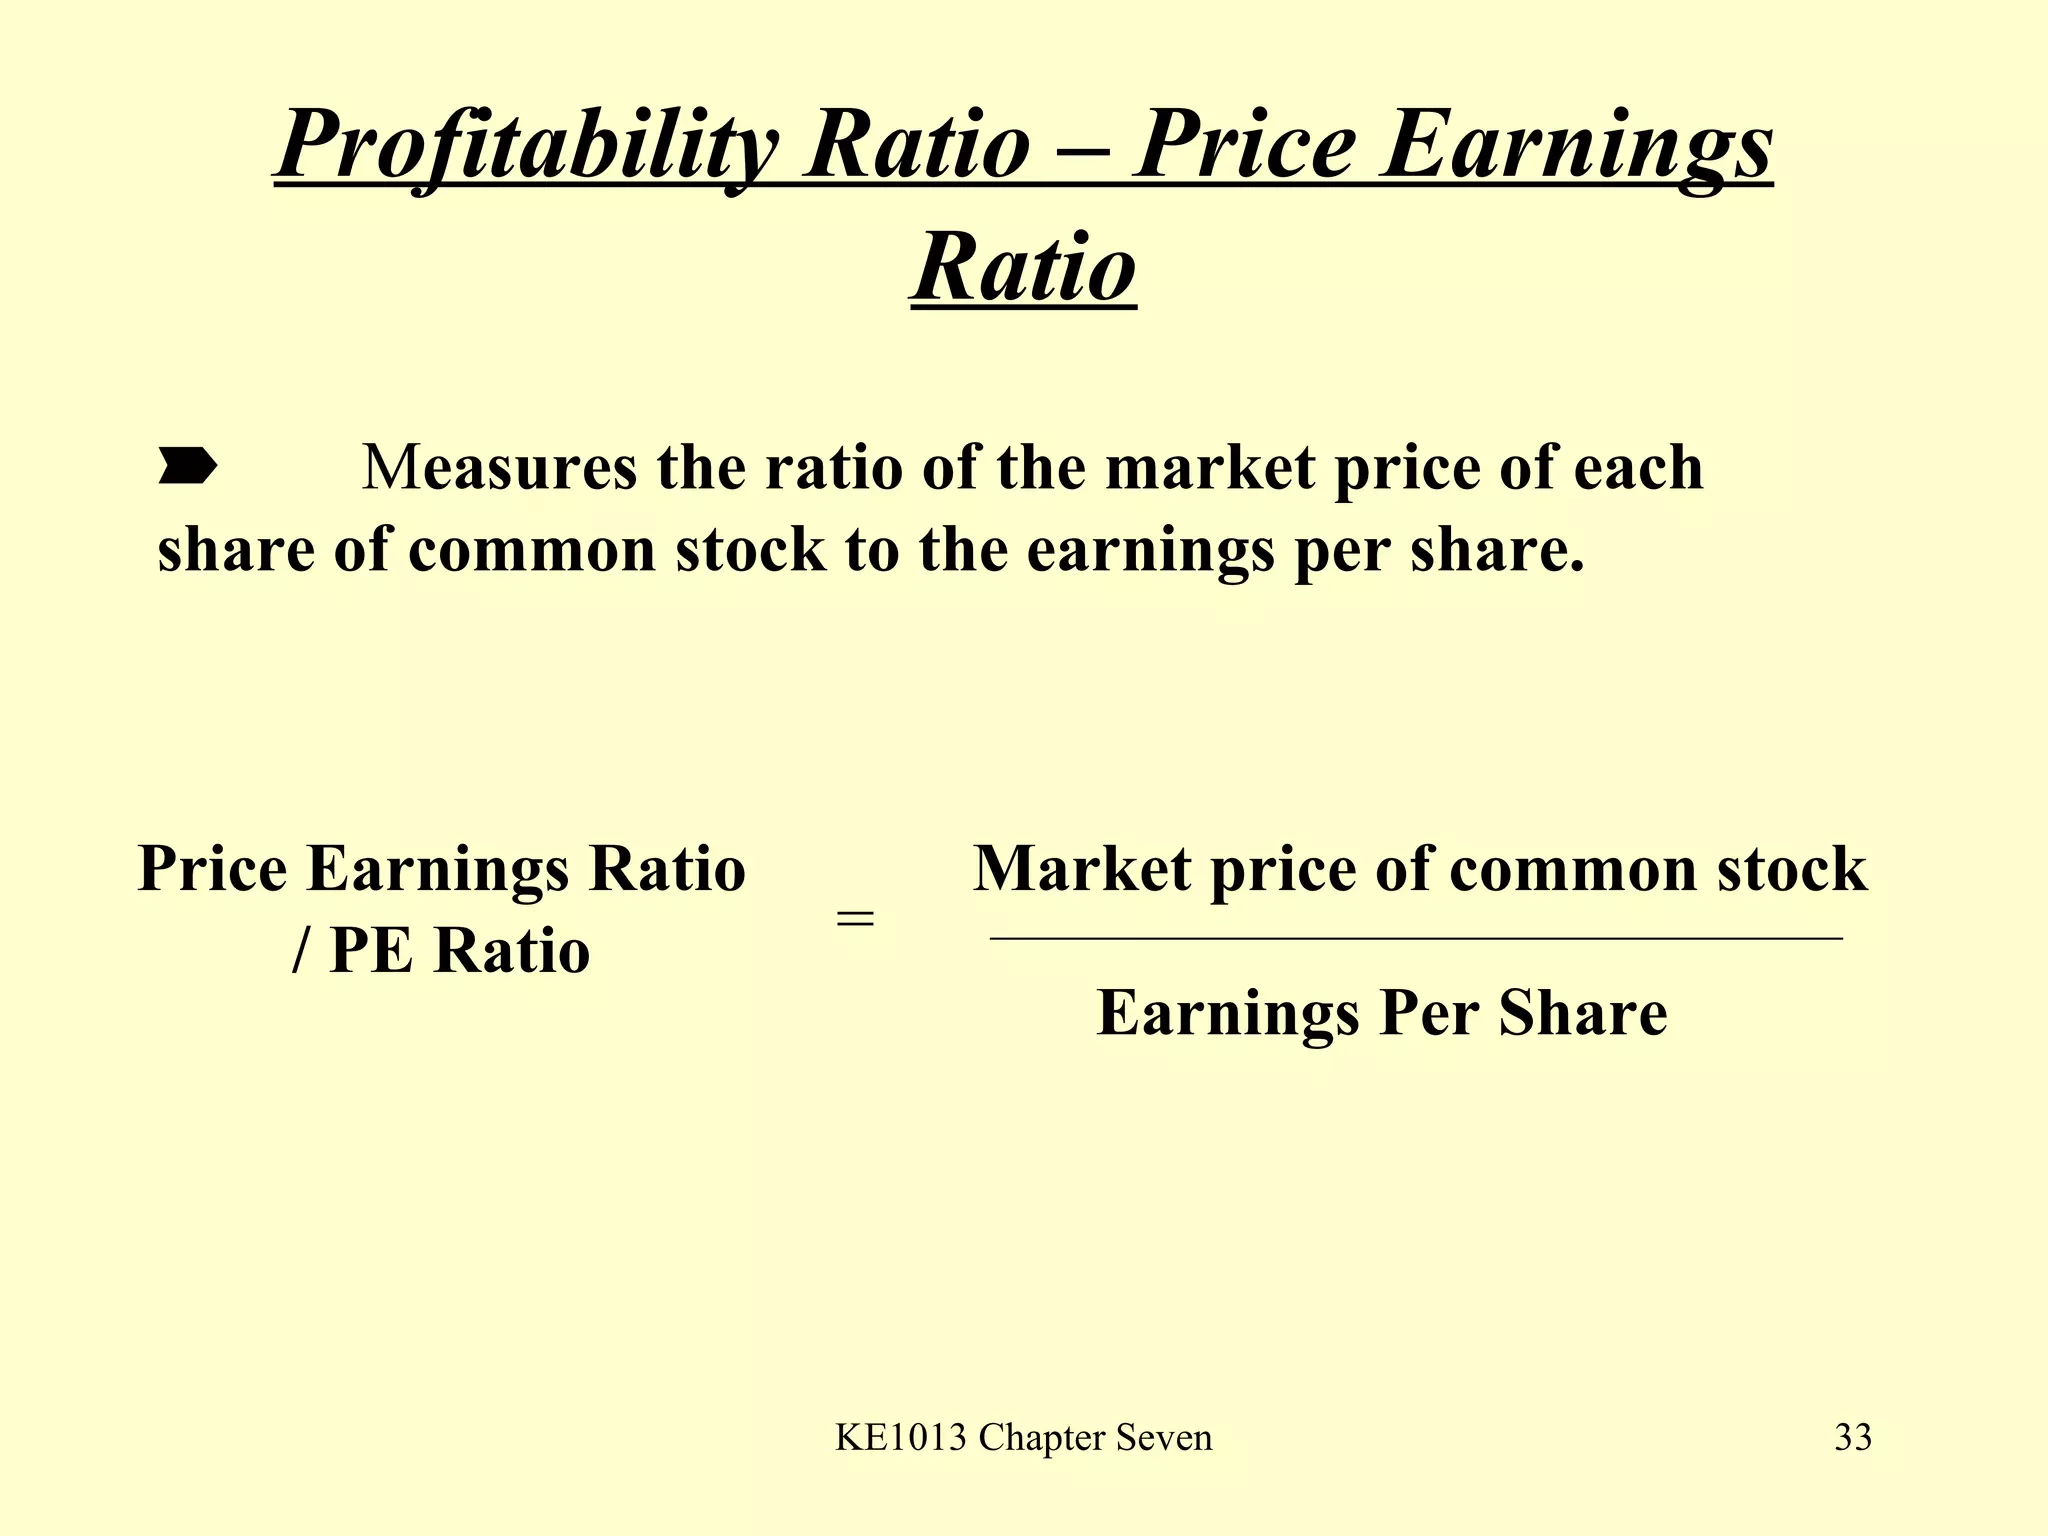
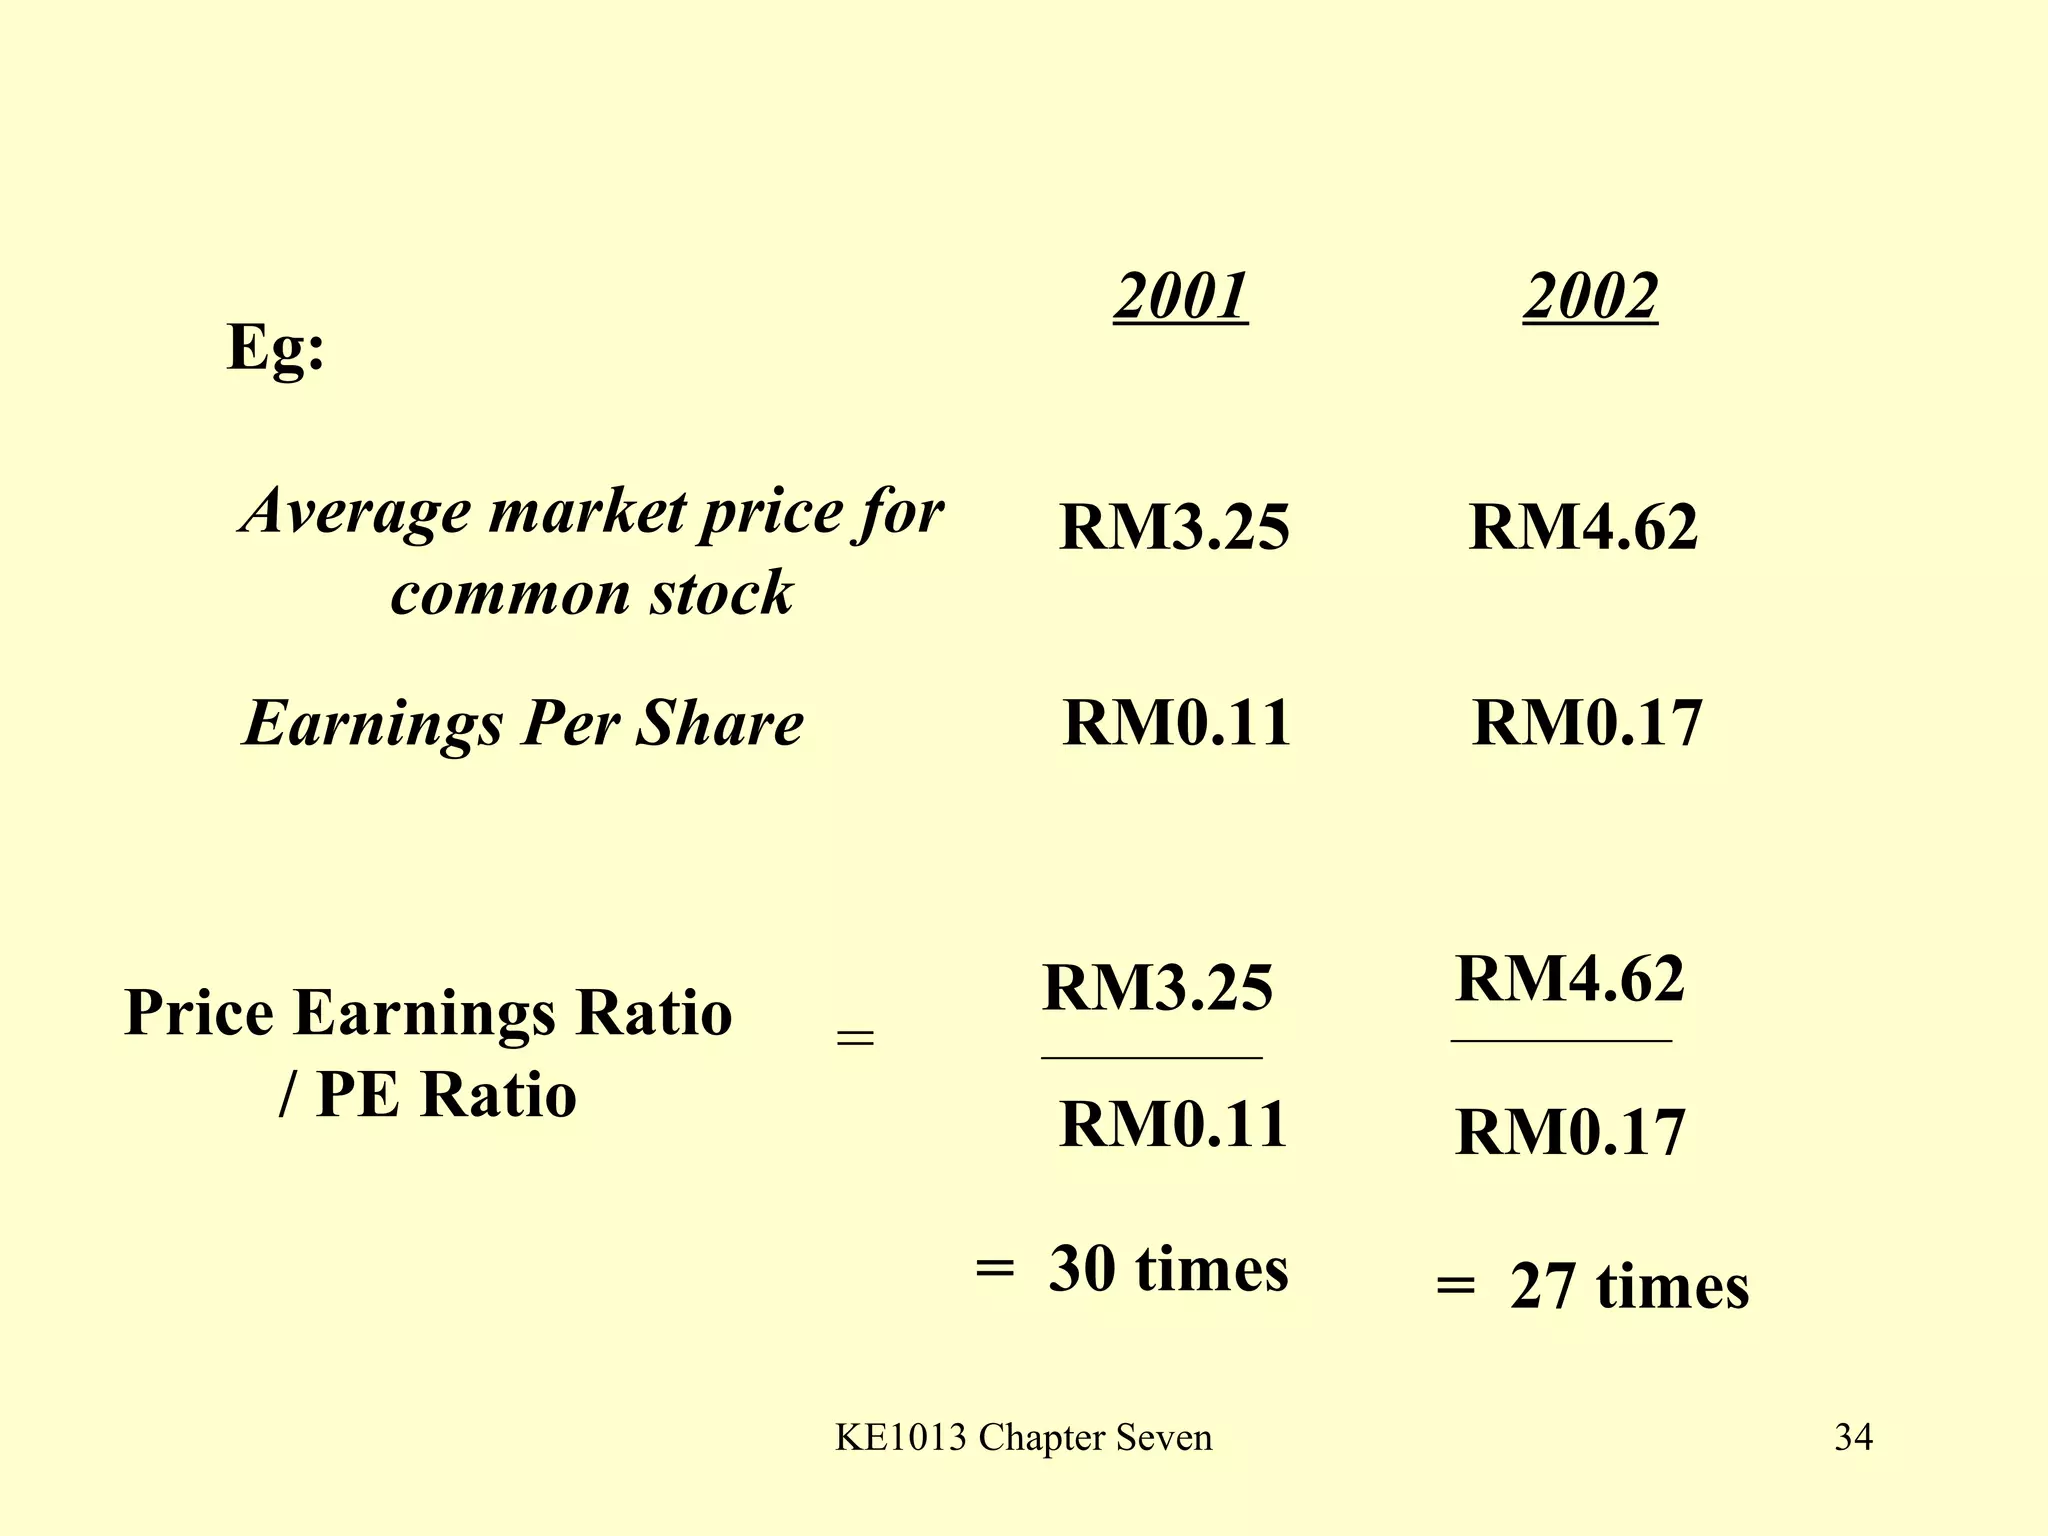
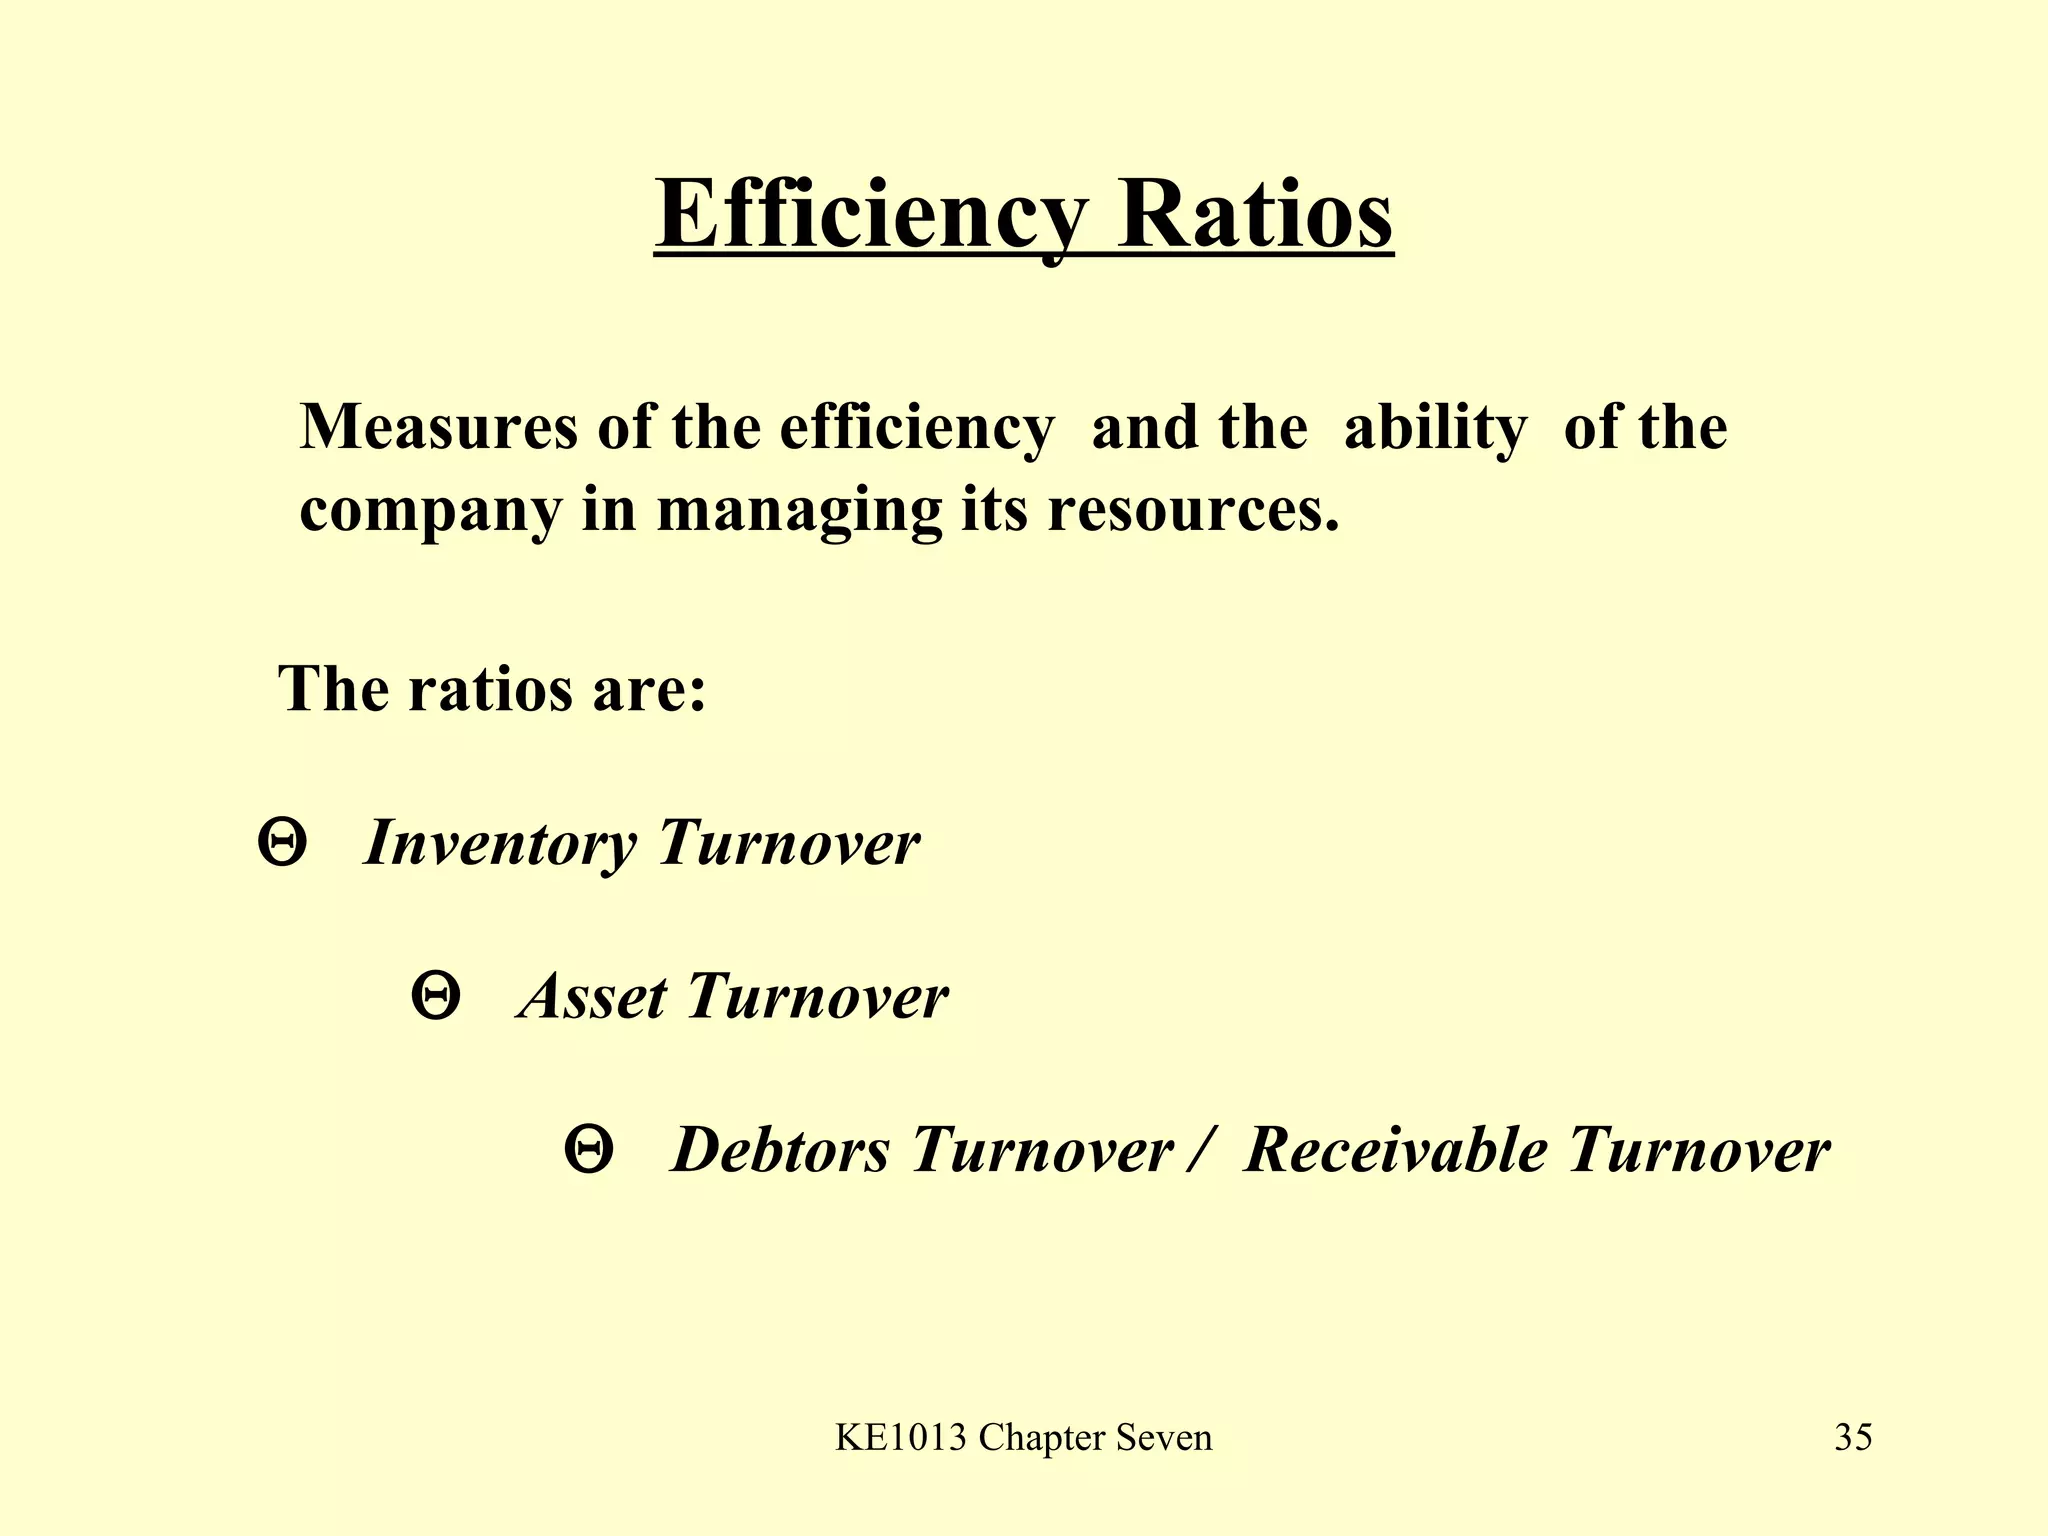
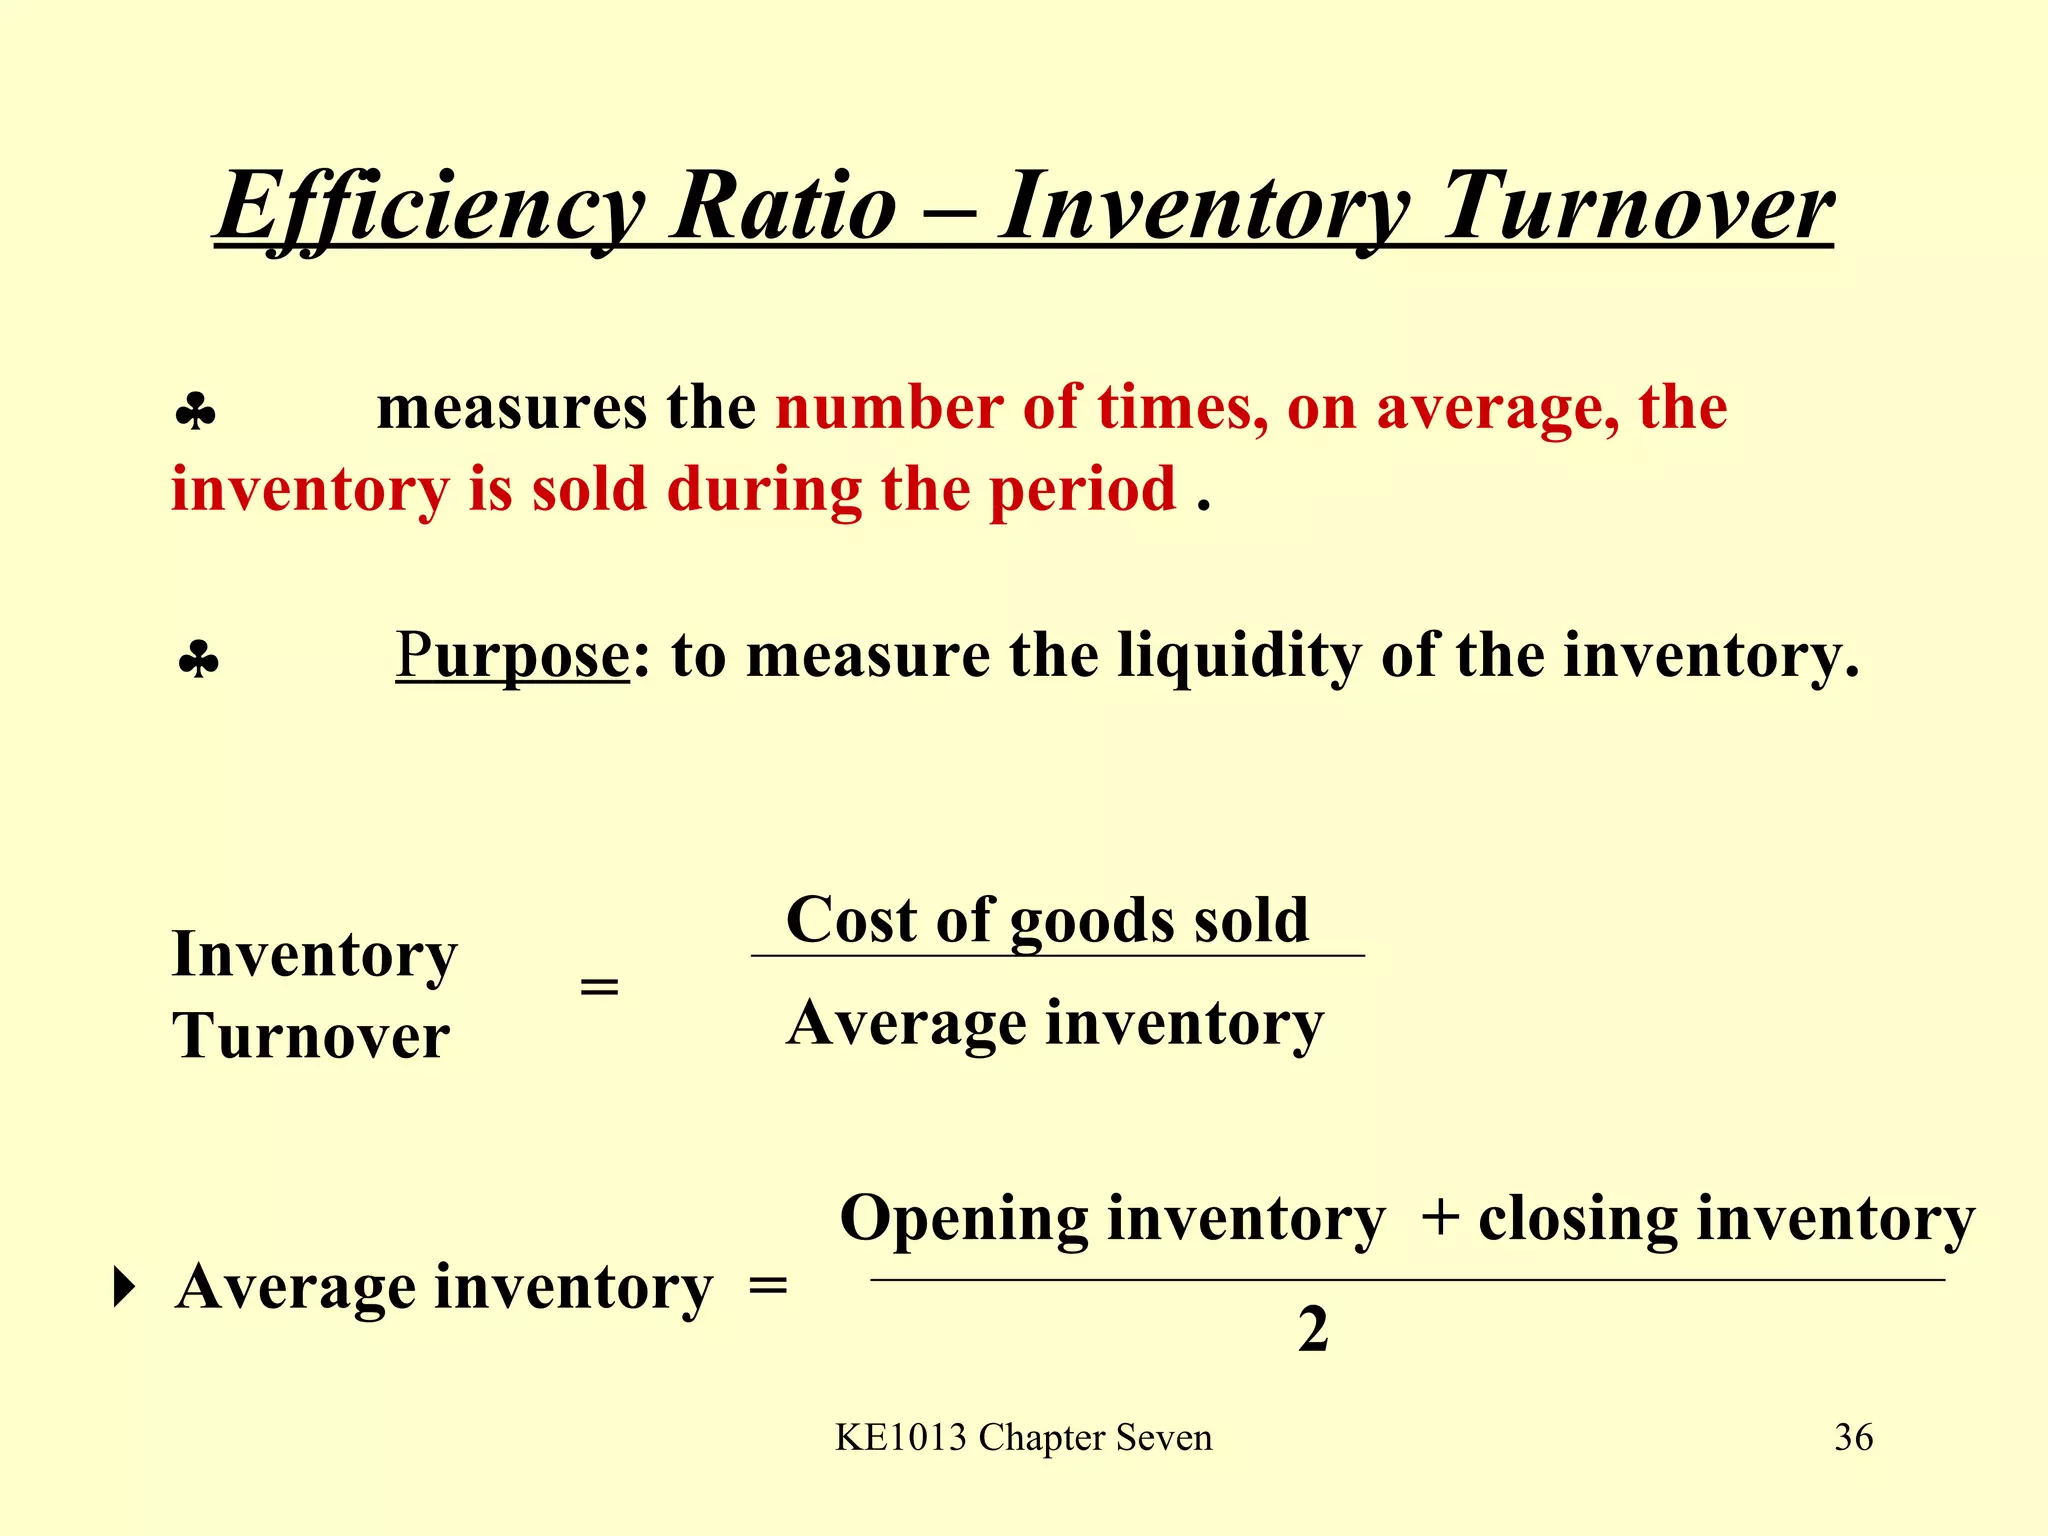
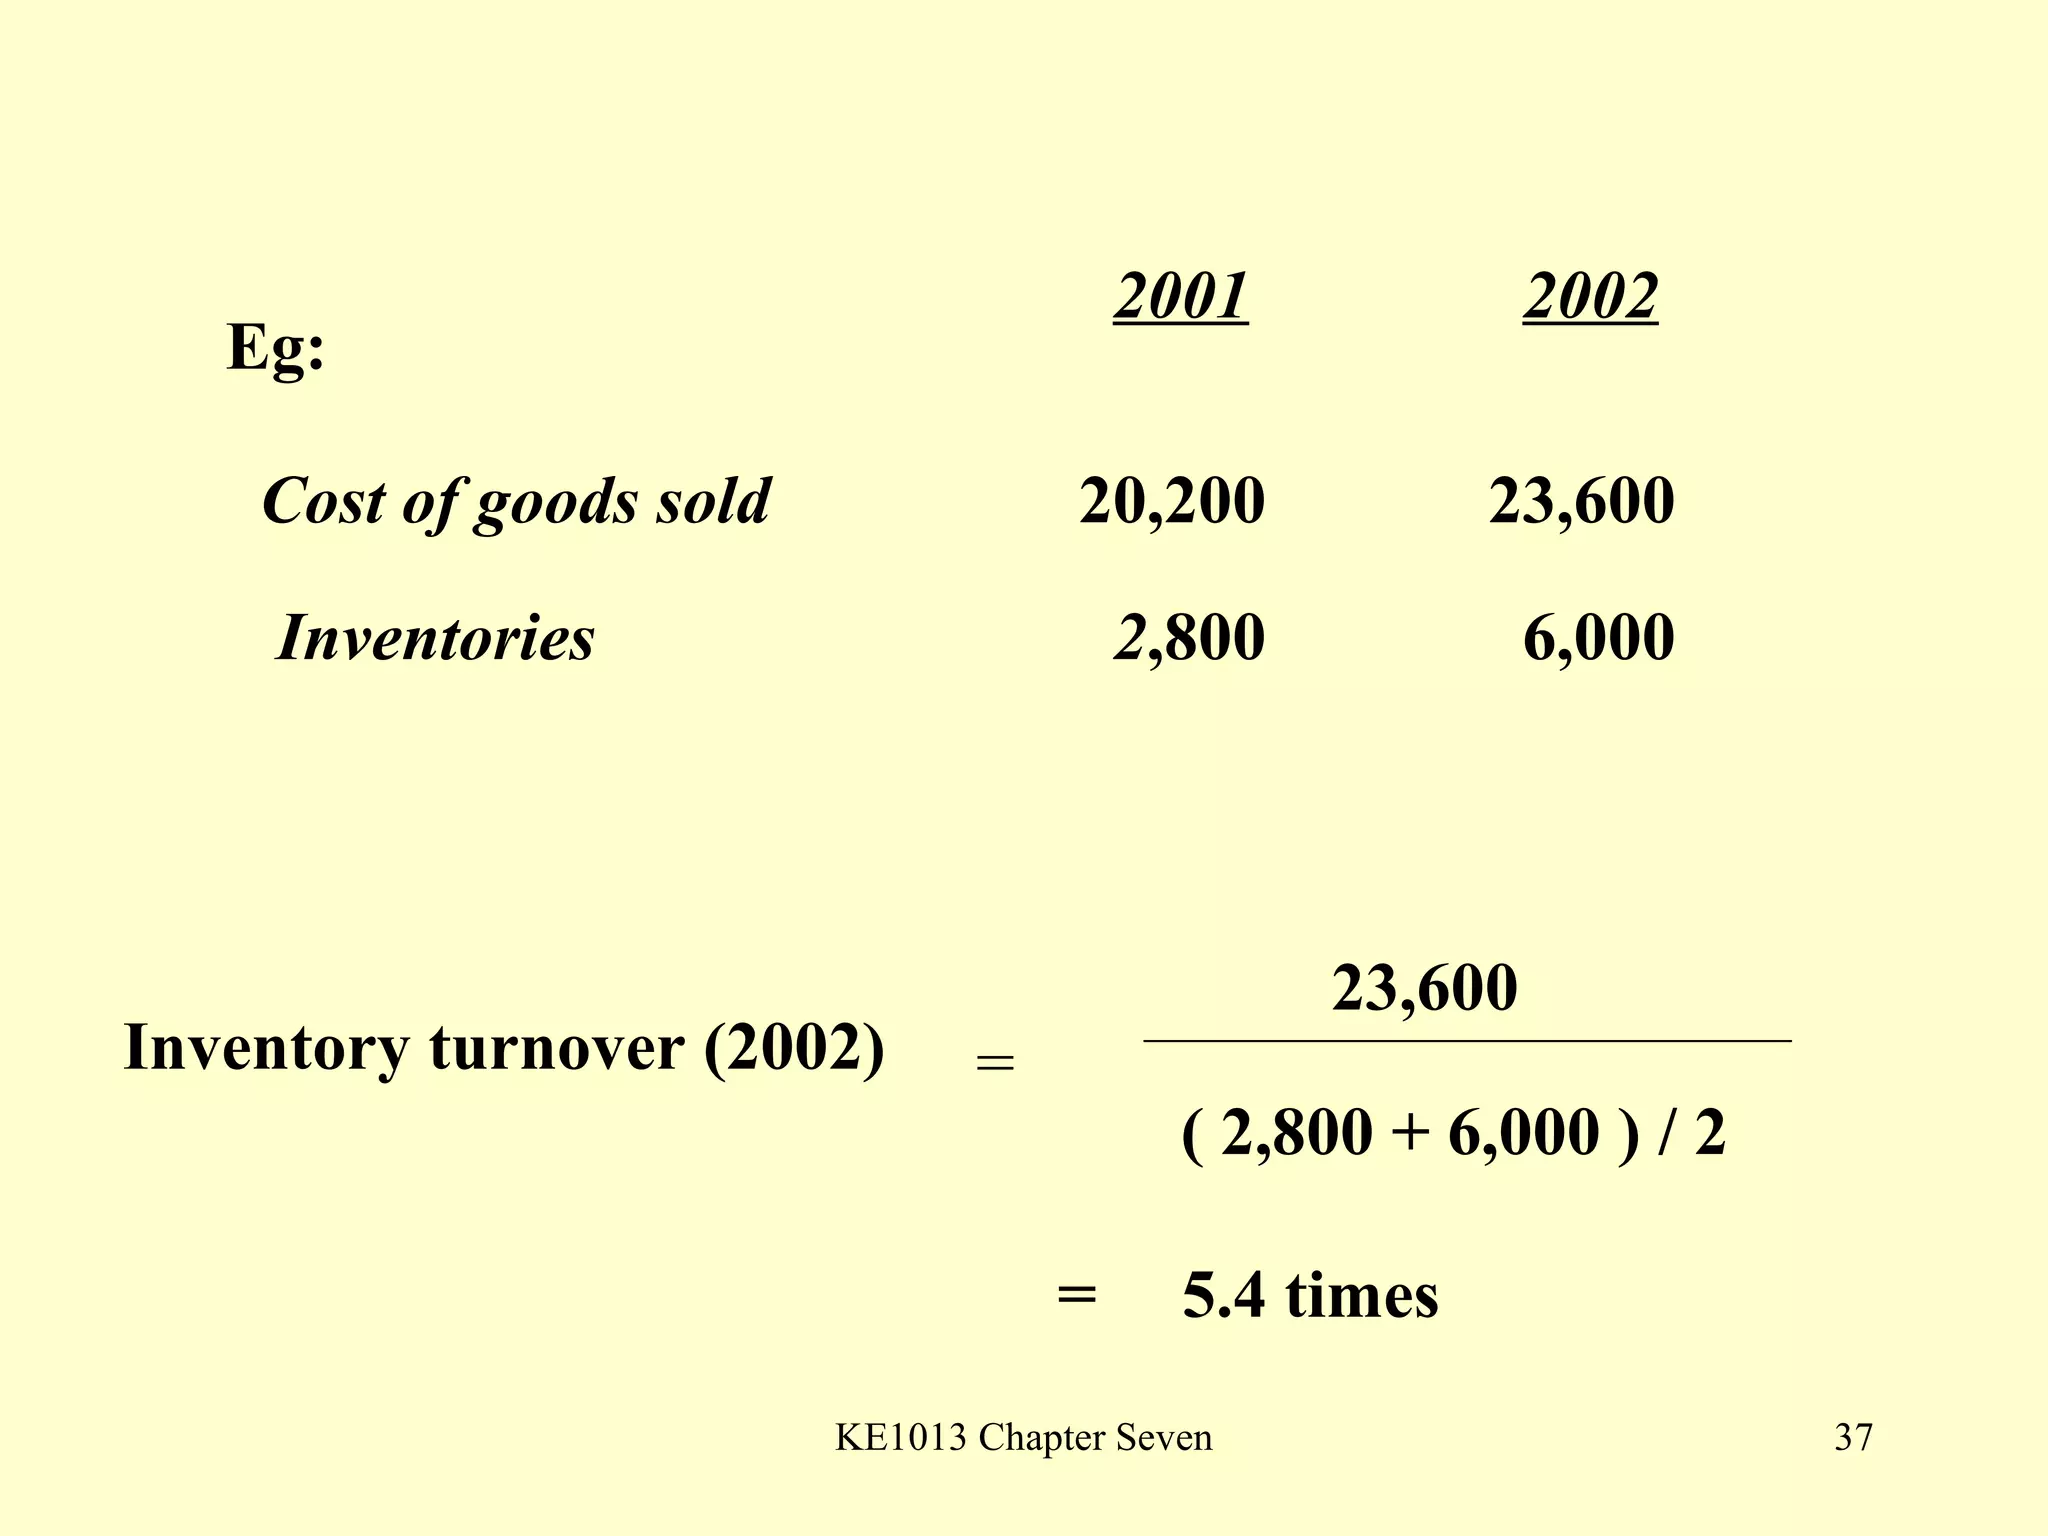
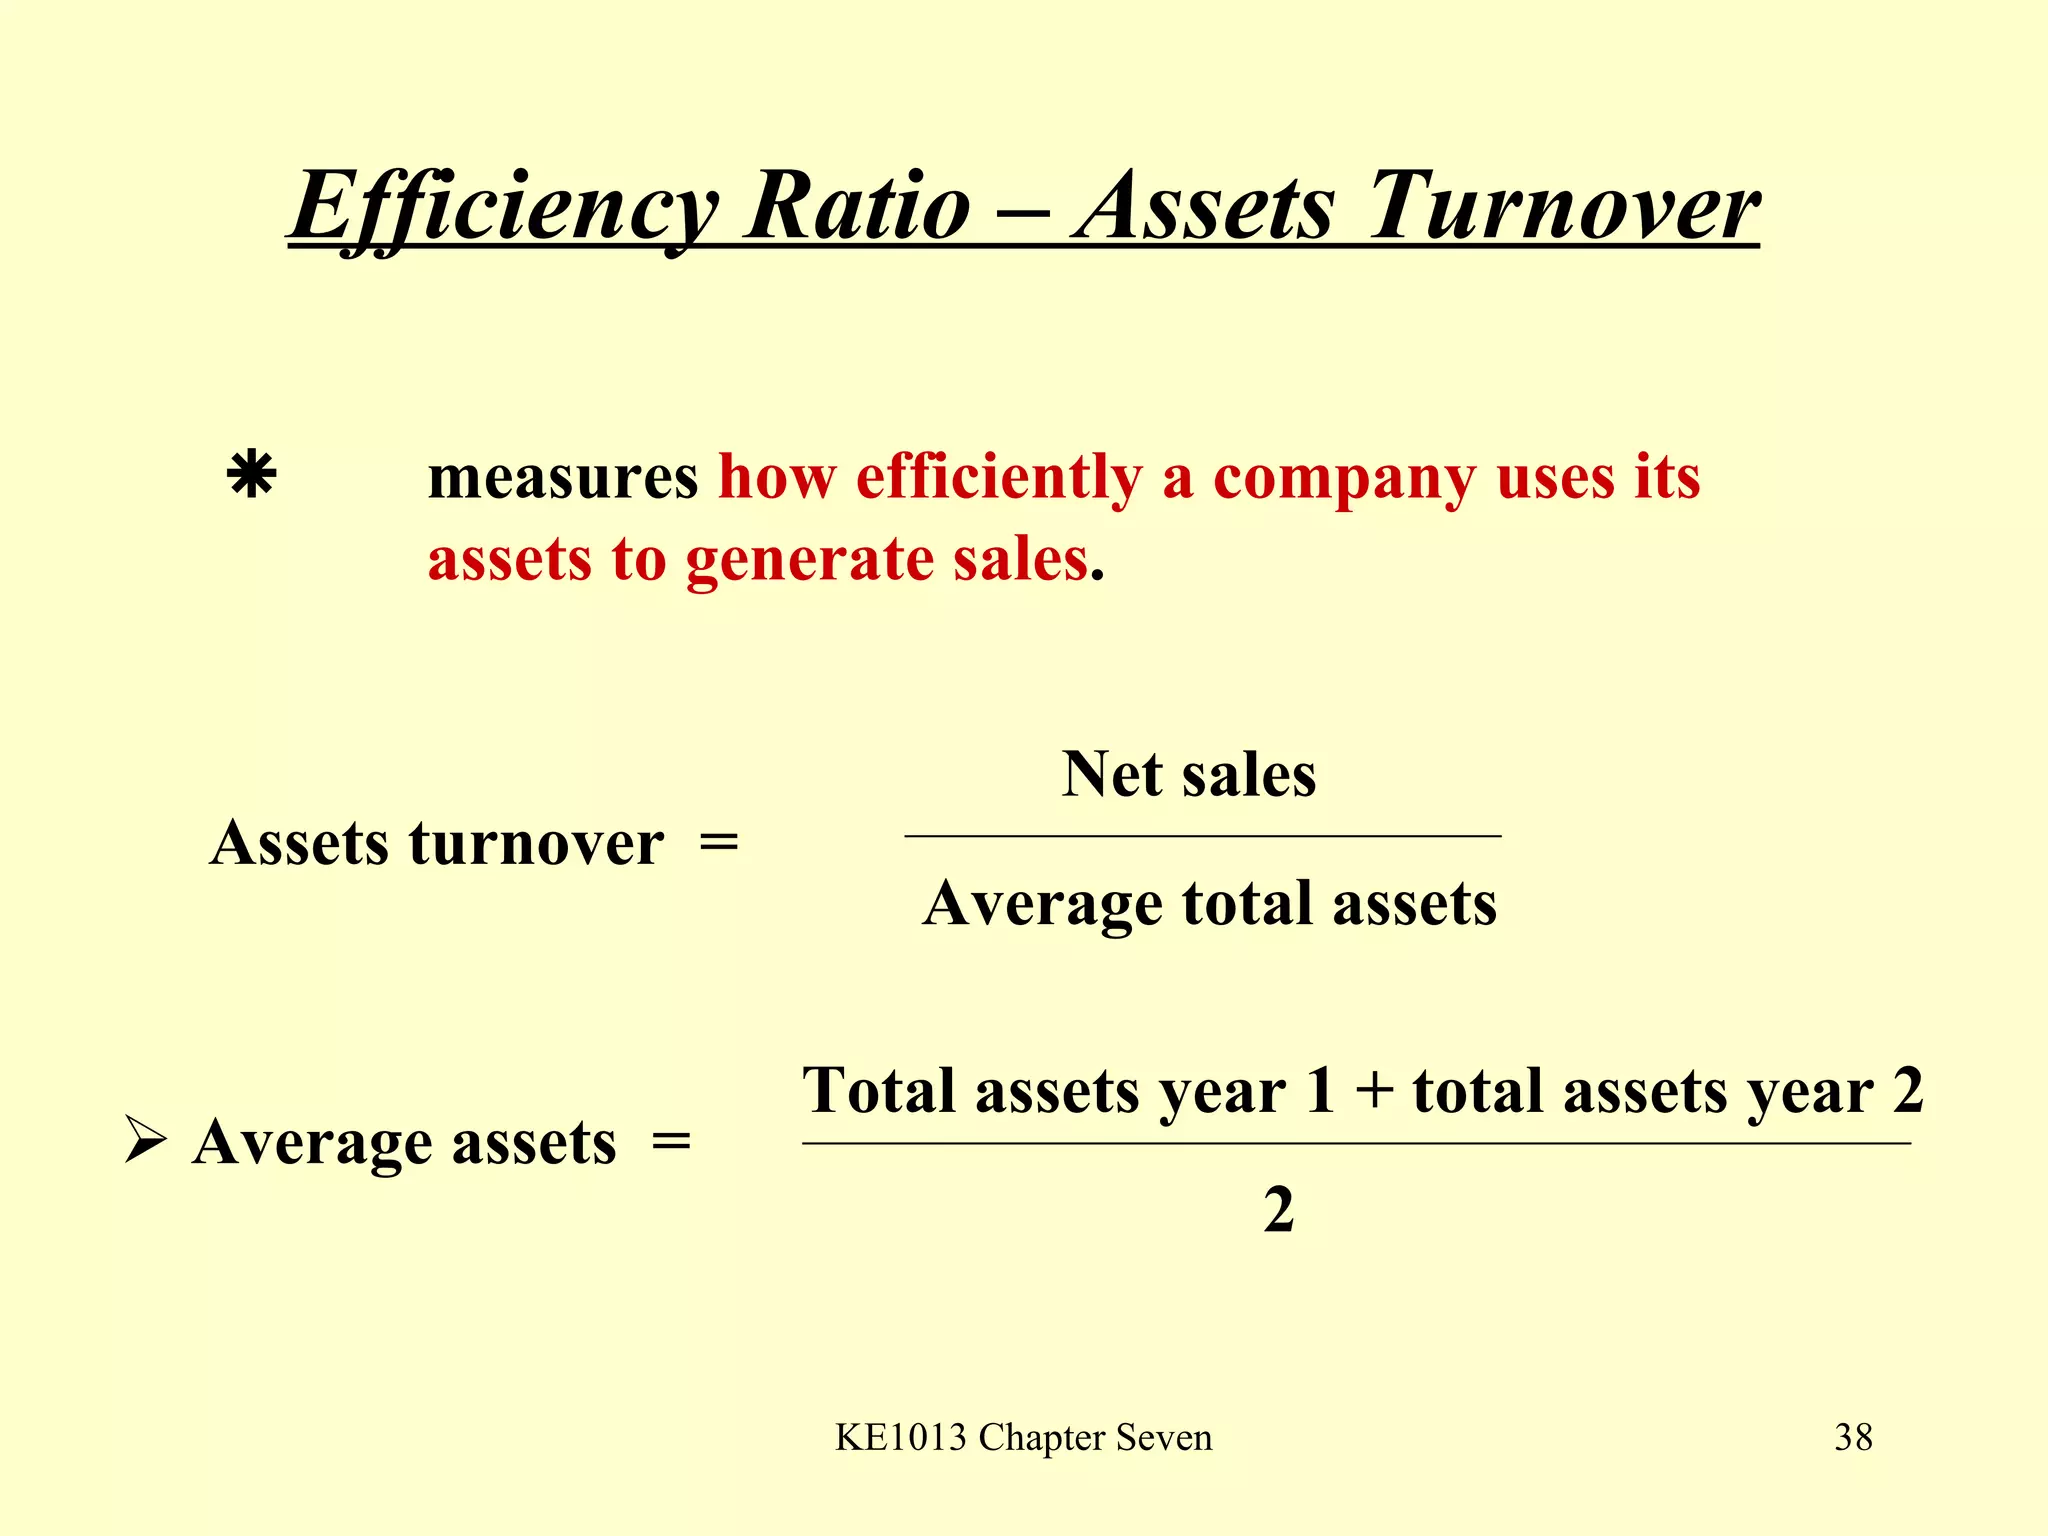
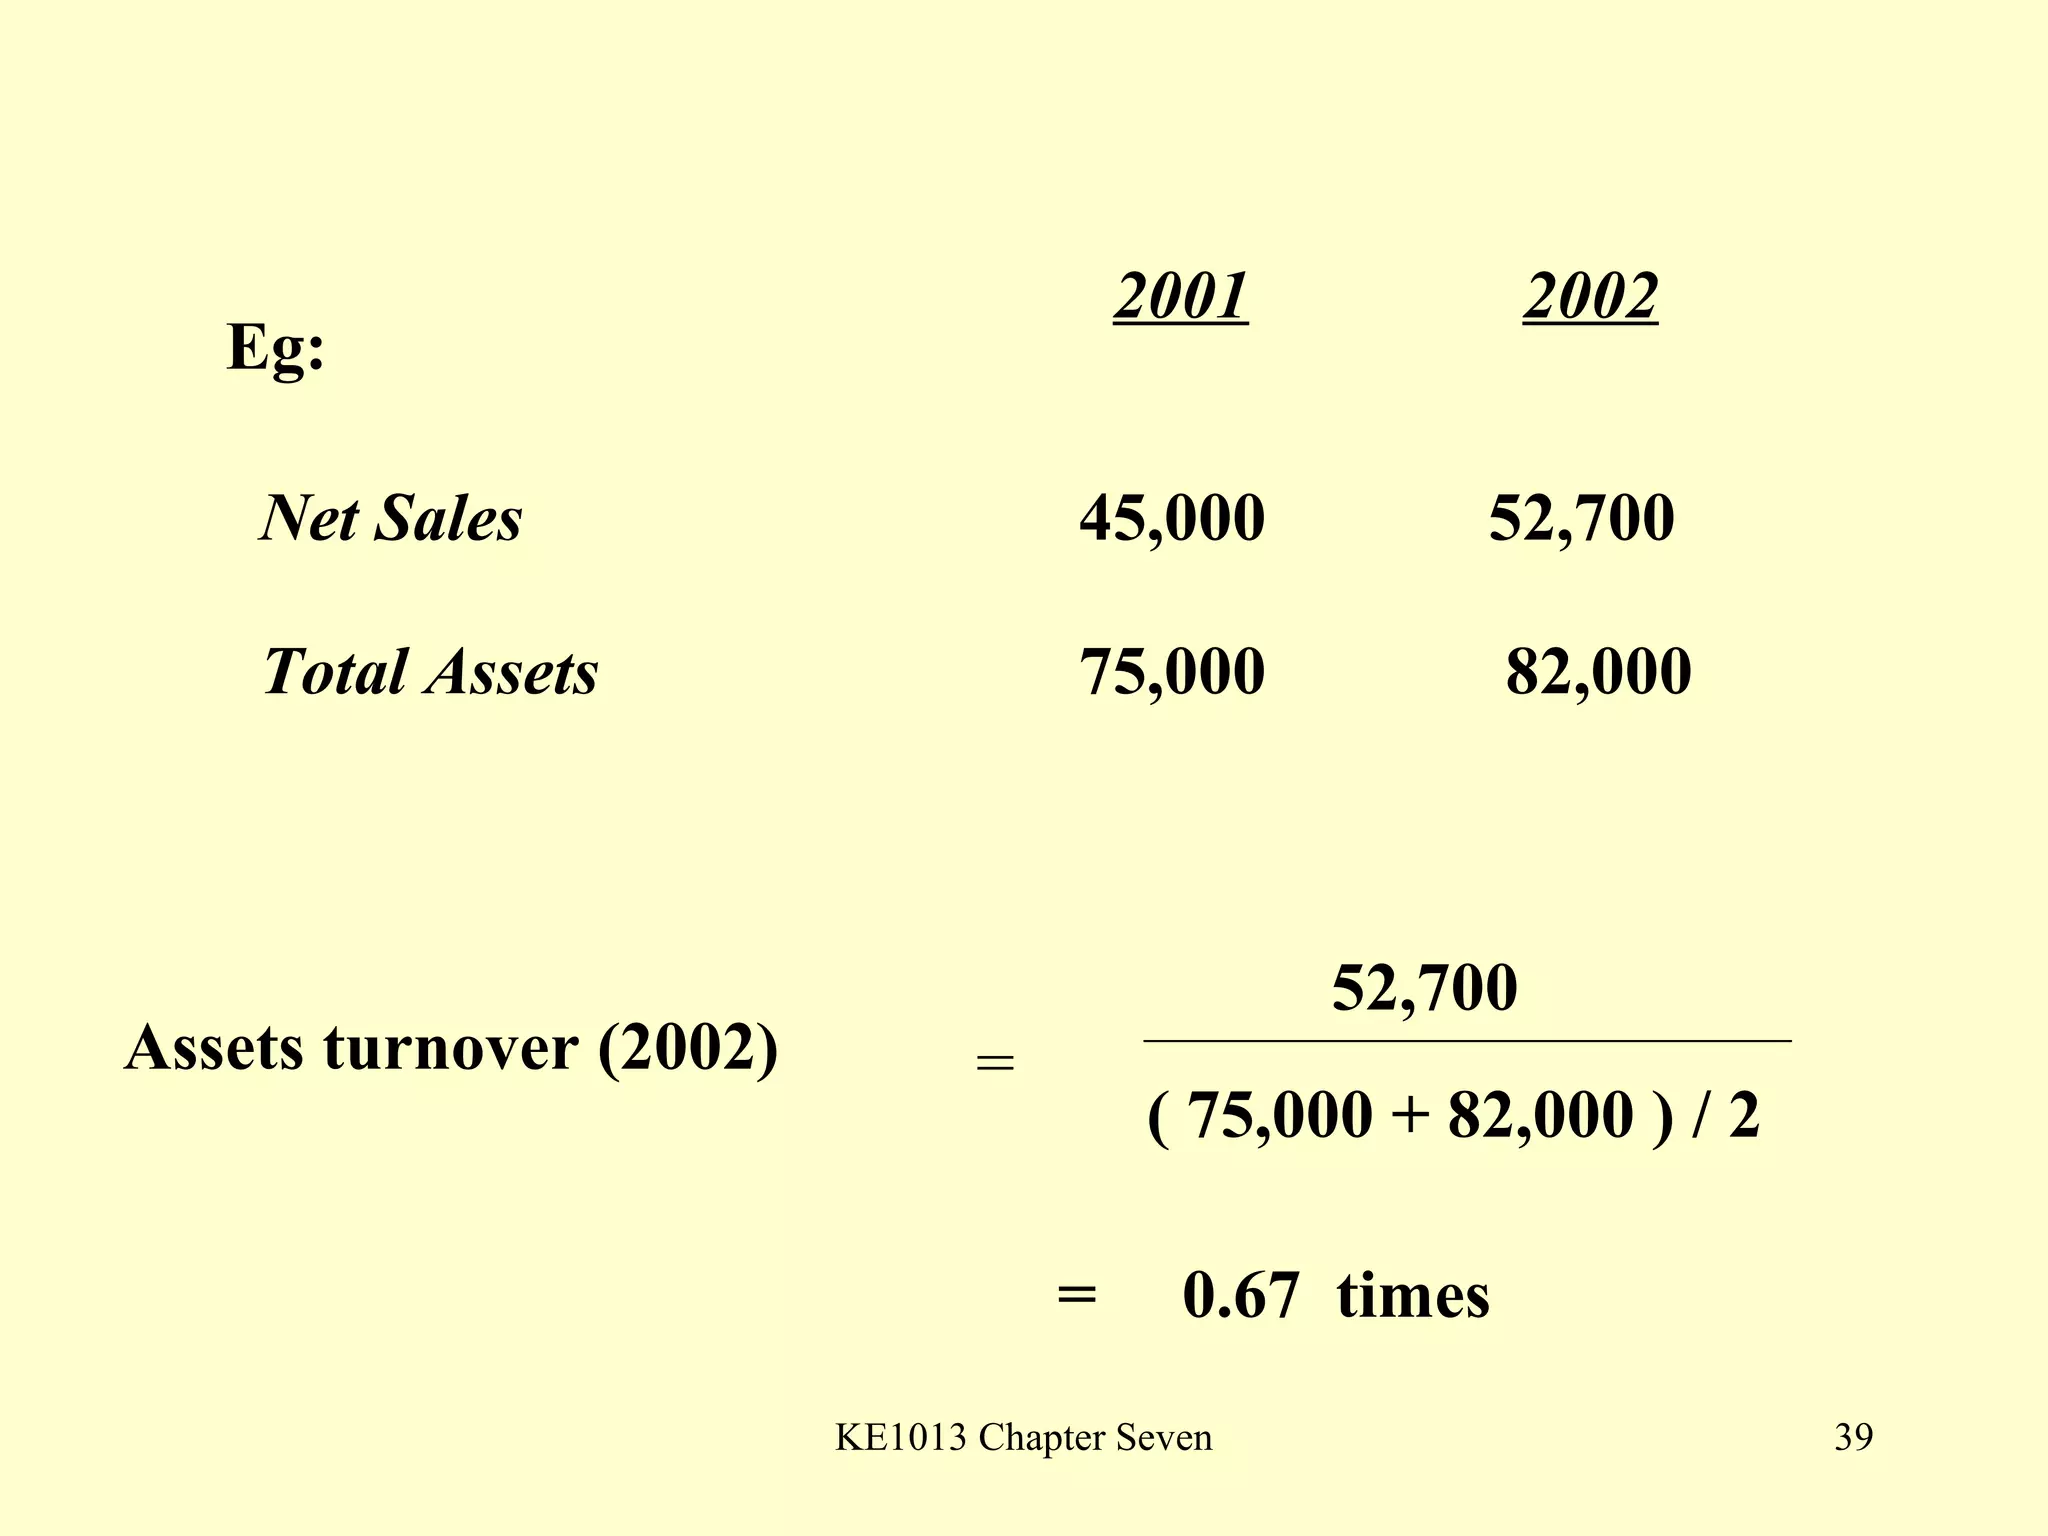
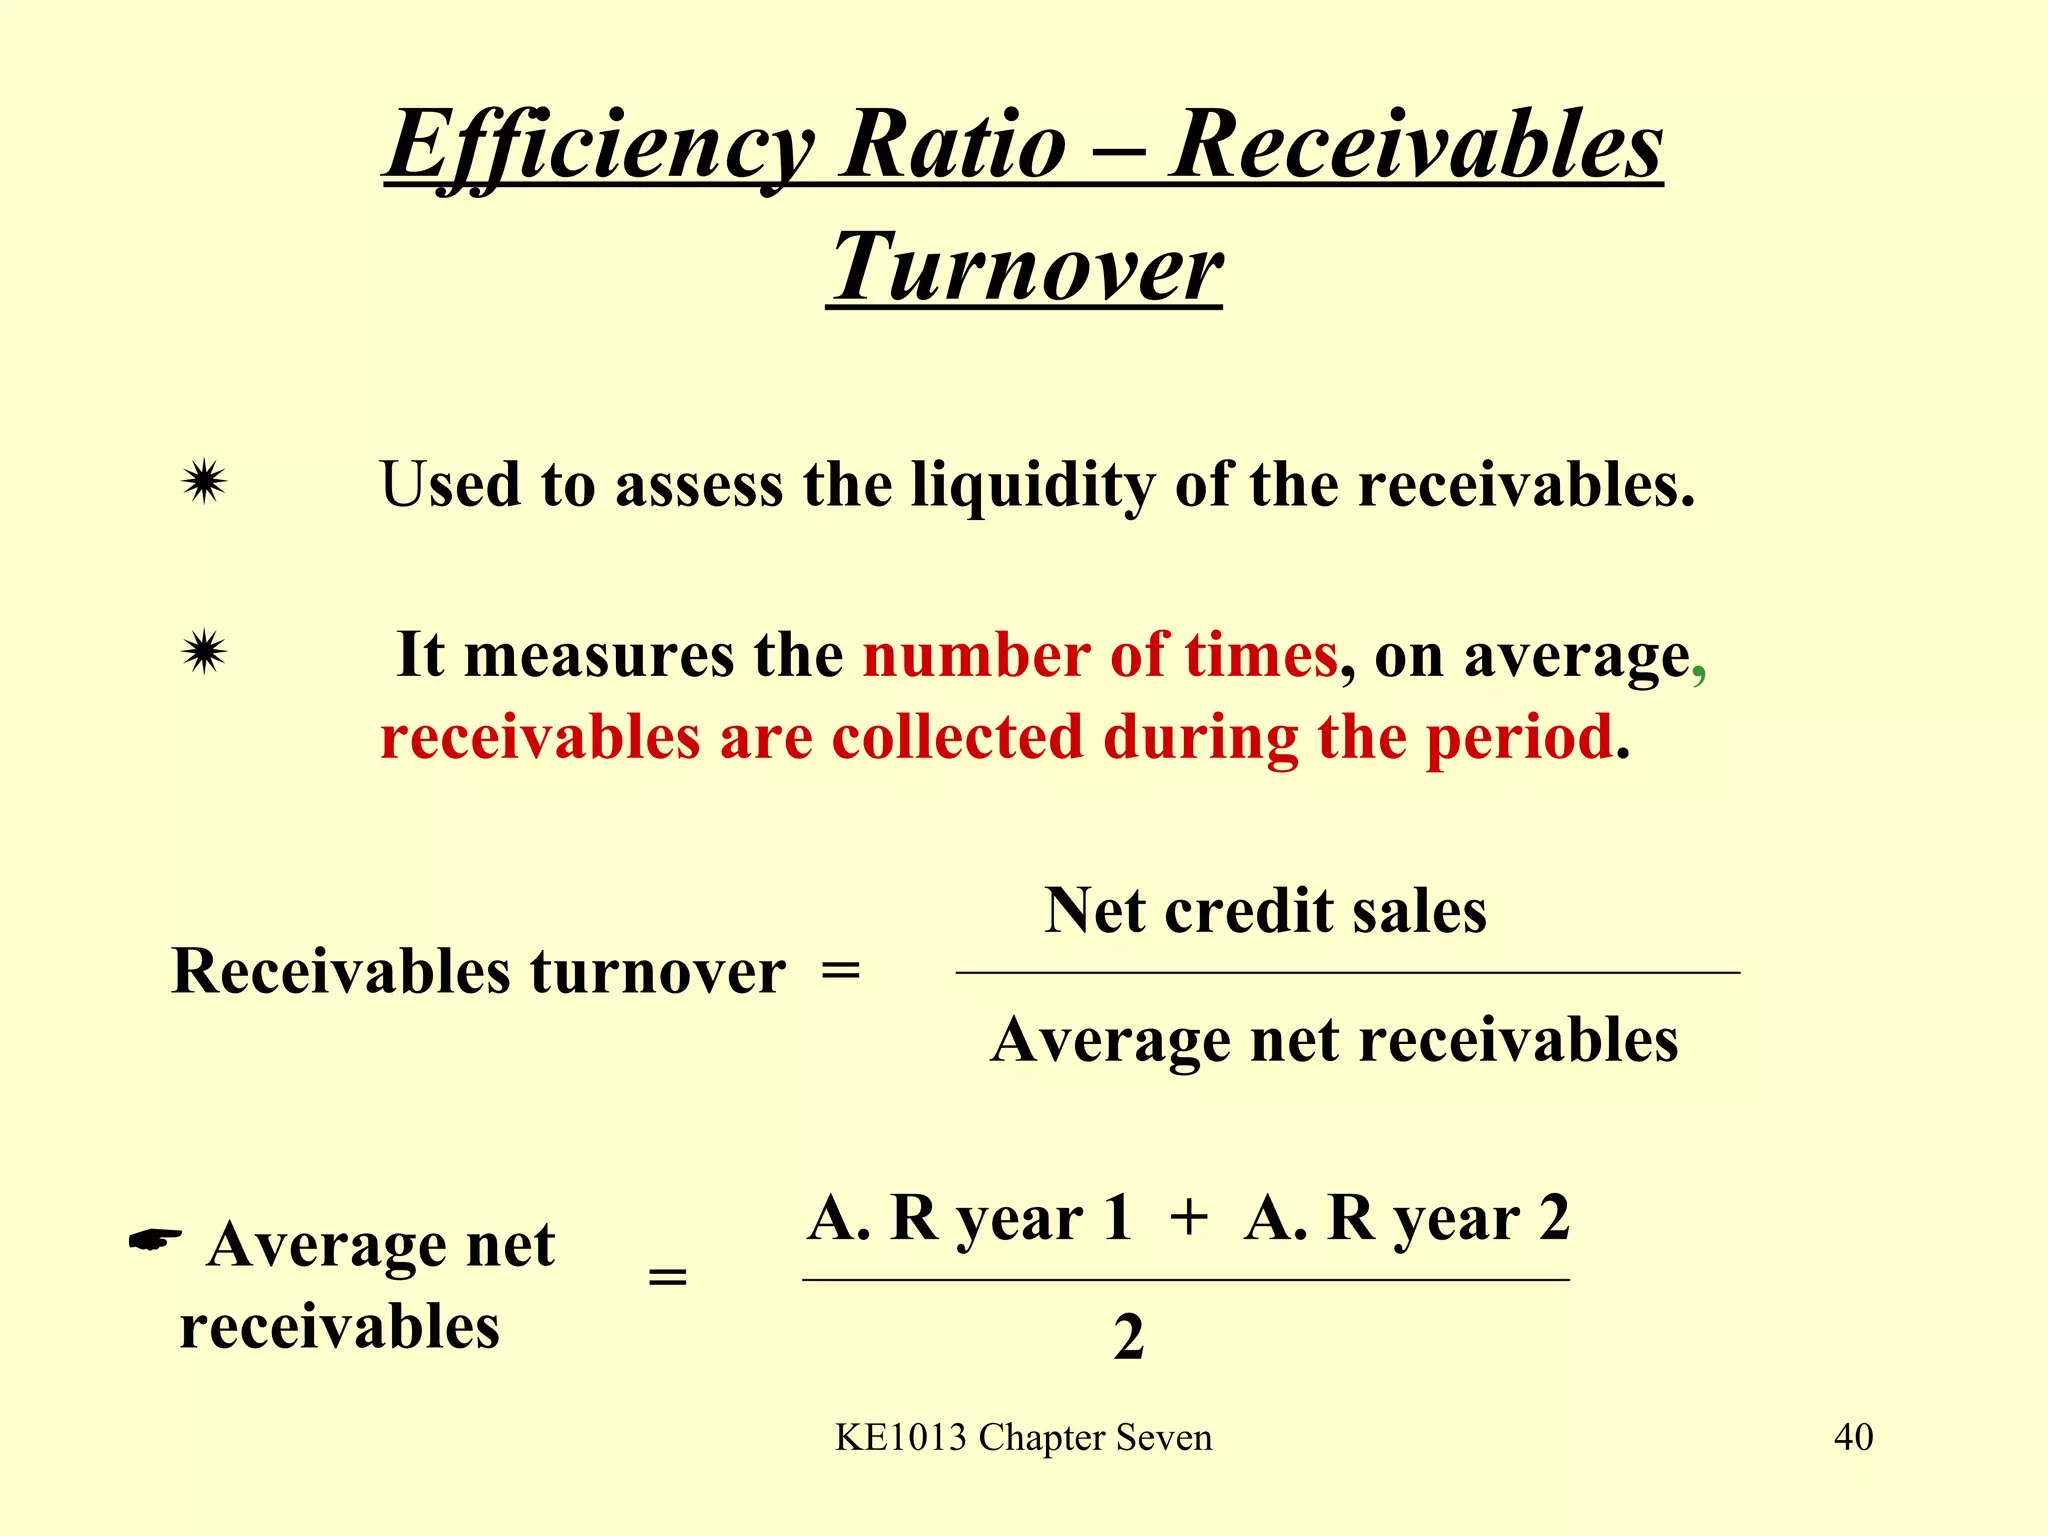
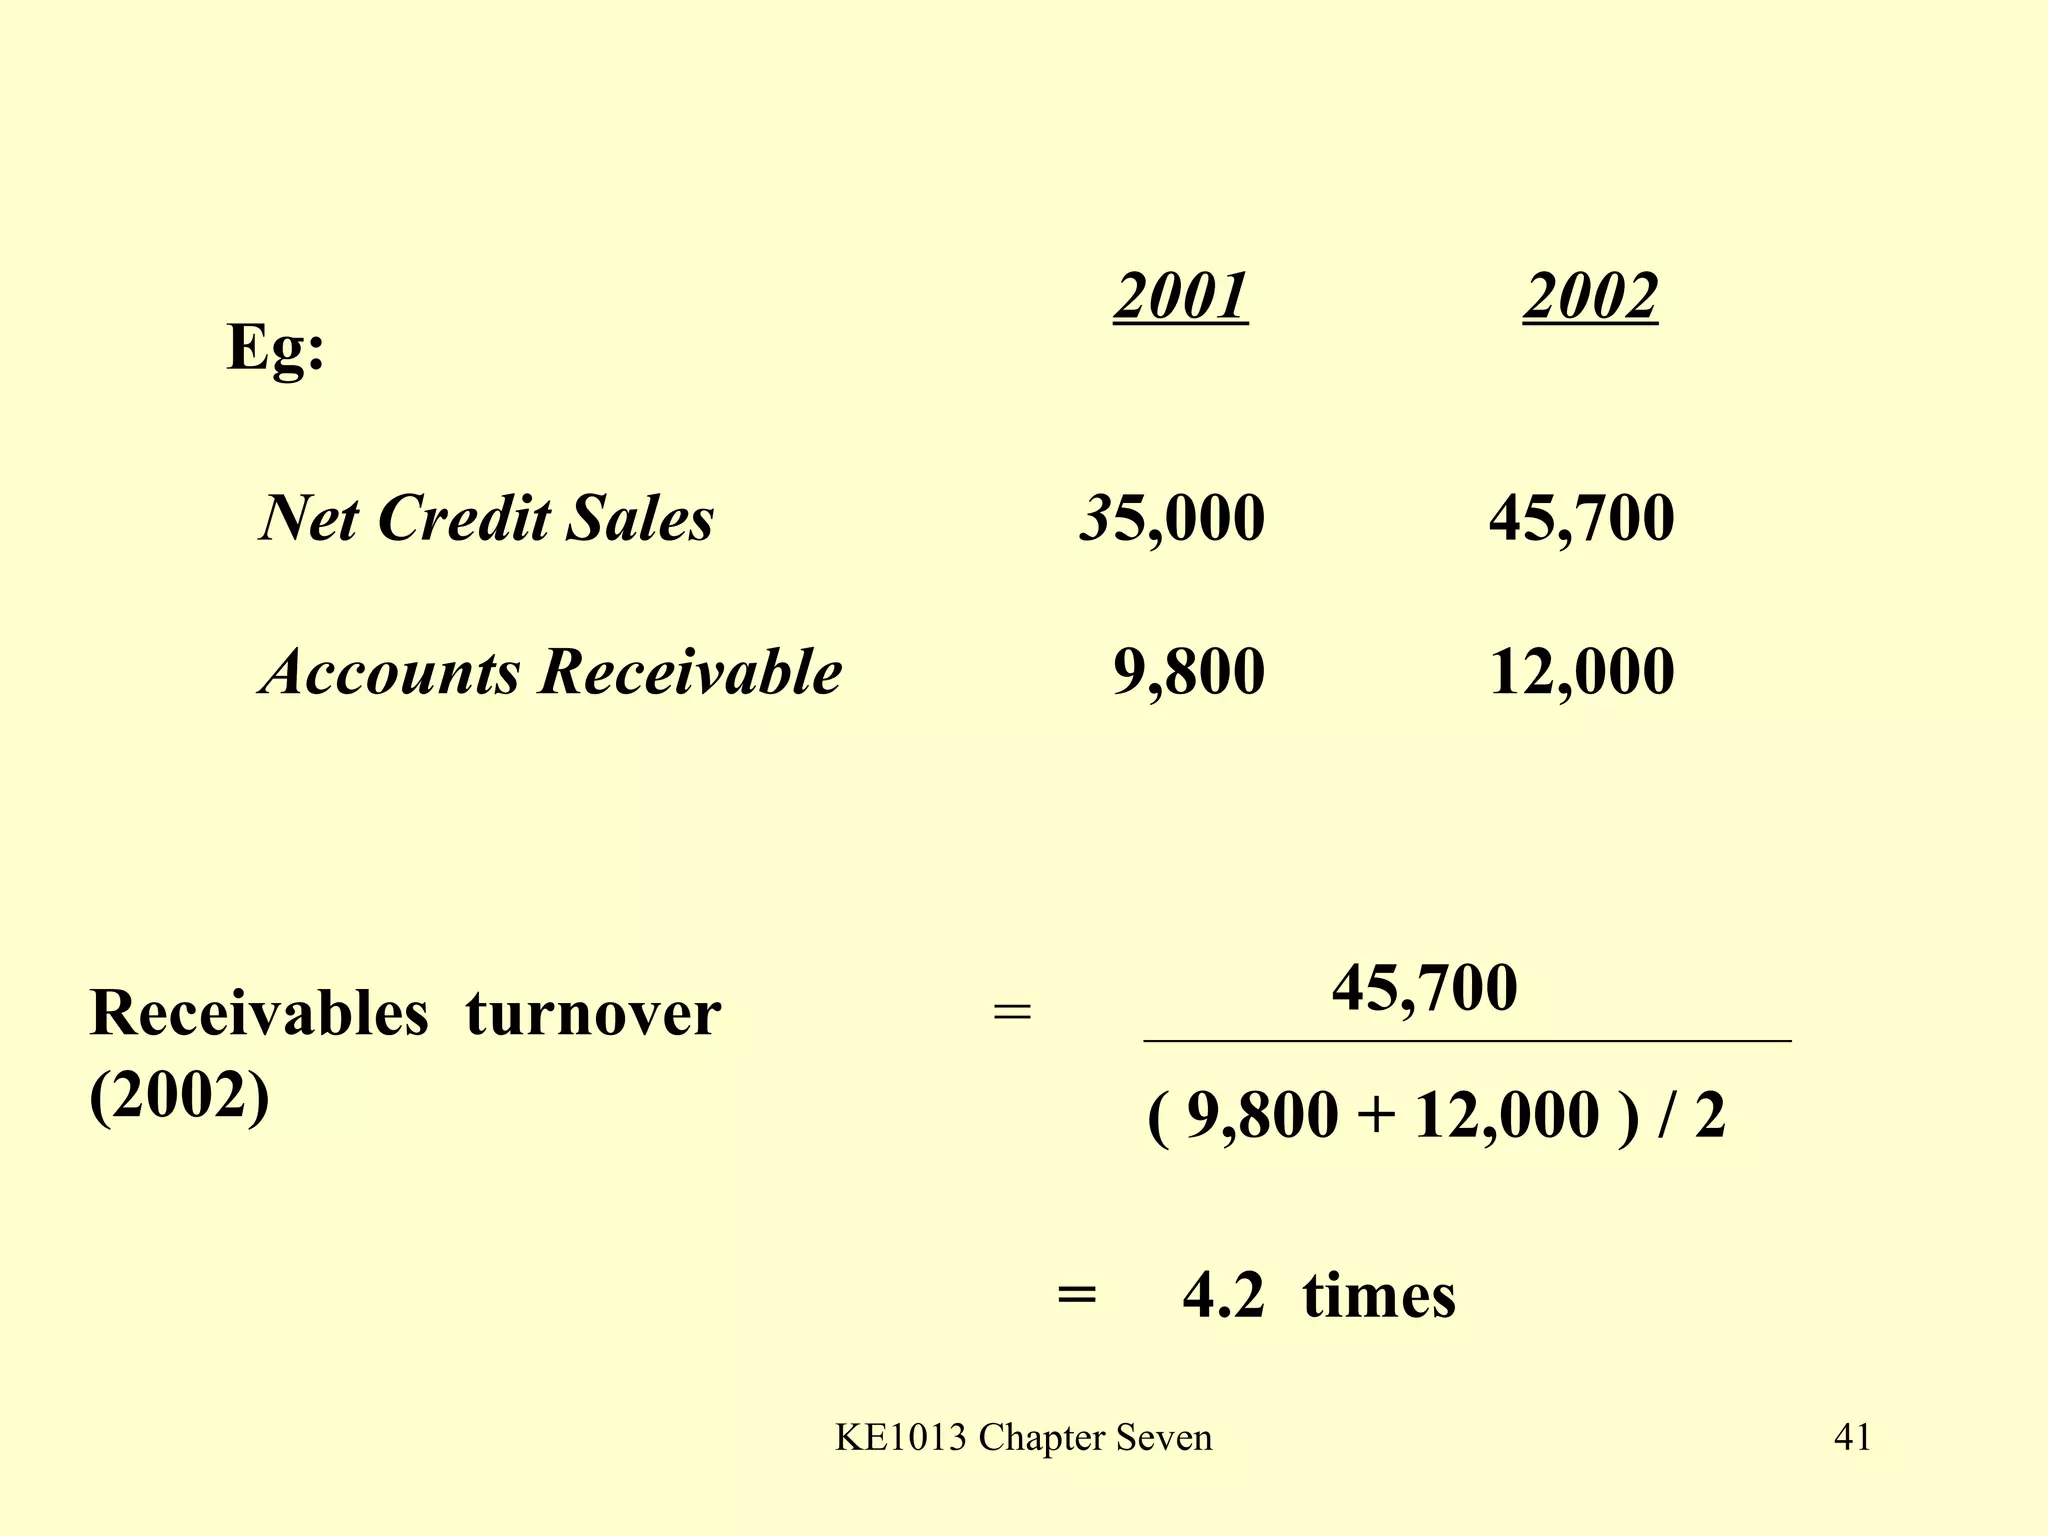
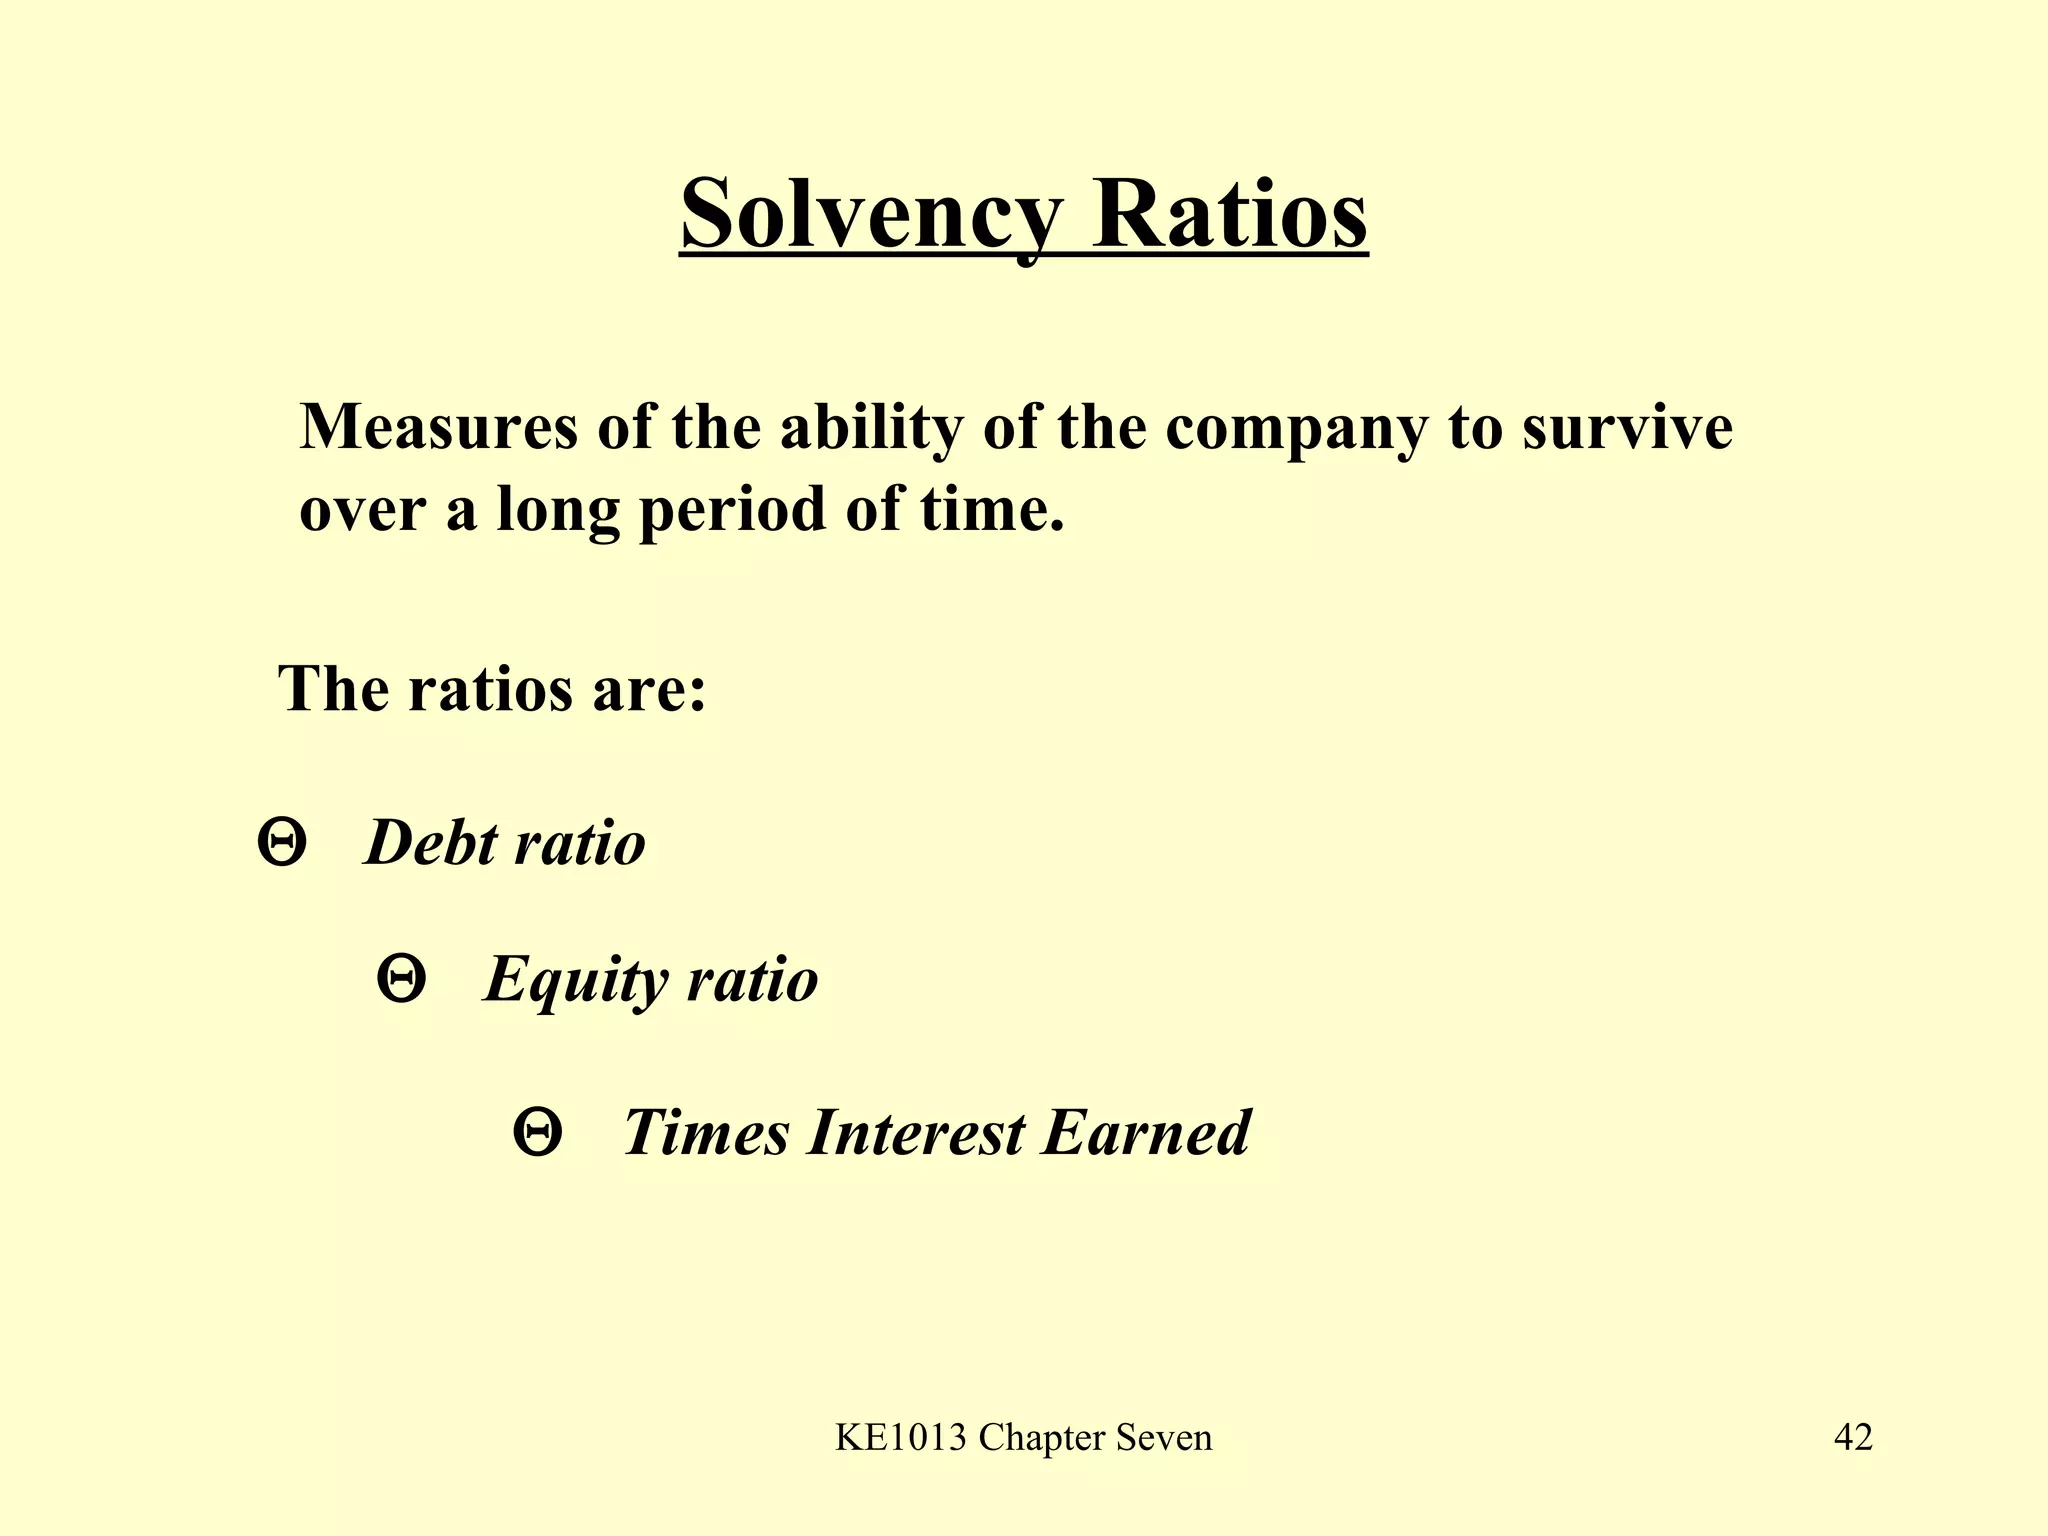
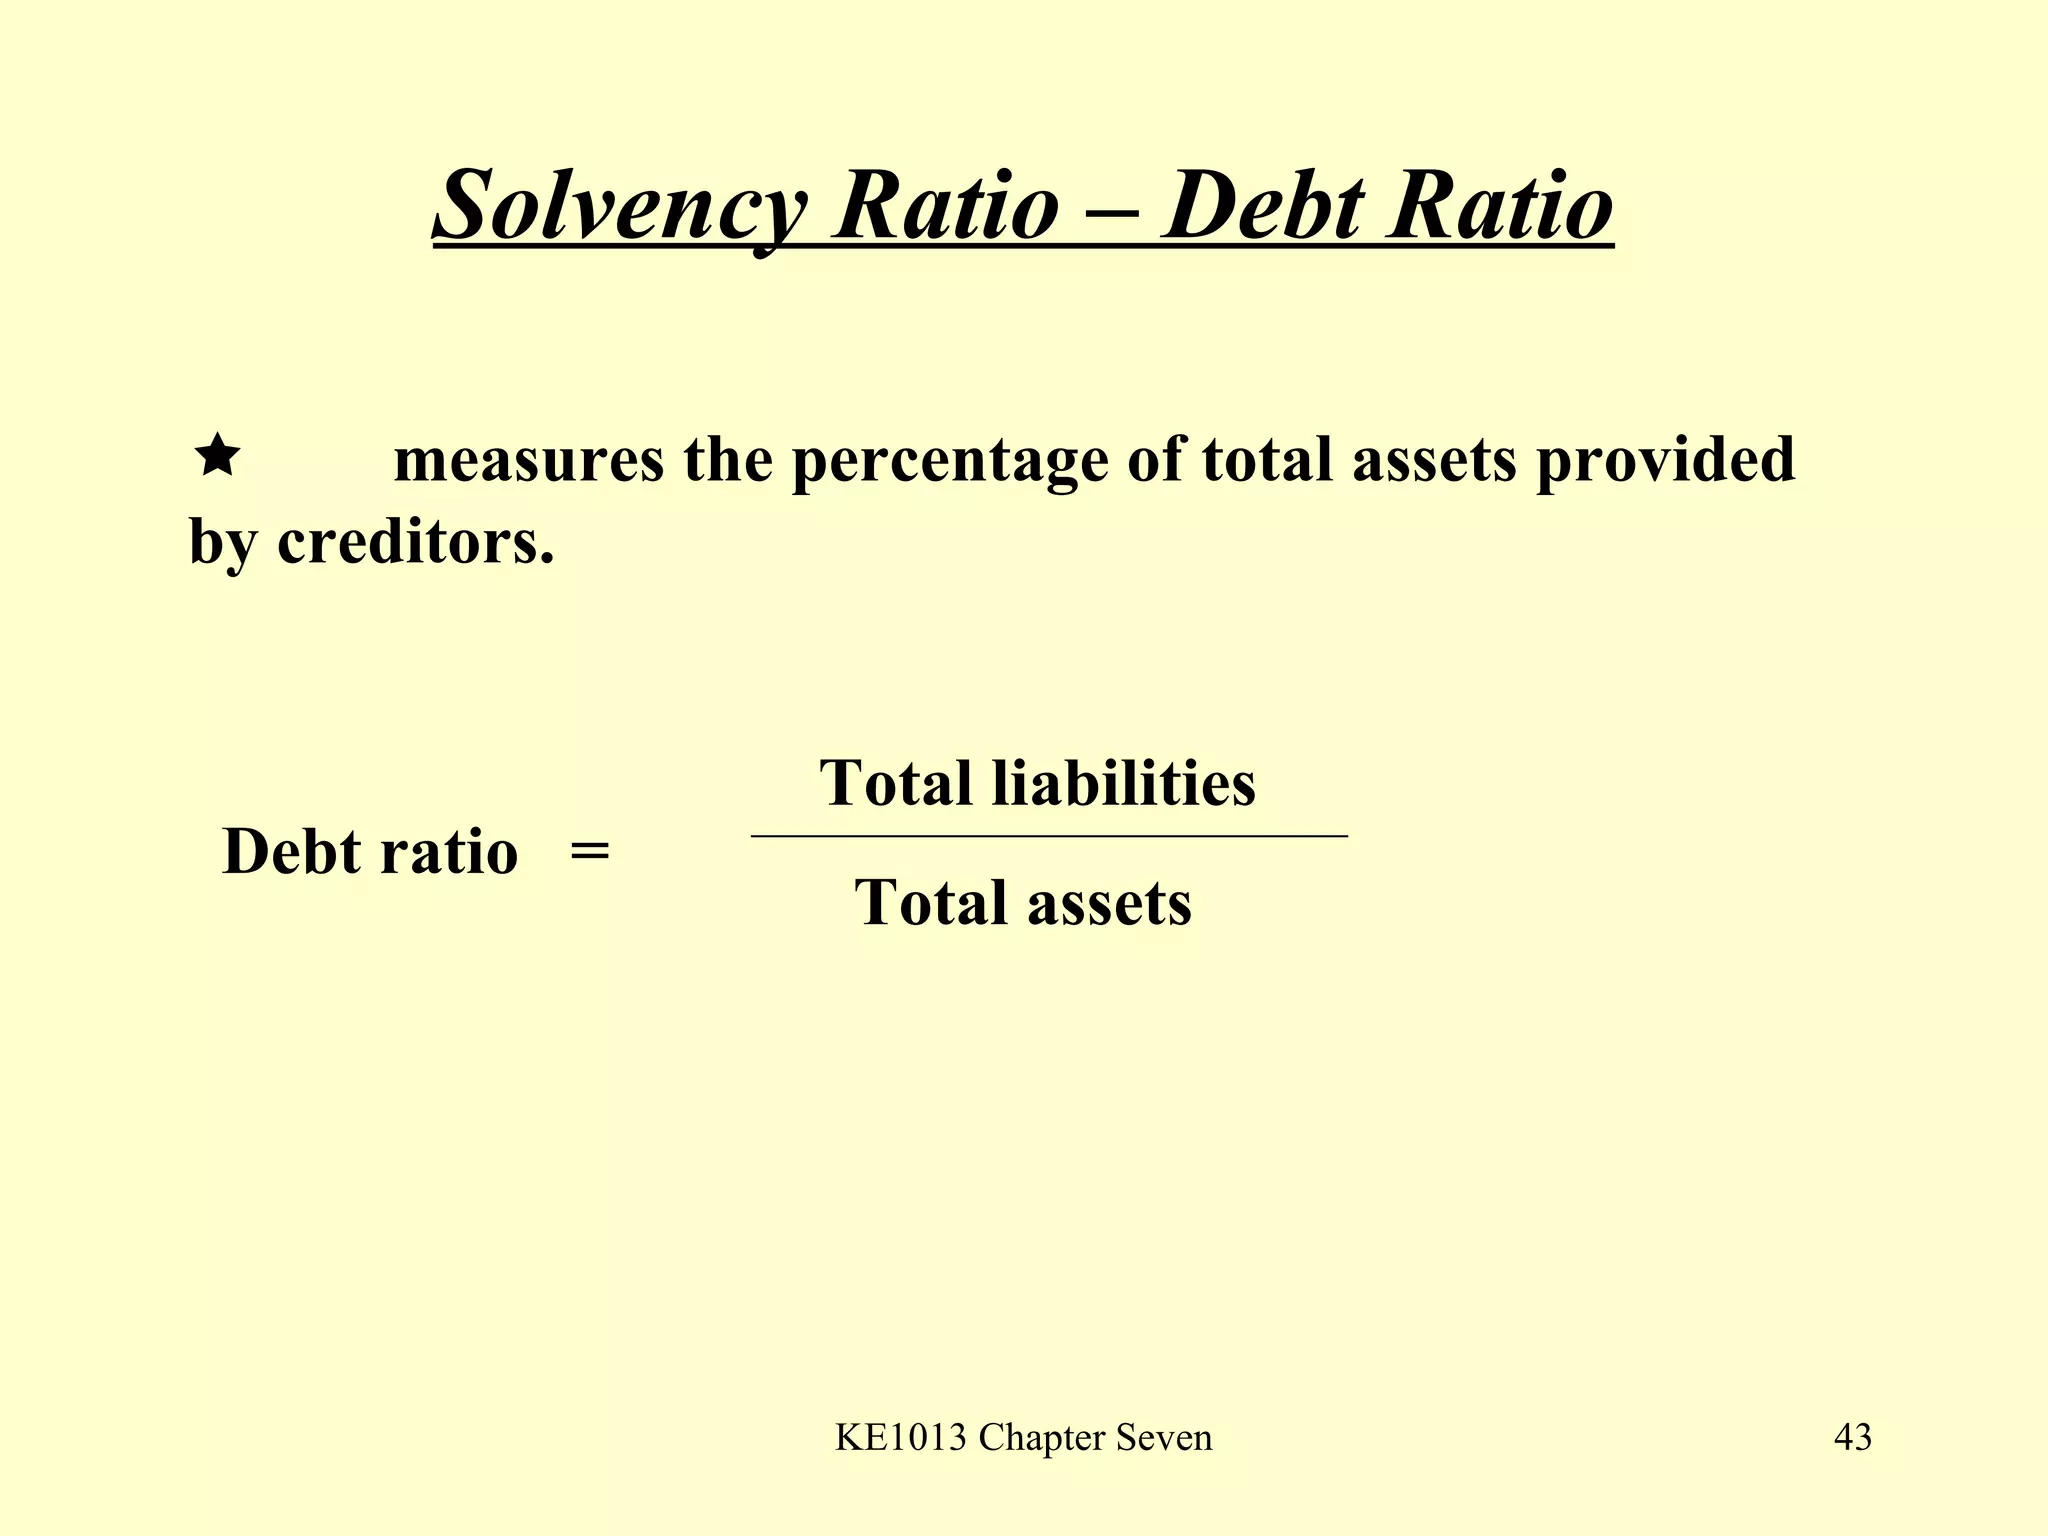
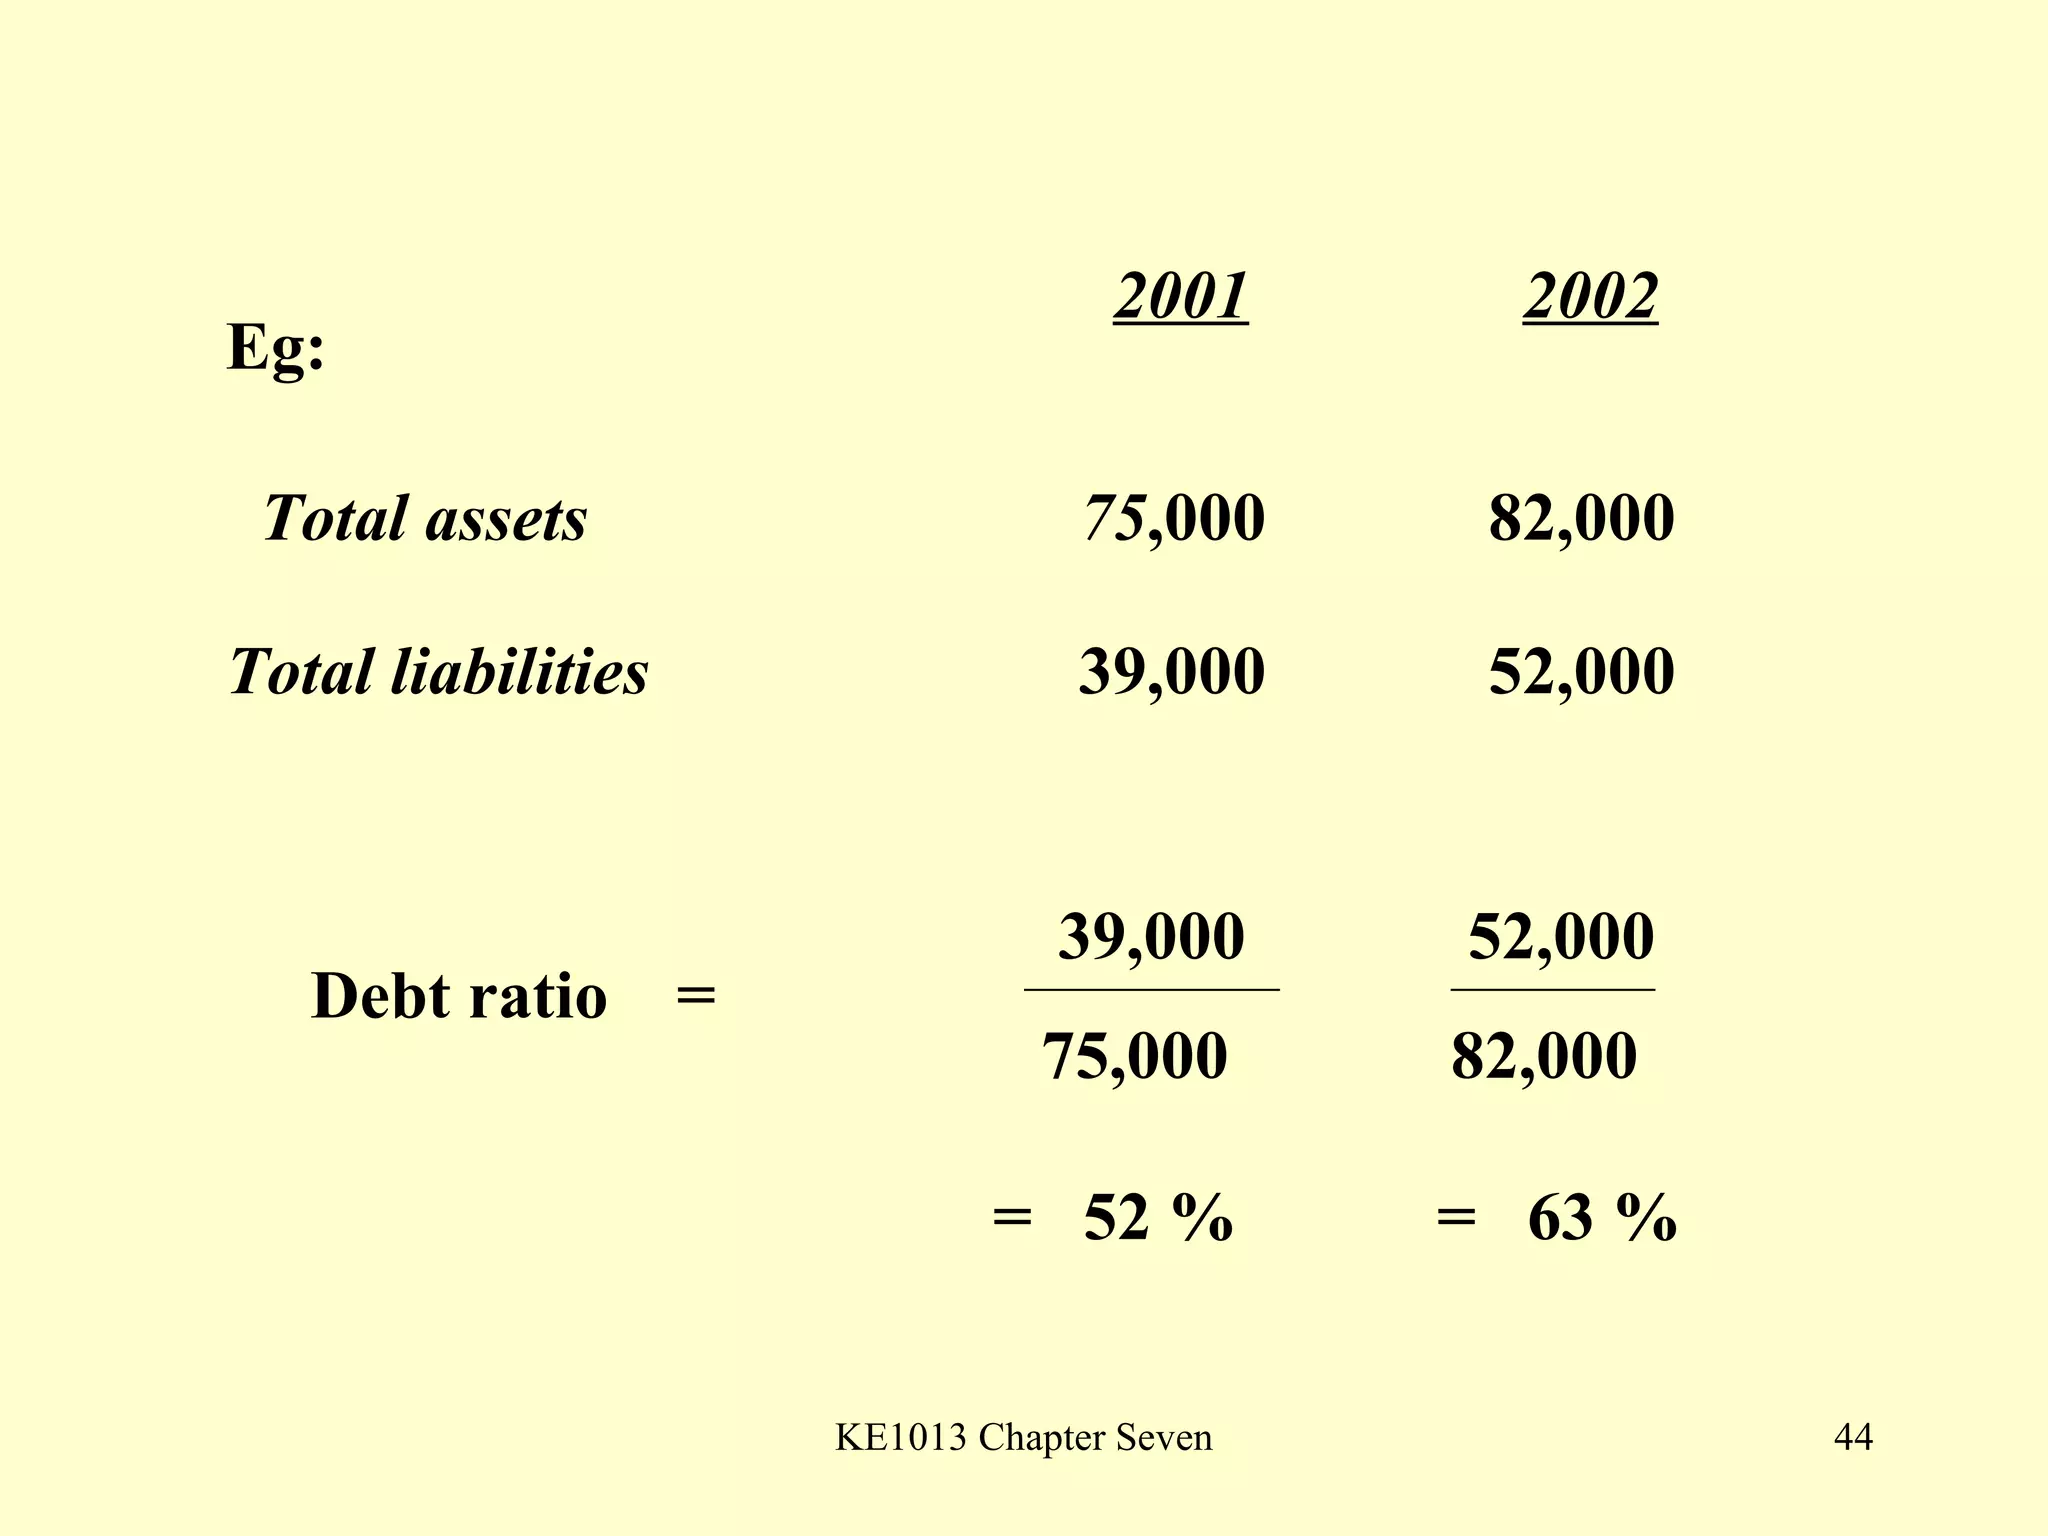
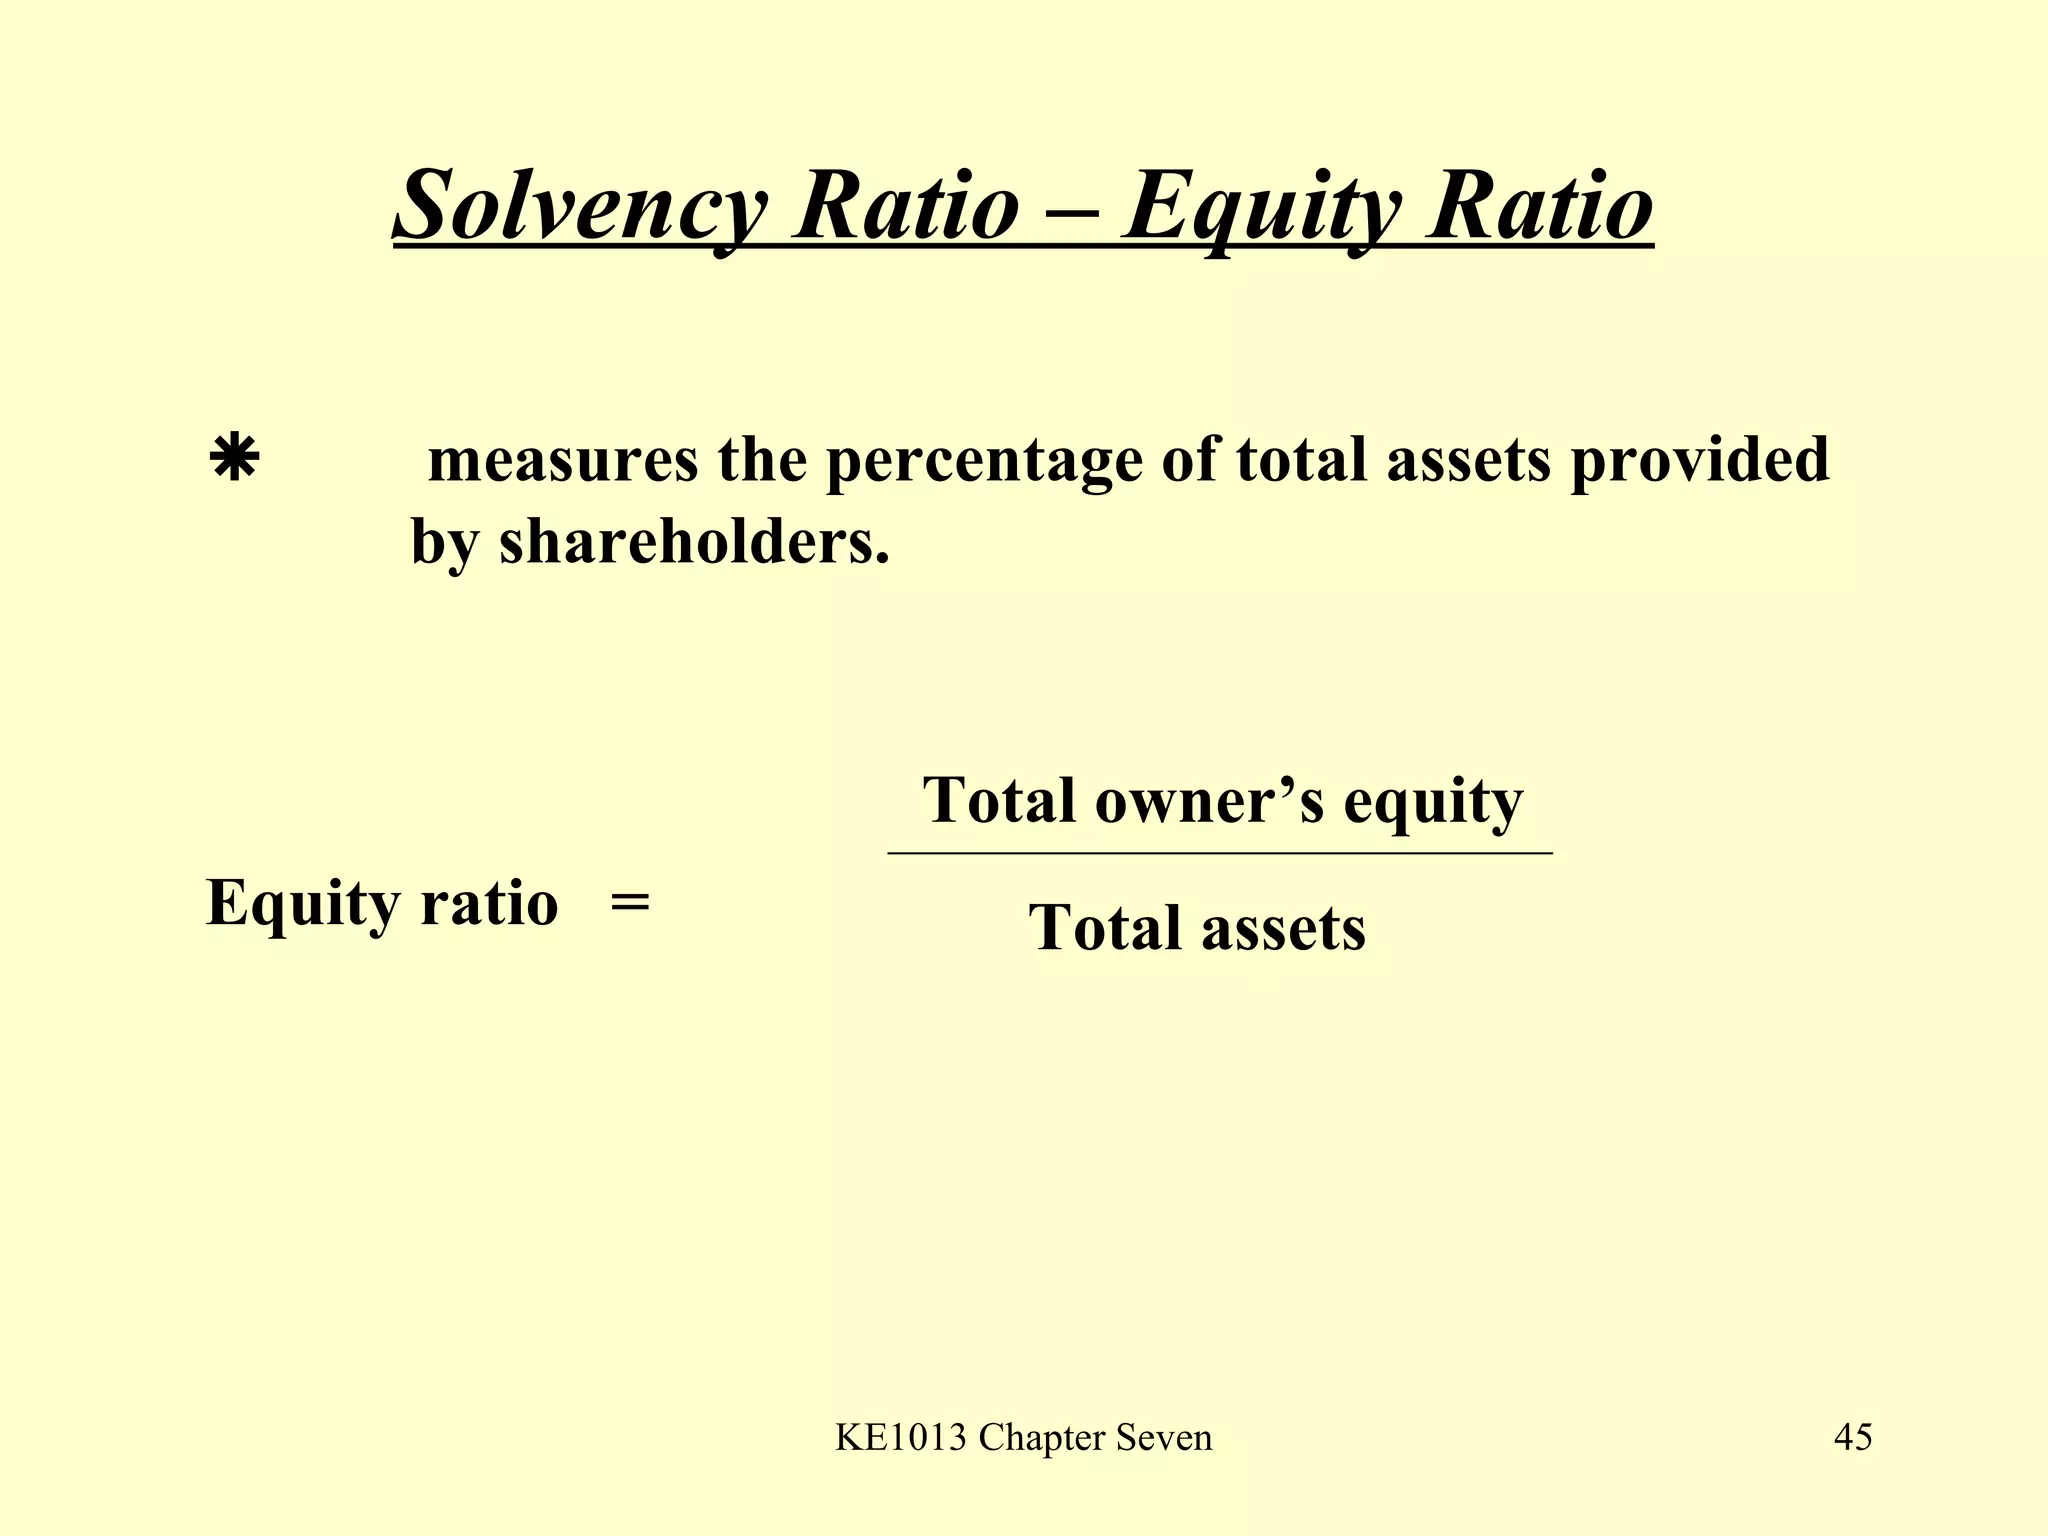
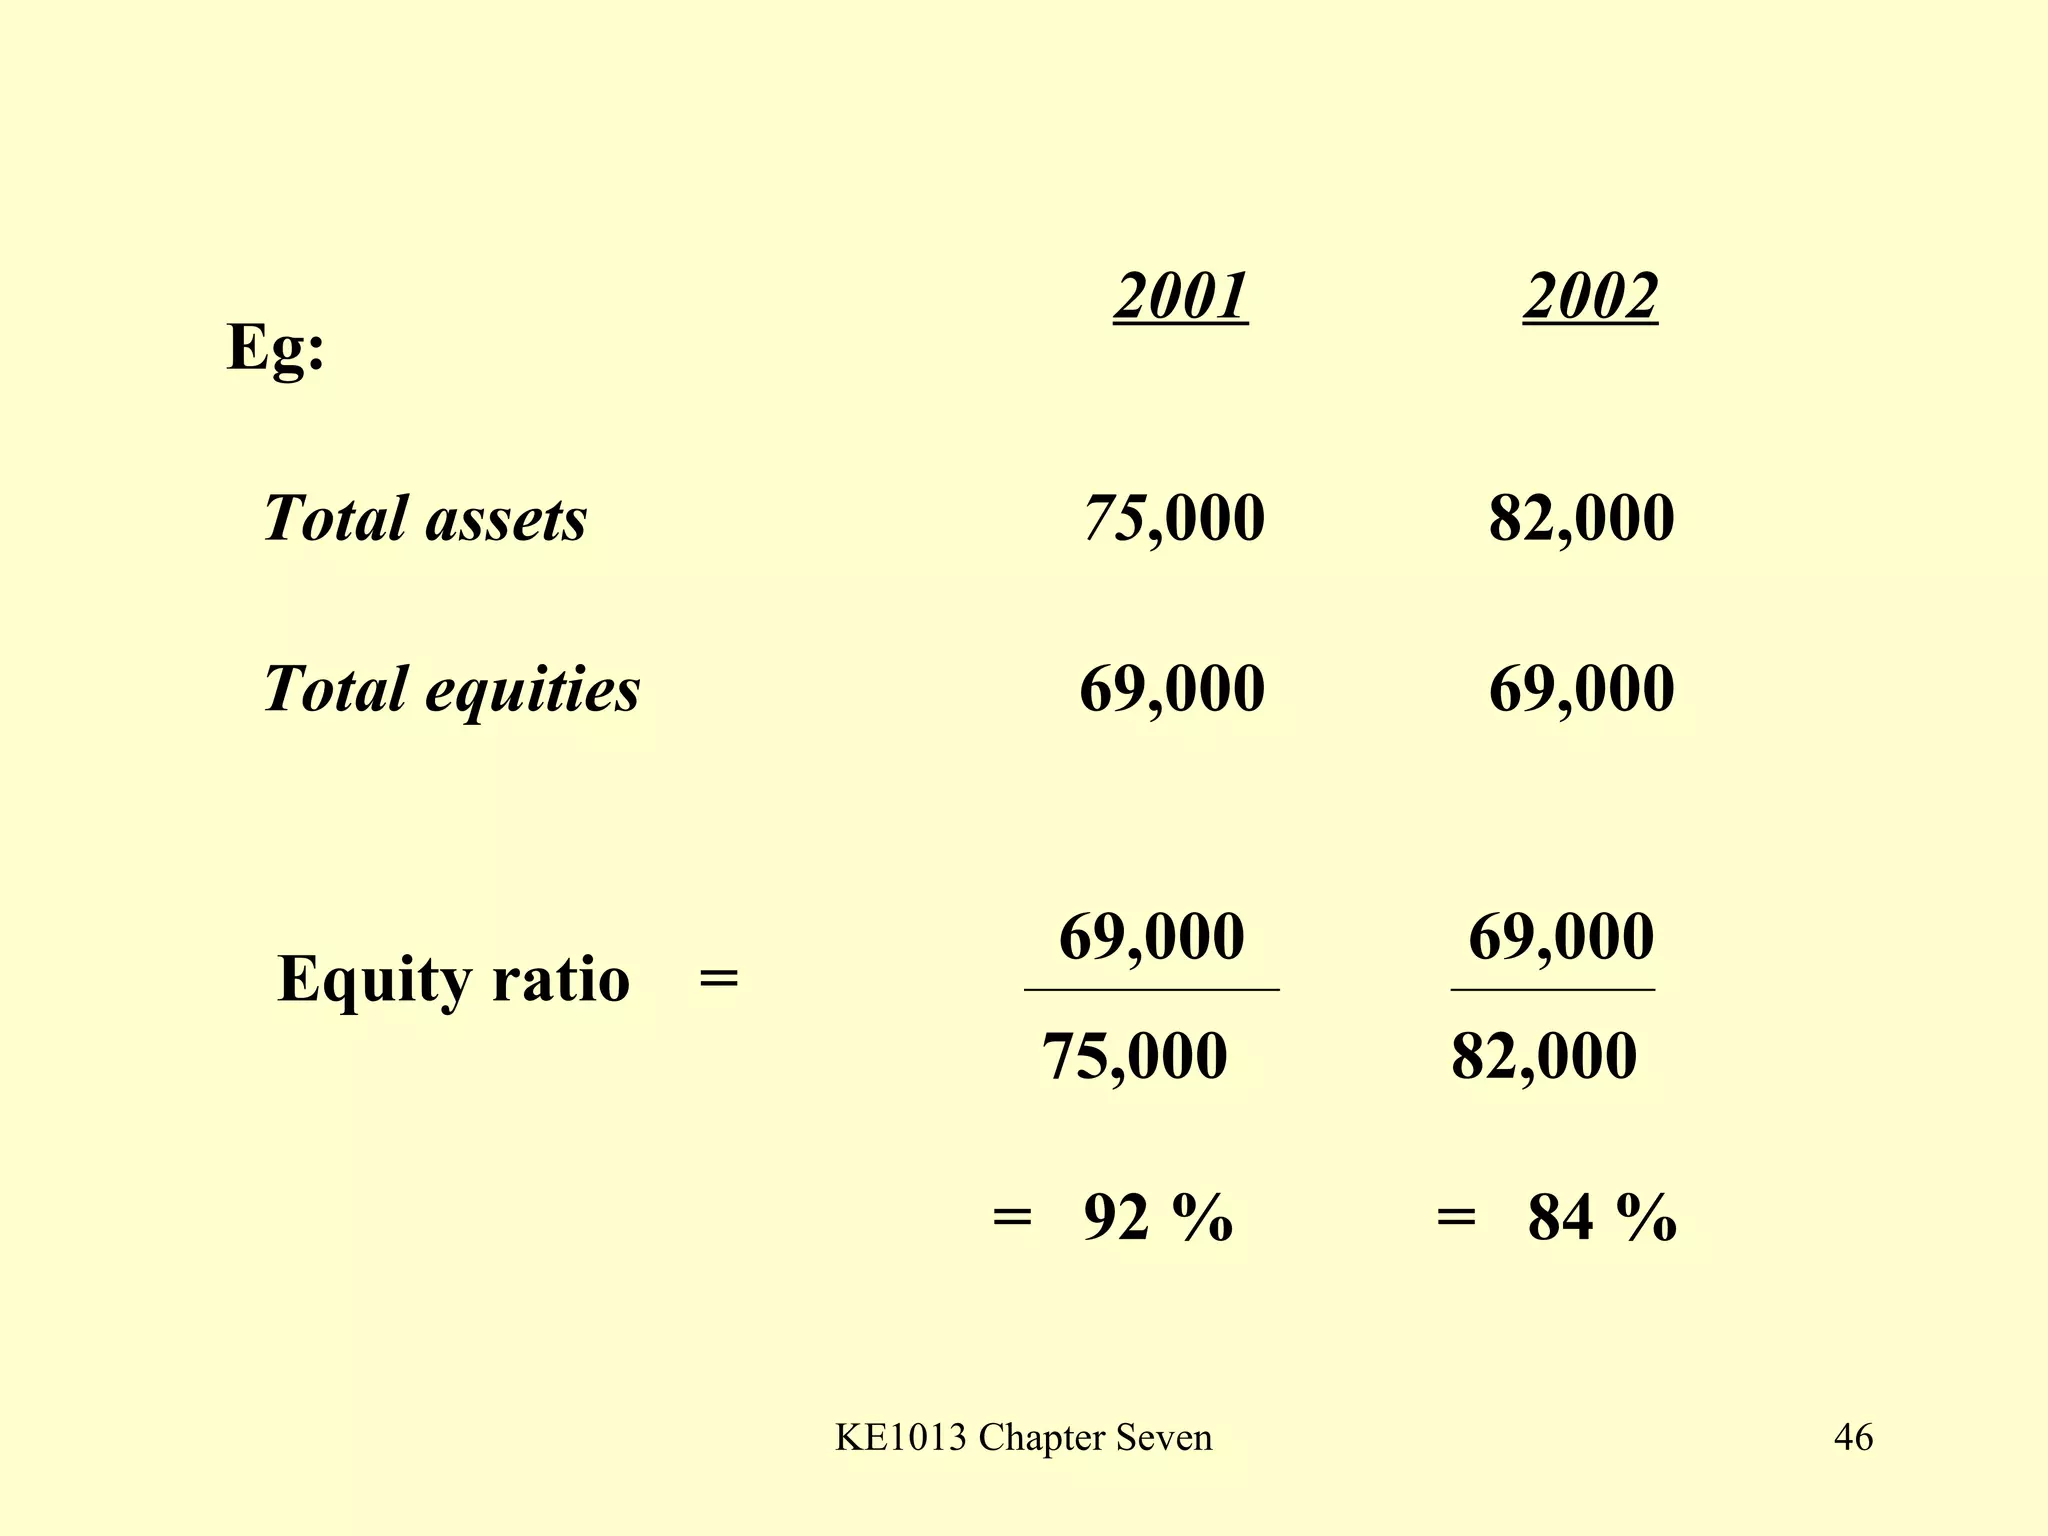
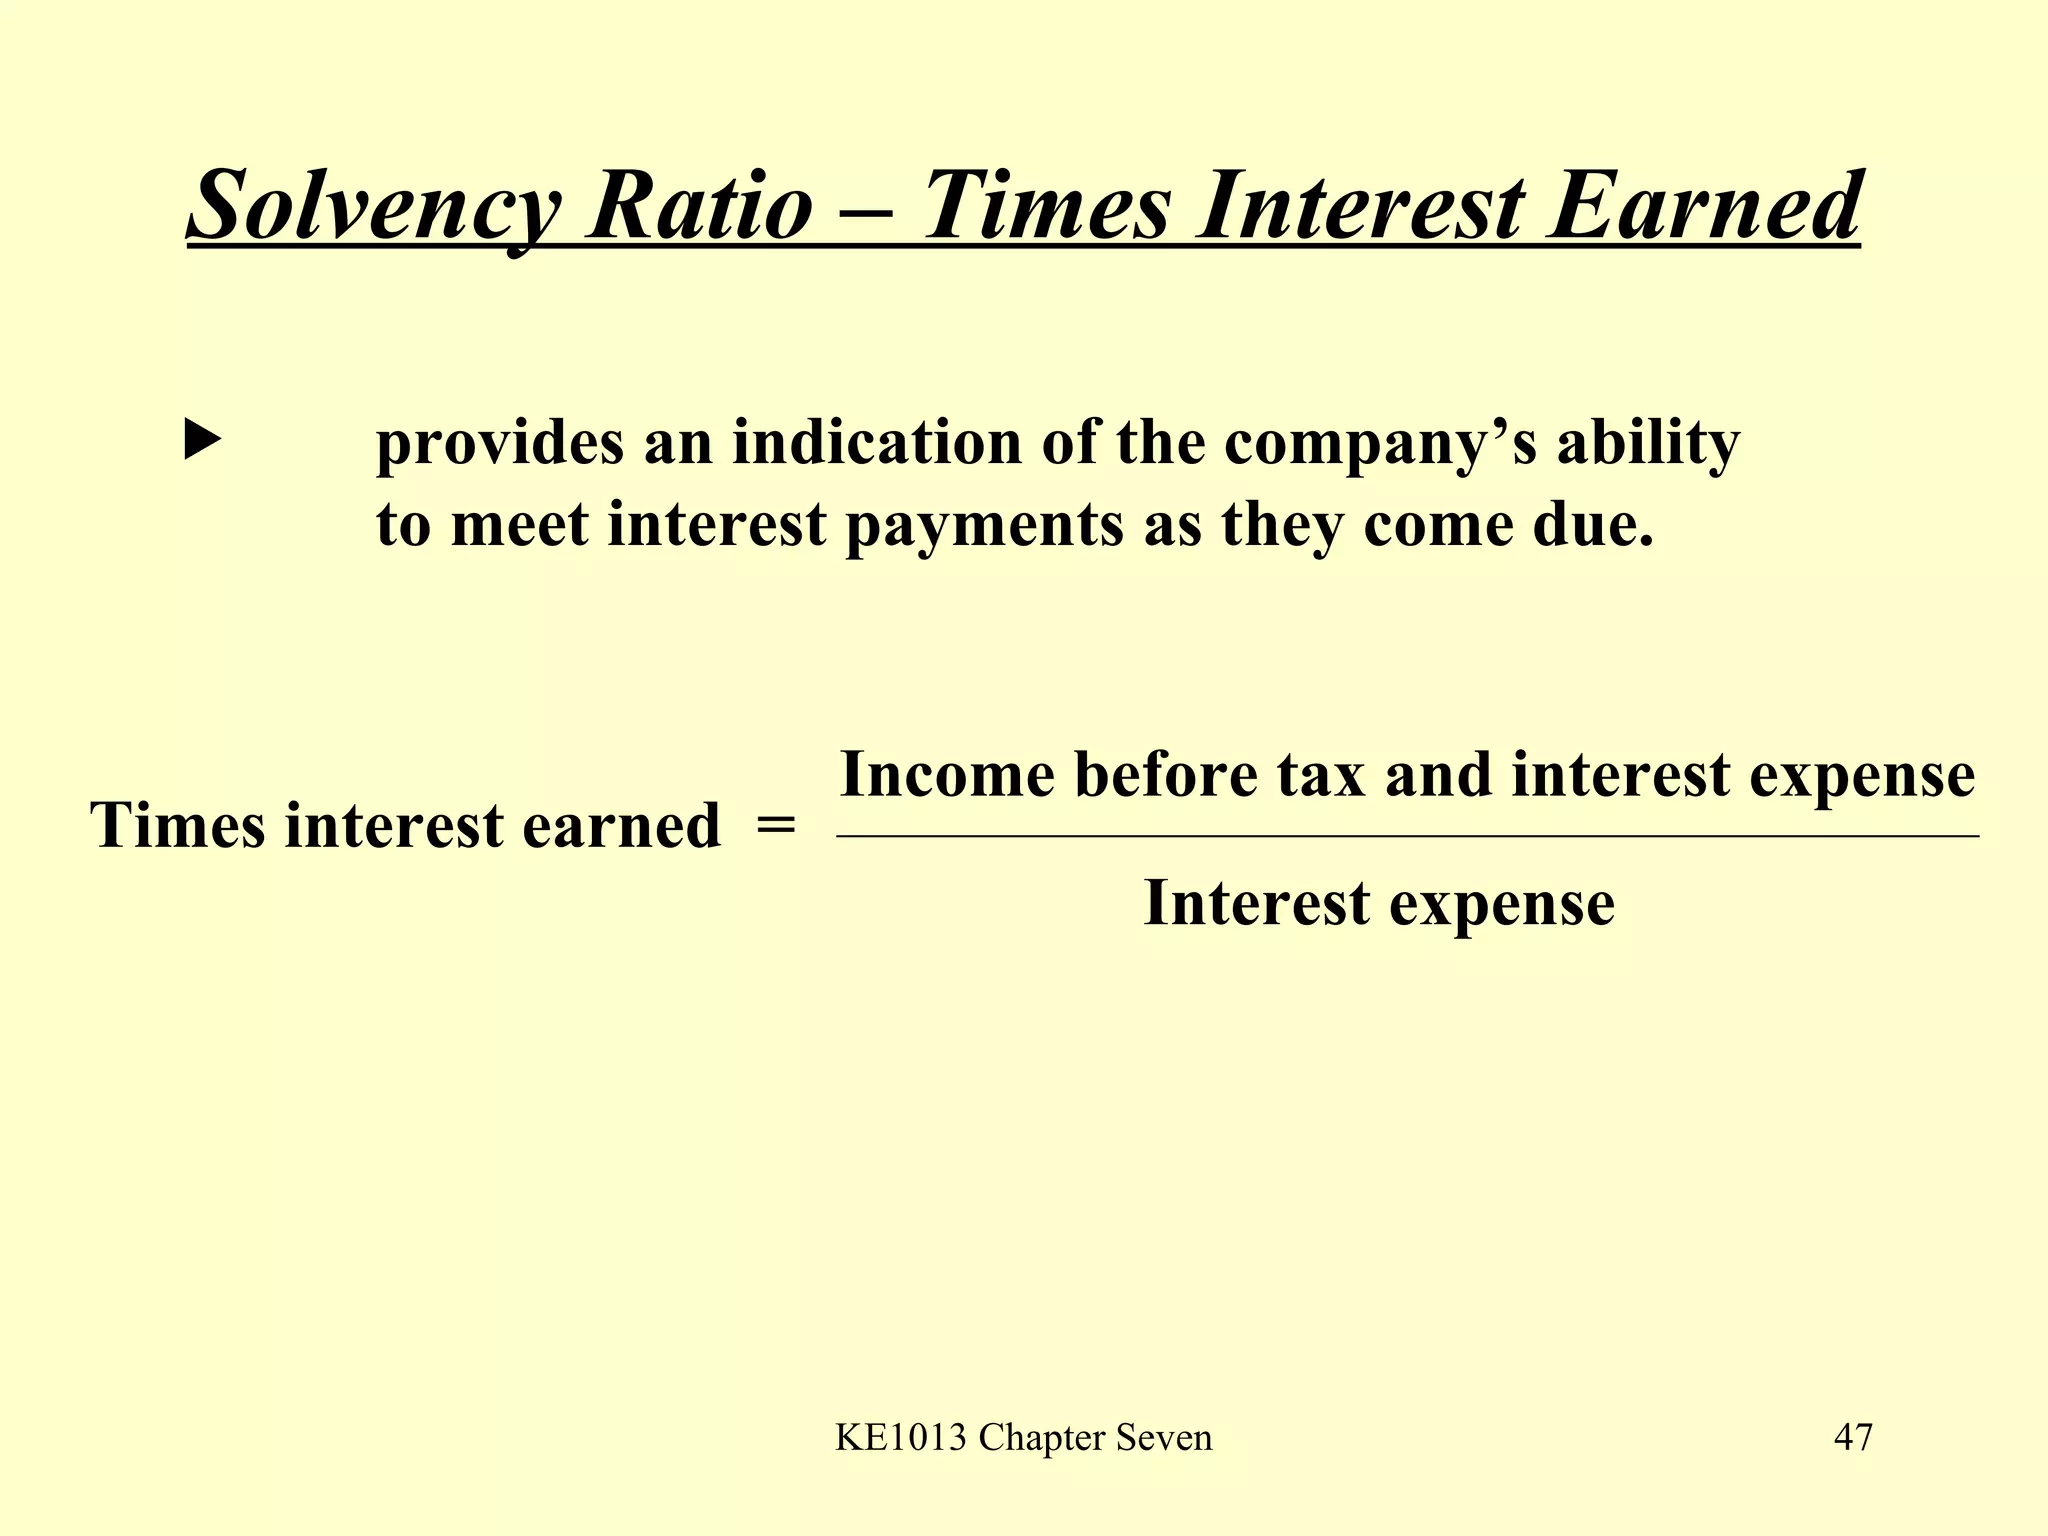
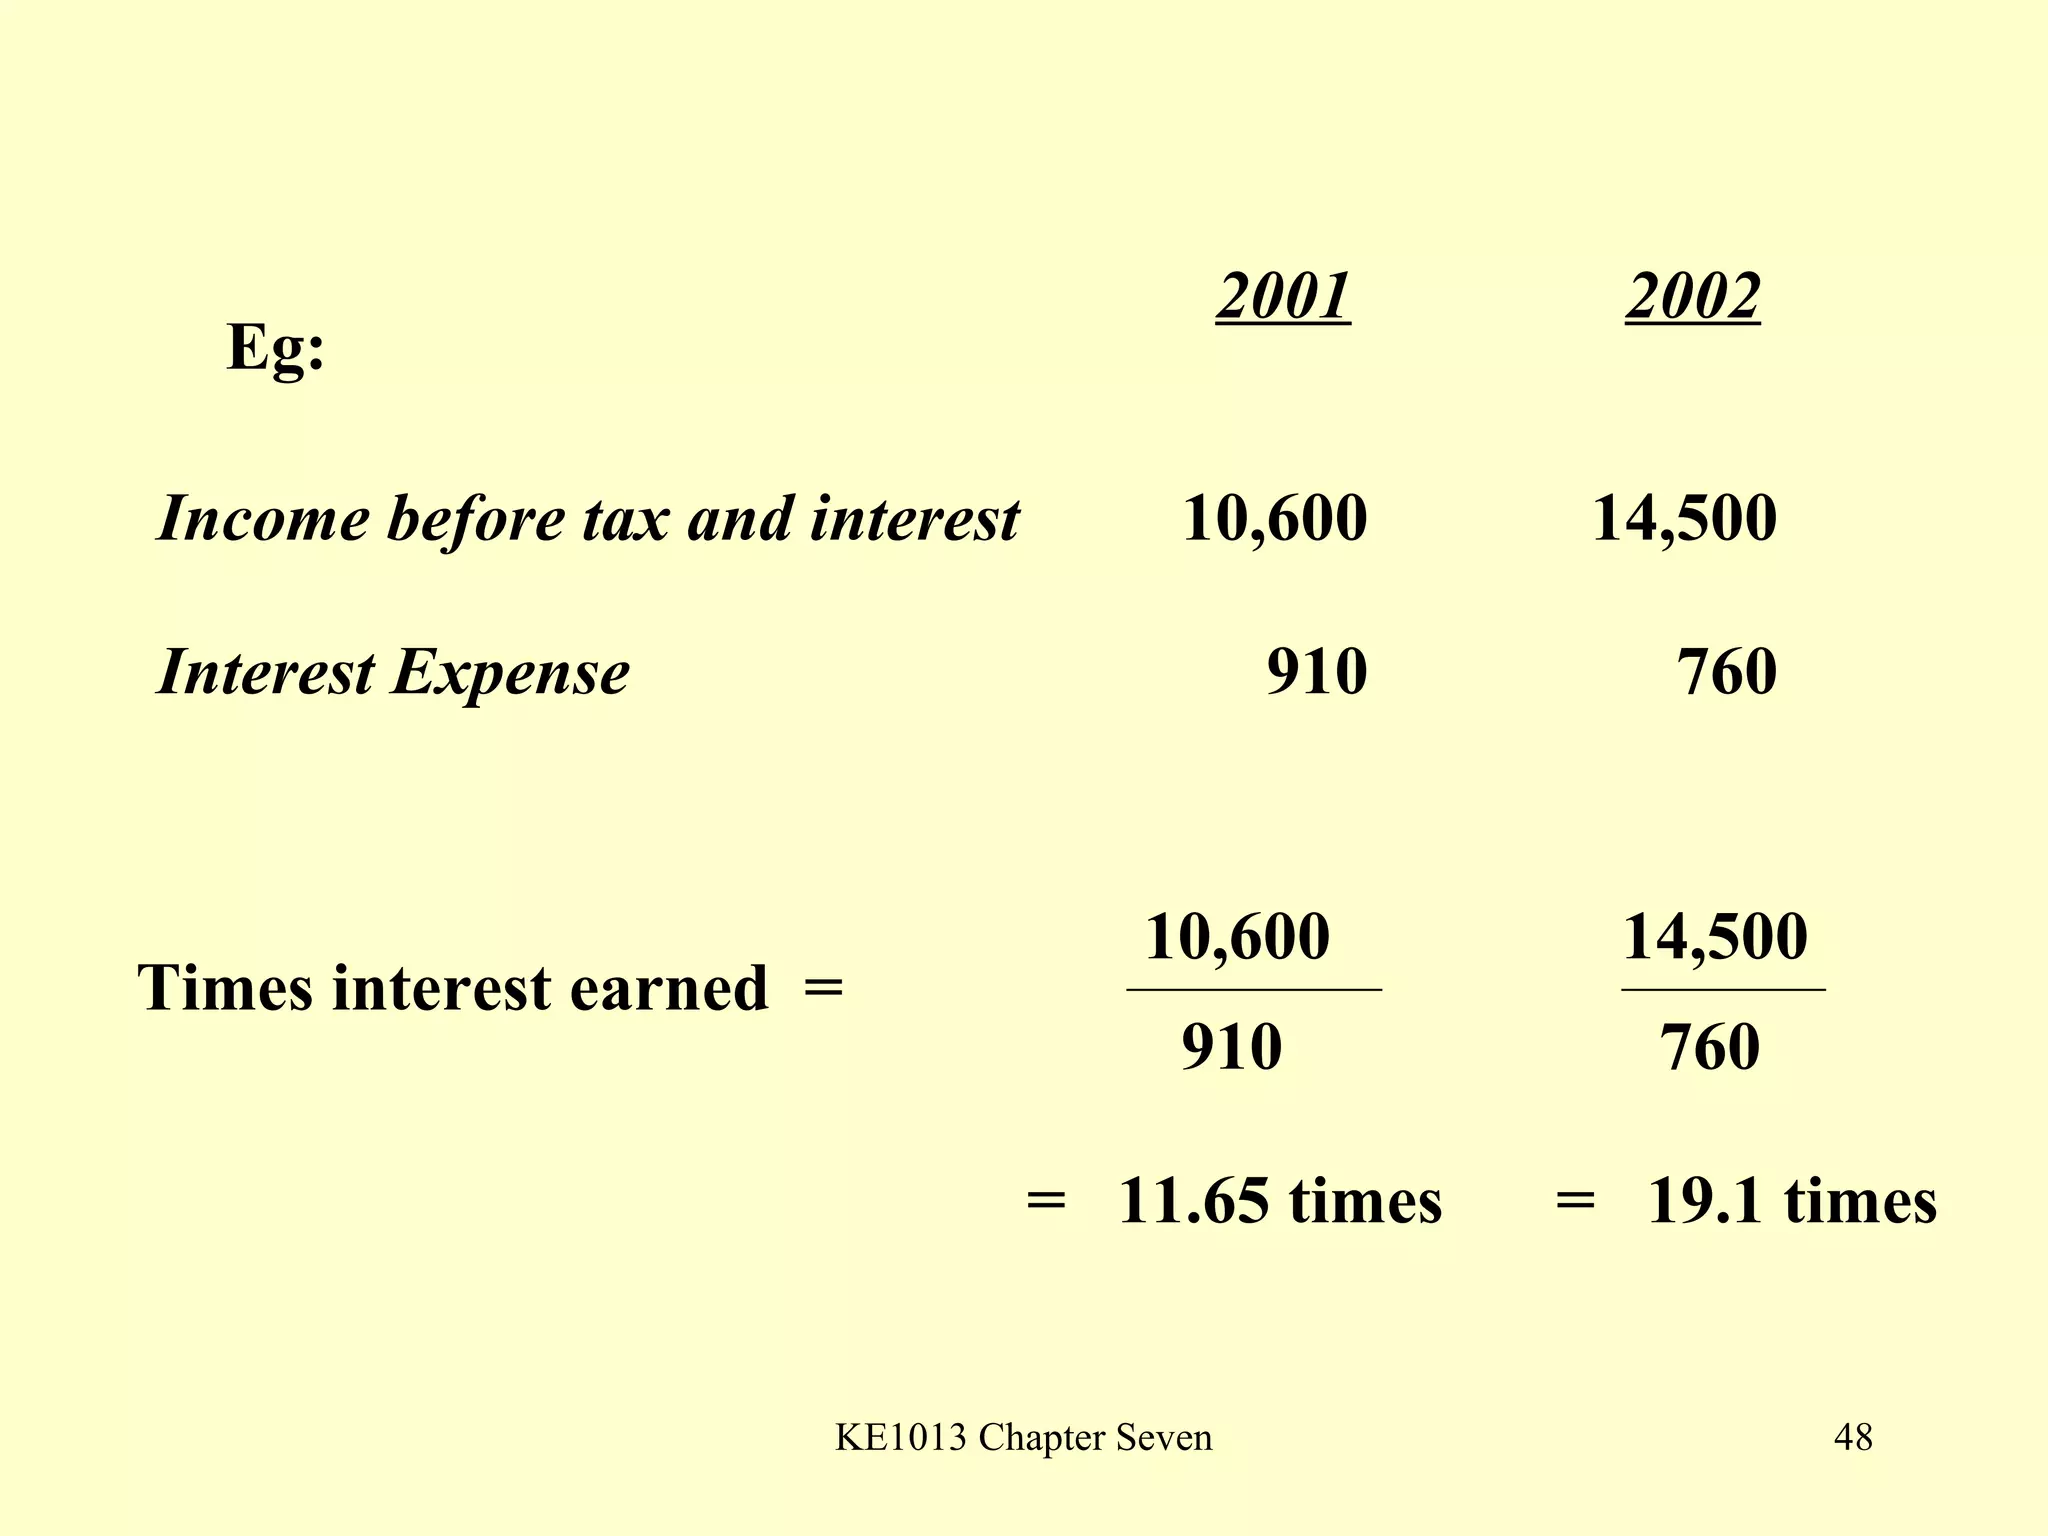


This document summarizes different types of financial statement analysis including percentage, ratio, horizontal, and vertical analysis. It discusses various liquidity, profitability, efficiency, and solvency ratios that are used in financial statement analysis such as current ratio, acid test ratio, profit margin, return on assets, inventory turnover, and debt ratio. The document provides examples of how to calculate each type of ratio using financial data from sample company statements.

![Dividends and _dividend_policy_powerpoint_presentation[1]](https://cdn.slidesharecdn.com/ss_thumbnails/dividendsanddividendpolicypowerpointpresentation1-130929215028-phpapp02-thumbnail.jpg?width=640&height=640&fit=bounds)


![Bab7 pengembangan perniagaan[1]](https://cdn.slidesharecdn.com/ss_thumbnails/bab7-pengembanganperniagaan1-120106022348-phpapp01-thumbnail.jpg?width=640&height=640&fit=bounds)


