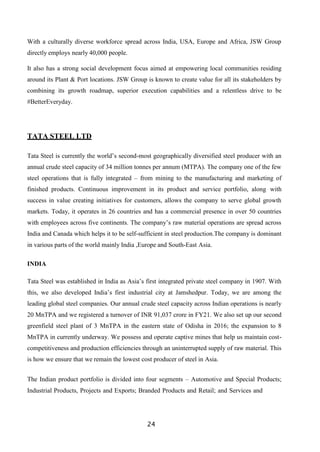
CHAPTER 1
INTRODUCTION
OF THE
TOPIC
1
What is Profitability
Profitability refers to the profits or gains a business makes in relation to its expenses.
Therefore, profitability analysis refers to the process of calculating or analyzing the profits of
a business. It helps businesses identify their revenue streams and where they can reduce their
expenses to generate maximum gains. Profitability analysis is an integral component of
Enterprise Resource Planning (ERP), which is used to automate and integrate daily business
operations. As a part of ERP, profitability analysis helps examine gains generated from
different business segments like customers, products, or services. It thus offers quantitative as
well as qualitative insights, and helps stakeholders evaluate the elements that generate profit
for the business
Profitability analysis is part of enterprise resource planning (ERP) and helps business leaders
to identify ways to optimize profitability as it relates to various projects, plans, or products. It
is the process of systematically analyzing profits derived from the various revenue streams of
the business. Sometimes profitability analysis is incorrectly assumed to exclusively rely on
profitability ratios. In fact, profitability analysis relies on both qualitative and quantitative
analytics to help leaders get the full picture.
While profitability analysis does answer many quantitative questions, it is unique in that it
can also help business leaders identify which sources of information are most factual and
reliable. This is especially helpful in helping to select new enterprise resource planning
solutions as the need for factual and reliable data is paramount.
ERP systems combine information from a variety of business processes and enable the flow
of information between them. Advancements in ERP solutions have created access to more
transparent and helpful information than in the past. This transactional information can be
used to help perform holistic profitability analysis which often includes a deep look into
which customers, vendors, and geographical locations are most profitable.
Why Is Profitability Analysis Important?
Understanding the quality of a business’s earnings is important for many reasons. In order to
maximize profits, business leaders first need to understand the drivers behind their profits.
This helps to create efficiencies in the processes and activities that generate revenue.
2
Consequently, it forces leaders to continually find ways to reduce overhead and other costs
that impact profitability.
The analysis helps to identify ways to enhance product mixes to maximize profits both in the
near and short term. This makes it helpful for budgeting purposes as leaders work to create
reasonable goals and map how they will achieve them. The ability to identify both short- and
long-term product mixes also helps management to determine what modifications, if any,
need to be made to the business.
This results in the ability to anticipate sales and provides insights into customer
demographics, geographic considerations, and product types that can be used to assess profit
potential.
One helpful piece of information created when analyzing various products is which products
are the most and least profitable. This information is sometimes taken into consideration
when business leaders choose to eliminate certain products.
Finally, profitability analysis examines the various relationships with customers and vendors.
This helps to identify which customers are the most and least profitable and which vendors
have the biggest impact on profitability. This can be especially helpful in navigating
relationships with customers and vendors.
Common Methods Of Performing Profitability Analysis
There are many ways to carry out analysis on profitability. Some industries have
considerations that are specific and unique to the businesses that operate within them. While
each business ultimately goes about it differently, here are three common methods of
profitability analysis.
Profitability Ratios
Profitability ratios are financial metrics that are used to garner information on how well the
business can generate revenue relative to its cost, assets, and equity over time. Some of the
more common profitability ratios are operating profit margin, return on assets (ROA),
and return on equity (ROE).
3
Customer Profitability Analysis
A great deal of attention is given to the data created as a result of transactions. The data
provides unique insight into customers’ behaviors. As a result, transaction analysis can help
to identify which customers result in the most profit, and which customers result in the least.
It also helps to identify which products and product mixes are most commonly ordered.
The most common approach is to calculate profit margin for each customer. However, profit
per customer share is sometimes relied on as well. This helps to show the percentage of profit
each customer is responsible for creating.
Qualitative Analytics
It is important for leaders to continually assess the various market conditions and relevant
customer behavior patterns. This helps to identify trends and business cycles and allows
leaders to plan appropriately.
Types of Profitability Analysis
Profitability ratios are divided into two broad categories. The first is margin ratios that help
analyze how much profit a business is making or can make through its sales. The second is
revenue ratios that indicate how the extent of returns a company can provide its shareholders.
These two ratios are further categorized into the following types:
Margin Ratios
Gross Profit Margin
Gross profit margin is the total profit of a business after deducting operational or inventory
costs. It represents gross profit of the company in comparison to sales revenue. Gross profit
margin is calculated to analyze how much profit a business is making after spending on
4
production of goods or services. If a business has a higher gross profit margin, it means that it
can easily cover its operating and other expenses, and still provide a significant amount of net
profit. Low gross profit margin indicates that the cost of production is high, and profits earned
are low.
Operating Profit Margin or EBIT Margin
This represents how much profit a business has made after deducting variable costs like wages
or the cost of raw material. This profit is calculated before deducting taxes or interest. It helps
determine whether a company is capable of managing its fixed costs and can run its operations
smoothly.
Net Profit Margin
This ratio represents the actual financial position of a company after the taxes and interests
have been paid. It indicates a company’s net income or revenue after tax and interest liabilities
are paid off. This net profit is utilized to pay dividends to the shareholders. A higher net profit
margin indicates that a business is able to keep its expenses low and is making high profits.
Cash Flow Margin
It helps calculate the ability of a business to convert its sales into cash flow. Simply put, cash
flow margin represents how much cash or income is a business able to generate from its
operating activities. A higher cash flow margin indicates that a company is well-equipped to
pay its vendors or suppliers, and purchase capital assets.
Revenue Ratios
Return on Assets
Return on assets means the profit a company generates from its total assets. It compares the
profits or net income generated from the assets to the capital invested by the company. Return
on assets ratio indicates how well a company is utilizing its economic resources.
5
Return on Equity
Return on equity indicates how much return a company is able to provide to its equity
shareholders. It indicates the efficiency with which a company is managing the capital invested
by the shareholders, and how much value it is able to create from it.
Importance of Profitability Analysis
Profitability analysis helps businesses determine future strategies, investments, and the
performance of the business by analyzing the current financial position. Here is how businesses
leverage profitability analysis to make key decisions:
 Gross profit margin helps businesses determine whether they are making enough profit from
their sales. If the gross profit margin is less, the business needs to do cost-cutting
 Profitability analysis also helps potential investors know the financial position of a business
and make investment decisions
 Profitability analysis enables businesses to determine the return or profit percentage that they
need to pay their shareholders
Profitability Analysis Formula
Profitability analysis is measured in the form of ratios or a percentage. Here are the formulas
for different profitability analysis methods:
Gross Profit Margin
Gross Profit Margin = Gross Profit/Sales
Here, you need to first calculate gross profit by subtracting the Cost of Goods Sold (COGS)
from the selling price.
6
Operating Profit Margin
Operating Profit Margin = Earnings Before Interest and Taxes (EBIT)/Sales
You can calculate EBIT by subtracting gross profit from operating expenses. Another way to
calculate EBIT is to add taxes and interest to the net income.
Net Profit Margin
Net Profit Margin = Net Income/Sales
You will have to first calculate the net income of the business by subtracting COGS from gross
income, and further deduct other expenses like interest and taxes.
Cash Flow Margin
Cash Flow Margin = Cash Flow from Operating Activities/Net Sales
The cash flow from operating activities is calculated by adding net income, non-cash expenses
and changes in working capital. You can calculate net sales of the company by reducing sales
returns, allowances and discounts from gross sales amount.
Return on Assets
The Return on Assets = Net Income/Total Assets
You can calculate total assets of the company by adding shareholder’s equity amount and the
company’s debt.
Return on Equity
The Return on Equity = Net Income/Shareholder’s Equity
Shareholder’s equity can be calculated by reducing the debt amount from the company’s total
assets.
7
Cash Return on Assets
Cash Return on Assets = Cash Flow from Operating Activities/Total Assets
Profitability Analysis Techniques
Break-Even Analysis
Break-even point in business is the amount at which your total expenditure is equal to your
total revenue. This means that the net profit or net gain is zero. Moreoevr, break-even analysis
is one of the best strategies for profitability analysis as it helps you understand the minimum
revenue you need to generate in order to sustain your business.
Benchmarking Industry Profitability Ratios
You can analyze business profitability by researching the standard profitability ratio of
businesses in your industry. Thus, to set that as a benchmark so that you know whether you will
be able to compete in the market.
Howto Perform Profitability Analysis
Now that you know what is profitability analysis, let’s understand the steps to be taken to
calculate the financial performance of your business:
Step 1: Gather Data
The first step in calculating profitability analysis is gathering the financial data of your
business. First, collect all financial statements so that you have accurate details of business
revenue and expenditures.
Step 2: CalculateBreak-Even Analysis
Then, the next step is to calculate the break-even analysis (as mentioned above), especially
when you are planning to invest in a new idea or business.
8
Break-even cost can be calculated by using this formula:
Break-even cost = fixed costs/contribution margin ratio
Contribution margin ratio = unit price – variable cost per unit/unit price
Step 3: UseMargin orRevenueRatios
You can use different margin ratio or revenue ratio formulas to calculate the profitability of the
business.
An Exampleof Profitability Analysis
Take a steel manufacturing company that has been facing decreased profits over the last three
years. However, the company has made significant profits in the past six months, and it has
received an invitation to bid for a project. The management of the company has to figure out
whether the company is in a position to take on a new project, and whether the profits
generated through this project will be sufficient to sustain the business. In fact, the company
will have to calculate the break-even point (explained later in the article) and use profitability
ratios to determine whether it can take on a new project.
Maximizing profits is one of the fundamental rules of running a business. Whether you are a
finance professional or a business leader, you must know what is profitability analysis and how
to calculate it. Emeritus offers several online finance courses to help you learn profitability
analysis and other advanced financial concepts. Do check them out and upskill to boost your
career.
CHAPTER 2
COMPANY PROFILE
AND INDUSTRY
PROFILE
9
INDUSTRY PROFILE:
One of the primary forces behind industrialization has been the use of metals. Steel has
traditionally occupied a top spot among metals. Steel production and consumption are
frequently seen as measures of a country's economic development because it is both a raw
material and an intermediary product. Therefore, it would not be an exaggeration to argue
that the steel sector has always been at the forefront of industrial progress and that it is the
foundation of any economy. The Indian steel industry is classified into three categories -
major producers, main producers and secondary producers. The industry in India is classified
based on the nature of the manufacturing companies into Integrated Steel Producers (ISP) and
Secondary Producers. Integrated Steel Producers are companies that are present throughout
the steel value chain - starting from the extraction of Iron Ore to the manufacturing and
marketing of finished steel. The Integrated Steel Producers account for around 55.0 % of
finished steel production in India. The integrated steel players in India include Steel
Authority of India, Rashtriya Ispat Nigam Limited (Vizag Steel), Tata Steel, JSPL, JSW Steel
and Essar Steel. The Mini Steel Plant/ Processing Units in the iron and steel industry which
accounts for about 45 % total finished steel production, is composed of production units
which are a diverse lot with widely varying product range, technology and scale of operation
and include major product/industry segments such as pig iron produced by mini blast
furnaces (MBFs), sponge iron, steel produced in electric arc (EAFs) or Induction Furnaces
(IFs), 4 standalone cold rolled steel sheets and coils producers, re-rollers producing hot rolled
long products such as rebars, wire rods and structurals, standalone GP/GC and color coated
steel sheets/coil producers, wire drawing units, standalone tinplate producers etc. The units
covered under the Secondary Sector produce either a product that serves a basic raw material
to steel making such as pig iron or sponge iron or they use a semi finished or intermediate
steel product to convert the same to another product of higher value. The sector also includes
crude steel (semi finished products such as ingots, billets and blooms) produced using electric
arc or induction furnaces using scrap or DRI in capacities less than one million tonne a year.
These units are generally small in size compared to the integrated steel
As of April 2022, India was the world's second-largest producer of crude steel, with an output
of 10.14 MT. In FY22, the production of crude steel and finished steel stood at 133.596 MT
and 120.01 MT, respectively. In April-Oct 2022, the production of crude steel and finished
steel stood at 71.56 MT and 68.17 MT respectively. The growth in the Indian steel sector has
10
been driven by the domestic availability of raw materials such as iron ore and cost-effective
labour. Consequently, the steel sector has been a major contributor to India's manufacturing
output.
The Indian steel industry is modern, with state-of-the-art steel mills. It has always strived for
continuous modernisation of older plants and up-gradation to higher energy efficiency levels.
MARKET SIZE
In the past 10–12 years, India's steel sector has expanded significantly. Production has
increased by 75% since 2008, while domestic steel demand has increased by almost 80%.
The capacity for producing steel has grown concurrently, and the rise has been largely
organic.
In FY22, the production of crude steel and finished steel stood at 133.596 MT and 120.01
MT, respectively. The consumption of finished steel stood at 105.751 MT in FY22. In April
2022, India's finished steel consumption stood at 9.072 MT. In April-July 2022, the
production of crude steel and finished steel stood at 40.95 MT and 38.55 MT respectively.
In FY22, exports and imports of finished steel stood at 13.49 MT and 4.67 MT, respectively.
In FY22, India's export rose by 25.1% YoY, compared with 2021. In FY21, India exported
9.49 MT of finished steel. In July 2022 exports of finished steel stood at 3.80 lakh MT.
The annual production of steel is anticipated to exceed 300 million tonnes by 2030–2031. By
2030–31, crude steel production is projected to reach 255 million tonnes at 85% capacity
utilisation achieving 230 million tonnes of finished steel production, assuming a 10% yield
11
loss or a 90% conversion ratio for the conversion of raw steel to finished steel. With net
exports of 24 million tonnes, consumption is expected to reach 206 million tonnes by the
years 2030–1931. As a result, it is anticipated that per-person steel consumption will grow to
160 kg.
INVESTMENTS
The steel industry and its associated mining and metallurgy sectors have seen major
investments and developments in the recent past.
According to the data released by the Department for Promotion of Industry and Internal
Trade (DPIIT), between April 2000-September 2022, Indian metallurgical industries attracted
FDI inflows of US$ 17.09 billion.
In FY22, demand for steel is expected to increase by 17% to 110 million tonnes, driven by
rising construction activities.
Some of the major investments in the Indian steel industry are as follows:
 In September 2022, Steel Authority of India Limited (JINDAL STELL AND POWER), a
Maharatna PSU, supplied 30,000 tonnes of the entire DMR grade specialty steel for the
nation’s first indigenously built Aircraft Carrier INS Vikrant.
12
 In August 2022, Tata Steel signed an MoU with Punjab Government to set up a steel scrap
based electric arc furnace steel plant.
 In May 2022, Tata Steel announced a CAPEX of Rs. 12,000 crores (US$ 1.50 billion).
 In October 2021, Tata Steel was planning to set up more scrap-based facilities that will have
a capacity of at least a billion tonnes by 2025.
 In October 2021, JSW Steel invested Rs. 150 billion (US$ 19.9 million) to build a steel plant
in Jammu and Kashmir and boost manufacturing in the region.
 In October 2021, ArcelorMittal and Nippon Steel Corp.'s joint venture steel firm in India,
announced a plan to expand its operations in the country by investing ~Rs. 1 trillion (US$
13.34 billion) over 10 years.
 In August 2021, Tata Steel announced to invest Rs. 8,000 crore (US$ 1.08 billion) in capital
expenditure to develop operations in India in FY22.
 In August 2021, ArcelorMittal announced to invest Rs. 1 lakh crore (US$ 13.48 billion) in
Gujarat for capacity expansion.
 In August 2021, Tata Steel announced to invest Rs. 3,000 crore (US$ 404.46 million) in
Jharkhand to expand capacities over the next three years.
 In August 2021, Jindal Steel & Power Ltd. announced plans to invest US$ 2.4 billion to
increase capacity over the next six years to meet the rising demand from customers.
 In the next three years from June 2021, JSW Steel is planning to invest Rs. 47,457 crore (US$
6.36 billion) to increase Vijayanagar's steel plant capacity by 5 MTPA and establish a mining
infrastructure in Odisha.
13
GOVERNMENT INITIATIVES
Some of the other recent Government initiatives in this sector are as follows:
 In October 2021, the government announced guidelines for the approved specialty steel
production-linked incentive (PLI) scheme.
 In October 2021, India and Russia signed an MoU to carry out R&D in the steel sector and
produce coking coal (used in steel making).
 In July 2021, the Union Cabinet approved the production-linked incentive (PLI) scheme for
specialty steel. The scheme is expected to attract investment worth ~Rs. 400 billion (US$
5.37 billion) and expand specialty steel capacity by 25 million tonnes (MT), to 42 MT in
FY27, from 18 MT in FY21.
 In June 2021, Minister of Steel & Petroleum & Natural Gas, Mr. Dharmendra Pradhan
addressed the webinar on 'Making Eastern India a manufacturing hub with respect to
metallurgical industries', organised by the Indian Institute of Metals. In 2020, 'Mission
Purvodaya' was launched to accelerate the development of the eastern states of India (Odisha,
Jharkhand, Chhattisgarh, West Bengal and the northern part of Andhra Pradesh) through the
establishment of an integrated steel hub in Kolkata, West Bengal. Eastern India has the
potential to add >75% of the country's incremental steel capacity. It is expected that of the
300 MT capacity by 2030-31, >200 MT can come from this region alone.
 In June 2021, JSW Steel, CSIR-National Chemical Lab (NCL), Scottish Development
International (SDI) and India H2 Alliance (IH2A) joined forces to commercialise hydrogen in
the steel and cement sectors.
 Under the Union Budget 2022-23, the government allocated Rs. 47 crore (US$ 6.2 million) to
the Ministry of Steel. The budget's focus is on creating infrastructure and manufacturing to
propel the economy.
 In addition, enhanced outlays for key sectors such as defence services, railways, roads,
transport and highways would provide impetus to steel consumption.
14
 In January 2021, the Ministry of Steel, Government of India, signed a Memorandum of
Cooperation (MoC) with the Ministry of Economy, Trade and Industry, Government of
Japan, to boost the steel sector through joint activities under the framework of India–Japan
Steel Dialogue.
 The Union Cabinet, Government of India approved the National Steel Policy (NSP) 2017, as
it intends to create a globally competitive steel industry in India. NSP 2017 envisage 300
million tonnes (MT) steel-making capacity and 160 kgs per capita steel consumption by
2030-31.
 The Ministry of Steel is facilitating the setting up of an industry driven Steel Research and
Technology Mission of India (SRTMI) in association with the public and private sector steel
companies to spearhead research and development activities in the iron and steel industry at
an initial corpus of Rs. 200 crore (US$ 30 million).
 The Government of India raised import duty on most steel items twice, each time by 2.5%
and imposed measures including anti-dumping and safeguard duties on iron and steel items.
Global Scenario In Jan-May 2019, the world crude steel production reached 764.072 million
tonnes (mt) and showed a growth of 5.03% over Jan-May 2018. China remained world’s
largest crude steel producer in same period (404.879 mt) followed by India (45.314 mt),
Japan (42.294 mt) and the USA (37.169 mt). World Steel Association has projected Indian
steel demand to grow by7.1% in 2019 while globally, steel demand has been projected to
grow by 1.3% in 2019. Chinese steel use is projected to show 1.0% growth in 2019. Per
capita finished steel consumption in 2018 was 224.5 kg for world and 590.1 kg for China
(Source: World Steel Association). The same for India was 70.9 kg in 2018.
Domestic Scenario The Indian steel industry has entered into a new development stage, post
de-regulation, riding high on the resurgent economy and rising demand for steel. Rapid rise in
production has resulted in India becoming the 2nd largest producer of crude steel during
2018, from its 3rd largest status in 2017. The country is also the largest producer of Sponge
Iron or DRI in the world and the 3rd largest finished steel consumer in the world after China
& USA. In 2018-19, production of total finished steel (alloy + non alloy) was 131.572 mt, a
growth of 3.7% over last year
15
National Steel Policy-2017
With passage of time and continued growth in the domestic steel industry, it was felt that the
NSP 2005 needs to be in sync with changing times. 5 Accordingly, after a detailed review,
the Government has released the National Steel Policy 2017, which has laid down the broad
roadmap for encouraging long term growth for the Indian steel industry, both on demand and
supply sides, by 2030- 31, with a vision to create a technologically advanced and globally
competitive steel industry that promotes economic growth. The National Steel Policy aims at
building a globally competitive industry with a crude steel capacity of 300 MT by 2030-
31from present level of 125 million tons per annum (MTPA and increase per Capita Steel
Consumption to 160 Kgs. by 2030-31 amongst other objectives. The creation of additional
capacity for fulfilling the anticipated demand will require significant capital investment of
about Rs. 10 lakh Crore by 2030-31 and will also increase employment in the range of 6 36
Lakhs by 2030-31 from the current level of 25 Lakhs i.e. around 1 million additional work-
forces through direct & indirect opportunities. Hence ensuring safety of the people going to
be deployed in executing the new projects along with that of existing manpower would be a
crucial factor amongst others in achieving the policy objectives and sustainable growth of
industry as well.
Occupational Safety & Working Conditions Management in India Iron and
Steel Industry
Under the Constitution of India, labour is a subject in the concurrent list (under 7 th
schedule) where both the Central and the State Governments are competent to enact
legislation subject to certain matters reserved for the Central Government. The Constitution
of India provides detailed provisions for the rights of the citizens and also lays down the
principles in the governance of the country called as “Directive Principles of State Policy”.
These Directive Principles provide for securing the safety and health and strength of
employees, men and women, that the tender age of children are not abused, that citizens are
not forced by economic necessity to enter avocations unsuited to their age or strength (Article
39), just and humane conditions of work and maternity relief are provided (Article 42), that
the Government shall take steps, by suitable legislation or in any other way, to secure the
participation of employee in the management of enterprises, establishments or other
16
organizations engaged in any industry (Article 43A), for ensuring that no child below the age
of 14 is employed to work in any factory or mine or engaged in any other hazardous
employment (Article 24). On the basis of Directive Principles as well as international
instruments, the Government of India, Ministry of Labour & Employment, had declared the
National Policy on Safety, Health and Environment at Workplace (NPSHEW) on 20th
February, 2009. The purpose of this National Policy is to establish a preventive safety and
health culture in the country through elimination of the incidents of work related injuries,
diseases, fatalities, disasters and to enhance the well being of employees in all the sectors of
economic activity in the country.
Major Laws relating to Occupational Safety & Working Conditions
Management
There are four main legislations that cover Occupational Safety & Working Conditions
Management at workplace.
(i) The Factories Act, 1948 , covering factories wherein the enforcement of safety at
workplace is by the Chief Inspector of Factories in the respective states,
(ii) The Mines Act, 1952 and Mines Rules, 1955 for mining industry where the enforcement
is by the Directorate General of Mines Safety (DGMS) under Ministry of Labour &
Employment , Government of India,
(iii) The Dock Workers (Safety, Health and Welfare) Act, 1986 followed by notification of
the Dock Workers (Safety, Health and Welfare) Regulations, 1990 dealing with the major
ports of India and the enforcement is by the Directorate General of Factory Advice Service &
Labour Institutes (DGFASLI), under Ministry of Labour & Employment , Government of
India.
(iv) The Building & Other Construction Workers (Regulations of Employment and
Conditions of Service) Act, 1996 , covering construction workers at construction sites
wherein the enforcement is by the Directorate General Labour Welfare in the central sphere
and by the Labour Commissioners/Factory Inspectorates in the States/UTs
17
Status of Safety in the Steel Industry
Occupational Safety & Working Conditions is relatively neglected area by Indian industry
and because of this while India has approximately 3% share of global manufacturing, India
has almost 30% share of the industrial fatalities globally. Even Steel industry in India lags its
global peers on this parameter and has patchy safety performance with many major incidents
involving multiple fatalities. Most of the companies actually do not even have a proper safety
management system comparable to global best practices. Though most of large ISPs are
OHSAS- 18001 certified, never the less their contribution in workplace fatalities is not
insignificant. Contractor workers which accounts for nearly half of the manpower deployed
in steel industry are more susceptible to incidents as they are unskilled, not so educated and
unaware of the hazardous work environment. However, in-spite of all efforts, their share in
fatalities continues to be higher on year to year basis. Safety is still being managed in
isolation and not as an essential / integral part of overall business decisions, culture &
performance in most of the organizations. Efforts for benchmarking by taking lessons from
past failures & good practices from peer industry are limited to few organizations only.
Hazards in Steel Industry
Hazards in Primary/ Integrated Steel Making
Integrated Iron and Steel Industry inherently has many potential hazards which need to be
mitigated properly. The Industry has been classified as hazardous process industry as per
Chapter 1 Sec-2 (cb) of Factories Act 1948 (Amended in 1987). The hazards mainly emanate
from extremely high temperature process involving liquid metal, generation of by-product
gases which have toxic and explosive constituents, large amount of material handling/
transporting and manpower intensive multi-unit operations. The hazardous chemicals,
electricity, steam, working at height, working in confined space etc. in addition to project
activities add to the risks, especially when they are carried out besides the existing operating
units. The various hazards along with the areas of their presence are enumerated in the table
belowType of Hazard/Risk Major areas where Hazard is faced Toxic gases (rich in Carbon
monoxide) All over the plant Explosive Gases (Rich in Hydrogen and Methane) All over the
plant Harmful Chemicals Coal Chemicals plant, CRM Liquid metal/ slag (burn, Blast
Furnace, SMS, Continuous casting, 9 explosions) Foundries Extreme Temperature (-180 OC
18
to 1700 OC) Coke Ovens, Blast Furnace, SMS, Continuous casting, Foundries, Rolling Mills
and Cryogenic Oxygen Plant Fire All over the plant Electric Shock, Electrocution, Flash over
All over the plant and project sites Rail/ Road Traffic Movement All over the plant and
project sites Moving/ Rotating machines (Hit, Caught, pressed etc.) All over the plant and
project sites Working at Height All over the plant and project sites Dust, noise, heat and
Vibration All over the plant Material Handling All over the plant and project sites Confined
Space (suffocation/ gas poisoning) Furnaces, Tanks, Gas Pipelines, Gas holders, Sumps, Pits,
Oil cellar, Conveyor/ cable galleries, Silos, etc. High pressure Steam, Water & industrial
gases All over the plant The above safety hazards are associated with varying levels of risks
which may lead to injuries as given in the table belowSl. No. Type of hazards A Physical
Hazards Sub type Hazard description / Risk Noise Exposure to noise levels exceeding those
set by the competent authorities may result in noise-induced hearing loss. Exposure to high
noise levels may also interfere with communication and may result in nervous fatigue with an
increased risk of occupational injury.
Vibration Exposure of workers to hazardous vibration is mainly known as:
(a) whole-body vibration, when the body is supported on a surface that is vibrating, which
occurs in all forms of transport and when working near vibrating industrial machinery
(b) Hand-transmitted vibration, which enters the body through the hands and is caused by
various processes in which vibrating tools or work pieces are grasped or pushed by the hands
or fingers.
Heat and cold stress Risks arise in special conditions:
(a) temperature and/or humidity are unusually high
(b) workers are exposed to high radiant heat
(c) high temperatures and/or humidity occur in combination with heavy protective clothing
or a high work rate
19
(d) temperature is unusually low; 10 Lack of proper illumination Poor lighting affects the
Occupational Safety & Working Conditions of people at work causing symptoms like
eyestrain, migraine and headaches. Symptoms of this include headaches, lethargy, irritability
and poor concentration. Work equipment and machinery guarding The use of work
equipment, including machinery and hand and portable power tools, may result in incidents,
many of which are serious and some fatal. Lack of guards or inadequate guards, interlocks,
safety devices, improper maintenance, no adherence to SMPs etc. can lead to incidents
caused by entanglement, sheering, crushing, trapping, cutting, etc. Cranes and hoists All
machinery used to lift and/or transport equipment, materials, molten metal or slag should be
designed, constructed and erected, inspected, maintained and operated as specified by the
manufacturer/ site specific SOPs/ SMPs which otherwise would lead to crane failure /
overturning , failure of tools & tackles like slings etc. leading to material slippage, hitting
nearby structures/ overhead line etc. Control of hazardous energy The iron and steel industry
regularly uses different sources of energy (electric, mechanical, hydraulic, pneumatic, etc.).
The safe control of energy should be addressed by procedure and carried out by appropriately
trained personnel in accordance with the nature of the energy source and the characteristics of
the facilities. Falling objects Failure to properly secure loose materials at height, maintaining
proper stack heights, preventing unauthorized entry etc. leading to fall of objects and hitting a
nearby person Slips, trips and falls Inadequate housekeeping, improper covers on opening,
unsuitable platforms or walkways equipped with handrails and protective barriers etc. may
lead slip & trip injuries. Fall from height may occur due to non -usage of fall arrest
equipment. Rail & road transport Internal transport, such as road and rail vehicles, transfer
cars etc. used in the transport of raw materials, intermediates, products, waste etc. has the
potential to cause injuries to workers and other people. The hazards can be caused by
interaction between vehicles, vehicles and other objects and personnel, or by loads falling off
or from the vehicle. Fire & explosion Steel Plants stores & handles number of flammable
chemicals like tar, naptha, benzol, fuel gases, oils, LPG, Propane, Oxygen etc. which possess
potential fire & explosion hazards. Hot metal/ slag sparks, welding sparks, electrical short
circuiting etc. can also lead to fire in surrounding areas if combustible materials are present.
Confined spaces Bin, silos, tunnels, ESPs, manholes, etc. are examples of confined spaces
where entry of persons & carrying out jobs requires special precautions. Toxic or flammable
gases, oxygen displacement and engulfment are the principal 11 hazards. B Chemical
Hazards Sub type Hazard description / Risk Chemicals in the workplace These substances
may present a hazard as the result of contact with the body or absorption into the body.
20
Absorption can occur through the skin, by ingestion or by inhalation. Chemicals can have
acute (short-term) and/or chronic (long-term) Health effects. Chemicals may present a safety
hazard as a result of their chemical and physical properties. Inhalable agents (gases, vapours,
dusts and fumes) The production of iron and steel involves the consumption and generation
of a variety of inhalable agents including, but not limited to, gases, vapours, dusts, fumes,
smokes and aerosols. These agents comprise a variety of toxicological hazards including
irritants, chemical asphyxiants, fibrogens, allergens, carcinogens and systemic toxicants. The
pulmonary system (lungs) can be affected by exposure to harmful agents through acute
(short-term) injury to lung tissue, the development of pneumoconiosis, pulmonary
dysfunction and the development of lung cancer. Silica dust is most harmful to lungs and
causes silicosis. Certain harmful agents that are inhaled through the lungs can cause target
organ damage and/or systemic toxic effects. Certain asphyxiants can cause death in a matter
of seconds at high concentrations by displacing oxygen. Specific agents that may be found in
the iron and steel industry include heavy metals (e.g. lead, chromium, zinc, nickel and
manganese) in the form of fumes, particulates and adsorbates on inert dust particles. Acid
mists from pickling areas can cause skin, eye and respiratory irritation. C Radiation Hazards
Sub type Hazard description / Risk Ionizing radiation All exposure to ionizing radiation
should be kept as low as possible, as there is evidence that damage caused by radiation may
be permanent, and that there is a significant increase in the incidence of cancer and some
types of malignancies, as a consequence of even low doses of ionizing radiation. Radiation
levels to be periodically measured through installation of Radiation Detection Equipments as
per amended 2nd Schedule of Factories Act. Non-ionizing radiation Non-ionizing radiation is
usually referred to as ultraviolet (UV), visible and infrared (IR) radiation Absorption in the
UV and visible portions of the spectrum produces photochemical reactions. In the IR region,
all of the absorbed radiant energy is converted into heat. Exposure to some radio-frequency
and microwave radiation can result in the formation of cataracts of the eye. Exposure of the
eyes to visible and IR radiation can cause thermal injury to the retina and damage to the lens,
which may result in the formation of cataracts. Exposure of the eyes to UV radiation can
result in 12 inflammation of the conjunctiva and cornea. D Ergonomic Hazards Hazard
description / Risk These hazards are due to tool design, equipment design, job and task
design, work station design, and manual handling etc. E Psychological Hazards Hazard
description / Risk These hazards are due to shift work, work load, harassment, discrimination,
bullying, and stress etc
21
ROAD AHEAD
The steel industry has emerged as a major focus area given the dependence of a diverse range
of sectors on its output as India works to become a manufacturing powerhouse through policy
initiatives like Make in India. With the industry accounting for about 2% of the nation's GDP,
India ranks as the world's second-largest producer of steel and is poised to overtake China as
the world's second-largest consumer of steel. Both the industry and the nation's export
manufacturing capacity have the potential to help India regain its favourable steel trade
balance.
The National Steel Policy, 2017 envisage 300 million tonnes of production capacity by 2030-
31. The per capita consumption of steel has increased from 57.6 kgs to 74.1 kgs during the
last five years. The government has a fixed objective of increasing rural consumption of steel
from the current 19.6 kg/per capita to 38 kg/per capita by 2030-31. As per Indian Steel
Association (ISA), steel demand will grow by 7.2% in 2019-20 and 2020-21.
Huge scope for growth is offered by India's comparatively low per capita steel consumption
and the expected rise in consumption due to increased infrastructure construction and the
thriving automobile and railways sectors.
Industry Contacts
 Steel Authority of India Ltd
 Ministry of Steel
 Aluminium Association of India
 Federation of Indian Mineral Industries
 Indian Stainless Steel Development Association
States with the Highest Steel-Producing Capacity in India
 Odisha
 Chhattisgarh
 Jharkhand
22
 Karnataka
ROBUST DEMAND
*India’s finished steel consumption is anticipated to increase to 230 MT by 2030-31 from
133.596 MT in FY22.
*As of October 2021, India was the world’s second-largest producer of crude steel, with an output
of 9.8 MT.
INCREASING INVESTMENTS
The industry is witnessing consolidation of players, which has led to investment by entities from
other sectors. The ongoing consolidation also presents an opportunity to global players to enter
the Indian market.
POLICY SUPPORT
*In October 2021, the government announced guidelines for the approved specialty steel
production-linked incentive (PLI) scheme.
23
*Under the Union Budget 2022-23, the government allocated Rs. 47 crore (US$ 6.2 million) to
the Ministry of Steel.
COMPETITIVE ADVANTAGE
*As of September 2021, India was the world’s second-largest producer of crude steel, with an
output of 9.5 MT.
*Easy availability of low-cost manpower and presence of abundant iron ore reserves make India
competitive in the global set up.
*India is home to fifth-highest reserves of iron ore in the world.
JSW STEEL LTD
JSW Steel is a flagship company of the JSW Group. The company is a leading integrated steel
manufacturer. Currently one of the fastest-growing companies in India, it has a presence in over
100 countries. JSW is also the first company to manufacture high-strength and advanced high-end
steel products for its automotive segments.
With the largest product portfolio in steel, the company is also India's largest steel exporter,
shipping to over 100 countries across five continents. With plants in Karnataka, Tamil Nadu, and
Maharashtra, it has the capacity to produce 18 MTPA. Now, as the company ramp-ups production
plans, it is on track to hit the 40 MTPA mark, within a span of 10 years.
JSW Steel plans to increase its capacity to produce around 27 million tonnes (MT) of crude steel
by financial year 2022 from about 18 MT in fiscal year 2020.
The US$ 22 billion JSW Group is ranked among India's leading business houses. JSW's
innovative and sustainable presence in various sectors including Steel, Energy, Infrastructure,
Cement, Paints, Venture Capital and Sports is helping the Group play an important role in driving
India’s economic growth. The Group strives for excellence by leveraging its strengths &
capabilities including a successful track-record of executing large capital-intensive & technically
complex projects, differentiated product-mix, state-of-the-art manufacturing facilities and greater
focus on pursuing sustainable growth.
24
With a culturally diverse workforce spread across India, USA, Europe and Africa, JSW Group
directly employs nearly 40,000 people.
It also has a strong social development focus aimed at empowering local communities residing
around its Plant & Port locations. JSW Group is known to create value for all its stakeholders by
combining its growth roadmap, superior execution capabilities and a relentless drive to be
#BetterEveryday.
TATA STEEL LTD
Tata Steel is currently the world’s second-most geographically diversified steel producer with an
annual crude steel capacity of 34 million tonnes per annum (MTPA). The company one of the few
steel operations that is fully integrated – from mining to the manufacturing and marketing of
finished products. Continuous improvement in its product and service portfolio, along with
success in value creating initiatives for customers, allows the company to serve global growth
markets. Today, it operates in 26 countries and has a commercial presence in over 50 countries
with employees across five continents. The company’s raw material operations are spread across
India and Canada which helps it to be self-sufficient in steel production.The company is dominant
in various parts of the world mainly India ,Europe and South-East Asia.
INDIA
Tata Steel was established in India as Asia’s first integrated private steel company in 1907. With
this, we also developed India’s first industrial city at Jamshedpur. Today, we are among the
leading global steel companies. Our annual crude steel capacity across Indian operations is nearly
20 MnTPA and we registered a turnover of INR 91,037 crore in FY21. We also set up our second
greenfield steel plant of 3 MnTPA in the eastern state of Odisha in 2016; the expansion to 8
MnTPA in currently underway. We possess and operate captive mines that help us maintain cost-
competitiveness and production efficiencies through an uninterrupted supply of raw material. This
is how we ensure that we remain the lowest cost producer of steel in Asia.
The Indian product portfolio is divided into four segments – Automotive and Special Products;
Industrial Products, Projects and Exports; Branded Products and Retail; and Services and
25
Solutions. The Company supplies hot-rolled, cold-rolled, galvanised, branded solution offerings
and more.
EUROPE
Tata Steel is one of the largest steel producers in Europe with a crude steel production capacity of
over 12.4 MnTPA. We established our presence in the European continent after acquiring Corus
in 2007. The manufacturing facilities in Europe comprise primary steel-making facilities in the
Netherlands and the United Kingdom, with downstream operations in the Netherlands, the United
Kingdom, Germany, France, Belgium, Sweden, and Turkey. The European operations produce a
wide range of high-quality quality strip steel products for demanding markets such as
construction, automotive, packaging and engineering.
SOUTH-EAST ASIA
Tata Steel’s operations in South-East Asia, with 2.2 MnTPA capacity, began in 2004 with the
acquisition of NatSteel, Singapore. The operations are run by NatSteel Holdings Pte Ltd., a
wholly-owned subsidiary of Tata Steel. The Company’s flagship facility at Singapore is one of
the largest single downstream rebar fabrication operations in the world. This plant is the only
local steel mill with an integrated upstream and downstream operation, where steel is
manufactured through recycling scrap, and fabricated according to customers’ needs.
26
In 2015, we acquired a majority stake in Thailand-based steelmaker Millennium Steel, which
strengthened our South-East Asian operations. is the largest and most diverse long steel
manufacturer in Thailand using recyclable steel scrap as raw material. The product range includes
High Tensile Rebars, ready to use Cut & Bend products, light structurals, and specialty wire rods
for making Tire Cord, Tire bead, Wire Ropes, and stick electrodes. The company has a pan
Thailand distribution network and regularly exports steel to Laos, Cambodia, Indonesia,
Malaysia, India, and Bangladesh.
JINDAL STEEL AND POWER LTD
With its timeless business philosophy JSPL is primed to not merely survive but win in a
marketplace marked by frenetic change. Indeed, the company’s scorching success story has been
scripted essentially by its resolve to innovate, set new standards, enhance capabilities, enrich lives
and to ensure that it stays true to its haloed value system. Not surprisingly, the company is very
much a future corporation, poised to become the most preferred steel manufacturer in the country.
JSPL is an industrial powerhouse with a dominant presence in steel, power, mining and
infrastructure sectors. Part of the US $ 18 billion OP Jindal Group this young, agile and
responsive company is constantly expanding its capabilities to fuel its fairy tale journey that has
seen it grow to a US $ 3.3 billion business conglomerate. The company has committed
investments exceeding US $ 30 billion in the future and has several business initiatives running
simultaneously across continents.
Led by Mr Naveen Jindal, the youngest son of the legendary Shri O.P. Jindal, the company
produces economical and efficient steel and power through backward and forward integration.
From the widest flat products to a whole range of long products, JSPL today sports a product
portfolio that caters to markets across the steel value chain. The company produces the world's
longest (121-meter) rails and it is the first in the country to manufacture large-size parallel flange
beams.
JSPL operates the largest coal-based sponge iron plant in the world and has an installed capacity
of 3 MTPA (million tonnes per annum) of steel at Raigarh in Chhattisgarh. Also, it has set up a
0.6 MTPA wire rod mill and a 1 MTPA capacity bar mill at Patratu, Jharkhand, a medium and
27
light structural mill at Raigarh, Chhattisgarh and a 2.5 MTPA steel melting shop and a plate mill
to produce up to 5.00-meter-wide plates at Angul, Odisha.
An enterprising spirit and the ability to discern future trends have been the driving force behind
the company's remarkable growth story. The organisation is wedded to ideals like innovation and
technological leadership and is backed by a highly driven and dedicated workforce of 15000
people.
JSPL has been rated as the second highest value creator in the world by the Boston Consulting
Group, the 11th fastest growing company in India by Business World and has figured in the
Forbes Asia list of Fab 50 companies. It has also been named among the Best Blue Chip
companies and rated as the Highest Wealth Creator by the Dalal Street Journal. Dun & Bradstreet
has ranked it 4th in its list of companies that generated the highest total income in the iron and
steel sector. More
ENVIRONMENTAL ISSUES OF THE STEEL INDUSTRY
 Steel is ‘iron with most of the carbon removed’
 Iron constitutes about five per cent of the Earth's crust and is the fourth most abundant element in
the crust.
 98% of the iron ore mined is used to make steel
 Steel represents around 95% of all metals produced
28
 The biggest producer of steel by far is China (1607 million metric tonnes in 2013), followed by
the EU (165), Japan (110), USA (87) and India (81)
 Steel use per capita increased from 150kg in 2001 to 220kg in 2010 (Wsteel Assoc)
 51% of global steel is used for construction (Wsteel Assoc
 6.5% of CO2 emissions derive from iron and steel production (IEA 2010)
 Iron doesn’t occur naturally. Being highly reactive, it combines easily with other minerals to
form ores. Those with the highest iron content are found near the surface of the earth and are
relatively easy to mine.
 The principal iron ores are hematite (Fe2O3) and magnetite (Fe3O4).
 Most iron ore is extracted through opencast mines.
 To be economically viable for mining, iron ore must contain at least 20% iron.
 The three major sources of iron are China (23%), Australia (18%) and Brazil (18%). (2011
figures)
Iron ore is converted into various types of iron through several processes. The most common
process is the use of a blast furnace to produce pig iron which is about 92-94% iron and 3-5%
carbon with smaller amounts of other elements. Pig iron has only limited uses, and most of this
iron goes on to a steel mill where it is converted into various steel alloys by further reducing the
carbon content and adding other elements such as manganese and nickel to give the steel specific
properties.
Limestone
 Limestone is calcium carbonate (CaCO3). It is mainly composed of the skeletal remains of marine
organisms.
 Geologically, limestone occurs as a sedimentary layer over bedrock. As such it is relatively easy
to extract through quarrying.
 Limestone is removed from the quarry, crushed and transported to steel mills.
Coke
Coke is produced from coal. The coal is heated, or ‘carbonised’ in an oven until it becomes coke.
It is then removed from the oven and cooled before use in the blast furnace. The coal gas
produced during carbonisation is collected and used as a fuel in the manufacturing process while
by-products such as tar, benzole and sulphur are extracted for further refining.
29
Recycling
42% of crude steel produced is recycled material
Re-melting proportion of steel scrap is constrained by availability. Availability can sometimes be
defined as cost effective recovery.
Iron and steel are the world's most recycled materials, and among the easiest materials to
reprocess, as they can be separated magnetically from the waste stream. Recycling is via a
steelworks: scrap is either re-melted in an electric arc furnace (90-100% scrap), or used as part of
the charge in a Basic Oxygen Furnace (around 25% scrap). Any grade of steel can be recycled to
top quality new metal, with no 'downgrading' from prime to lower quality materials as steel is
recycled repeatedly.
Recovery and reuse in construction
Globally around 85% of construction steel is currently recovered from demolition (sourceWSA)
(UK 96% source steelconstruction.info)
Re-use of structural steel
Steel reuse is any process where end-of-life steel is not re-melted but rather enters a new product
use phase.
Steel buildings and products are intrinsically demountable. Easily re-usable components include:
 Piles (sheet and bearing piles)
 Structural members including hollow sections
 Light gauge products such as purlins and rails.
Design for reuse
To facilitate greater reuse it is important that designers not only use steel but also do what they
can to optimise future reuse. Steps that the designer can take to maximise the opportunity for
reusing structural steel include:
30
 End plate beam to column and beam to beam connections
 Use bolted connections in preference to welded joints to allow the structure to be dismantled
during deconstruction
 Use standard connection details including bolt sizes and the spacing of holes
 Ensure easy and permanent access to connections
 Where feasible, try to ensure that the steel is free from coatings or coverings that will prevent
visual assessment of the condition of the steel.
 Minimise the use of fixings to structural steel elements that require welding, drilling holes, or
fixing with Hilti nails; use clamped fittings where possible
 Identify the origin and properties of the component for example by bar-coding or e-tagging or
stamping and keep an inventory of products
 Use long-span beams as they are more likely to allow flexibility of use and to be reusable by
cutting the beam to a new length. (source: SteelConstruction.info)
The environmental impact of steel production
Steel production has a number of impacts on the environment, including air emissions (CO, SOx,
NOx, PM2), wastewater contaminants, hazardous wastes, and solid wastes. The major
environmental impacts from integrated steel mills are from coking and iron-making.
Climate change
Virtually all of the greenhouse gas emissions associated with steel production are from the carbon
dioxide emissions related to energy consumption.
Emissions to air
Coke production is one of the major pollution sources from steel production. Air emissions such
as coke oven gas, naphthalene, ammonium compounds, crude light oil, sulfur and coke dust are
released from coke ovens.
Emissions to water
Water emissions come from the water used to cool coke after it has finished baking. Quenching
water becomes contaminated with coke breezes and other compounds. While the volume of
31
contaminated water can be great, quenching water is fairly easy to reuse. Most pollutants can be
removed by filtration.
Waste
Slag, the limestone and iron ore impurities collected at the top of the molten iron, make up the
largest portion of iron-making by-products. Sulfur dioxide and hydrogen sulfide are volatized and
captured in air emissions control equipment and the residual slag is sold to the construction
industry. While this is not a pollution prevention technique, the solid waste does not reach
landfills.
Gaseous emissions and metal dust are the most prominent sources of waste from electric arc
furnaces.
CHAPTER 3
REVIEW
OF
LITERATURE
32
Profit Analysis
Introduction to Profit Analysis
In managerial economics, profit analysis is a form of cost accounting used for elementary instruction
and short run decisions. A profit analysis widens the use of info provided by breakeven analysis. An
important part of profit analysis is the point where total revenues and total costs are equal. At this
breakeven point, the company does not experience any income or any loss.
Components of Profit Analysis
The key components involved in profit analysis include:
• Selling price per unit
• Level or volume of activity
• Total fixed costs
• Per unit variable cost
• Sales mix
Assumptions in Profit Analysis
The profit analysis incorporates the following assumptions:
• Unvarying sales price,
• Unvarying variable cost per unit,
• Unvarying total fixed cost,
• Unvarying sales mix,
• Units sold equal units produced.
These are largely linearizing and simplifying assumptions, which are frequently presumed in
elementary discussions of costs and profits. In more advanced accounting treatments, costs and
revenue are nonlinear thus making the analysis more complicated.
33
Applications of Profit Analysis
The profit analysis is helpful in simplifying the calculation of breakeven in breakeven analysis.
Besides, it is generally helpful in simple calculation of Target Income Sales. Moreover, it also
simplifies the process of analyzing short run trade-offs in operational decisions.
Method adopted for Profit Analysis
The main method adopted to carry out profit analysis is the profit volume ratio which is calculated by
dividing the shareholders contribution by the sales and then multiplying it by 100 as follows:
Profit Volume Ratio = (Shareholder’s contribution / Sales) * 100
Limitations of Profit Analysis
The profit analysis is a short run and marginal analysis which presumes the unit variable costs and the
unit revenues to be constant. This is, however, appropriate for small deviations from current production
and sales. Besides, the profit analysis also presumes a neat division between variable costs and fixed
costs, though in the long run, all costs are variable. Therefore, for longer term profit analysis
considering the complete life-cycle of a product it is preferable to carry out activity-based costing or
throughout accounting.
Conceptual Review
Financial performance is the process of measuring the results of a firm’s policies and operations in
monetary terms. It is used to measure firm’s overall financial health over a given period of time and
can also be used to compare similar firms across the same industry or to compare industries or sectors
in aggregation. It also includes analysis and interpretation of various financial statements These are
important factors used for the analysis of financial performance of the company. It refers to the degree
to which financial objectives being or has been accomplished and is an important aspect of finance
risk management. It can measure a firm’s wealth Financial performance analysis includes analysis and
interpretation of financial statements in such a way that it undertakes full diagnosis of theprofitability
and financial soundness of the business. Ratio analysis and comparative statements are the important
tools used for the analysis of the financial performance of that particular company.
34
Ratio analysis
Ratio analysis is a quantitative method of gaining insight into a company's liquidity, operational
efficiency, and profitability by studying its financial statements such as the balance sheet and income
statement. Ratio analysis is a cornerstone of fundamental equity analysis.
A) Liquidity ratio
Liquidity refers to the ability of the concern to meet its current obligations as and when these become
due. These ratios measure short term solvency of a firm.
1. Current ratios: It may be defined as the relationship between current assets and current
liabilities. It is also known as working capital ratio. It is most widely used to make the analysis of a
short-term financial position of the firm.
2. Liquid ratio: It is the ratio of liquid assets to current liabilities. It is the measure of instant debt
paying ability of the business enterprise. It is also known as quick ratio, acid test ratio, or near money
ratio.
3. Absolute liquid ratio: It is calculated by dividing absolute liquid assets like cash in hand, cash
at bank and marketable securities by current liability. It is also known as cash ratio.
B) Solvency ratio (long term solvency ratio)
The term solvency means the ability of the firm to pay of its outside liabilities, that is, its long term
and short term. Solvency ratio is also known as long term solvency ratio or long-term liquidity ratio.
1. Debt-equity ratio: It expresses the relationship between long term debt and equity. Long term
debt means funds invested by the outsiders. It includes debentures, mortgages, all long-term loans etc.
2. Proprietary ratio: It establishes the relationship between shareholders’ or proprietors’ fund and
total assets. It shows how much funds have been contributed by shareholders in the total assets of the
firm. It is also known as equity ratio or net worth ratio.
3. Solvency ratio: This ratio expresses the relationship between total assets and total liabilities of
a business. A firm is said to be solvent when it has assets worth more than its outsiders’ liabilities. It
is also known as ratio of total assets to total debt.
4. Fixed asset to net worth ratio: This ratio establishes the relationship between two components
that is fixed assets and proprietors’ fund. This ratio indicates the extent to which shareholders’ funds
are invested in the fixed assets. This ratio is also known as proprietors’ fund ratio.
35
5. Fixed asset ratio: This ratio establishes the relationship between two components that is, fixed
assets and long-term funds. Long term fund includes, shareholders’ fund and long term borrowed
funds. Thus, it is called capital employed.
6. Capital gearing ratio: The gearing ratio is a measure of financial risk and expresses the amount
of a company’s debt in terms of its equity. The term capital gearing means, the proportion between
fixed income bearing funds and equity.
C) Profitability ratio
1. Gross profit ratio: Gross profit ratio (GP ratio) is a financial ratio that measures the performance
and efficiency of a business by dividing its gross profit figure by the total net sales. It is then called
gross profit percentage or gross profit margin.
2. Net profit ratio: The net profit percentage is the ratio of after-tax profits to net sales. It reveals
the remaining profit after all costs of production, administration, and financing have been deducted
from sales, and income taxes recognized. It is also used to compare the results of a business with its
competitors.
3. Operating cost ratio: It is computed by dividing operating expenses of a particular period by
net sales made during that period. It is also known as operating expense ratio.
4. Operating profit ratio: The operating profit margin ratio indicates how much profit a company
makes after paying for variable costs of production such as wages, raw materials, etc. It is also
expressed as a percentage of sales and then shows the efficiency of a company controlling the costs
and expenses associated with business operations.
Comparative balance sheet
A comparative balance sheet is a statement that shows the financial position of an organization over
different periods for which comparison is made or required. The financial position is compared with 2
or more periods to depict the trend, direction of change, analyze and take suitable actions. It is the
study of trend of same items, group of items and computed items in two or more balance sheets of the
same concern at different period.
Preparing Comparative Financial Statements is the most commonly used technique for analyzing
financial statements. This technique determines the profitability and financial position of a business
by comparing financial statements. Hence, this technique is also termed as Horizontal Analysis.
36
Typically, the income statements and balance sheets are prepared in a comparative form to undertake
such an analysis. In this study, the balance sheets of past five years are taken for the comparative
analysis.
Interpretation of the comparative balance sheet is made on the basis of current financial position,
liquidity position, long term financial position and profitability of the concern. The excess of current
assets over current liability will give the figure of working capital. An increase in working capital
means an increase in current financial position of the company. And excess current assets over current
liabilities show a good short term financial position. If liquid assets like cash in hand, cash at bank,
bills receivable, debtors etc. shows an increase in current year when compared to the base year, this
improves the liquidity position of the concern. Long term financial position of the concern can be
analyzed by studying the changes in fixed assets, long term liabilities and capital. Increase in fixed
assets is compared with increase in long term liabilities and capital. If, increase in fixed asset is more
than increase in long term liabilities, it is meant for that part of fixed assets has been financed by the
working capital. Increase in balance of P&L account and other reserves created from profit will means
an increased profitability of the concern.
Empirical Review-
The empirical review is simply talking about the various researches done by other researchers
concerning your topic or peoples research works that are similar to your research work. The names of
various researchers must be attached to their findings or statement.
An empirical literature review is more commonly called a systematic literature review and it examines
past empirical studies to answer a particular research question. The empirical studies we examine are
usually random controlled trials (RCTs). The literature review helps to form the theoretical basis of
the research.
• Shinde Govind P. & Dubey Manisha (2011) conducted a study considering the segments such as
passenger vehicle, commercial vehicle, and utility vehicle, two and three-wheeler vehicle of key
player’s performance and also made a SWOT analysis and studied key factors influencing growth of
automobile industry.
• Fernandez (2007) says through the study that those who lead to corporate finance every day or are
somehow related to this area, is important to have in mind all these methods and what are behind them.
37
Valuation is not also essential for M&A opportunities but also to understand where the company is
creating or destroying value.
• Anu B. (2015) made an attempt to examine the relationship between capital structure indicators, market
price per shares and also to test relationship between debt-equity and market price per share ofselected
companies in industry. The study concludes that all three companies support the hypothesis that there
is relation between debt-equity and MPS.
• Devani (2010) concluded that the studyon relationship between dividend per share, earnings per share,
price earnings, dividend yield and dividend cover with equity share prices leads to a concept that all
the selected explanatory variable has a significant impact on the equity share prices except growth
variable.
• Daniel A Moses Joshunar (2013) conducted a study to identify the financial strength and weakness of
the JSW STEEL LTD. Using past 5-year financial statements. Trend analysis & ratio analysis used
to comment of financial status of company. Financial performance of company is satisfactory and
also suggested to increase the loan levels of company for the better performance.
• Zafar S.M. Tariq & Khalid S.M (2012) conducted a study and explored that ratio are calculated from
financial statements which are prepared as desired policies adoptedon depreciation and stock valuation
by the management. Ratio is a simple comparison of numerator and a denominator that cannot produce
complete and authentic picture of business. Results are manipulated and also may not highlight other
factors which affect performance of firm by promoters.
• Huda Salhe Meften & Manish Roy Tirkey (2014) have studied the financial analysis of Hindustan
petroleum corporation Ltd. The study is based on secondary data. The company has got excellent gross
profit ratio and trend is rising in with is appreciable indicating efficiency in production cost. The net
profit for the year 2010-11 is excellent & it is 8 times past year indicating reduction in operating
reduction in operating expenses and large proportion of net sales available to the shareholders of
company.
• Surekha B. & Krishnaiah K. Rama (2015) undertook a study to reveal the prosperity of The three
companies Company. It can be concluded that inner strength of company is remarkable. Company
can further improve its profitability by optimum capital gearing, reduction in administration and
38
financialexpenses for the growth of company.
• Agarwal, Nidhi (2015) conducted a study focusing on the comparative financial performance of Maruti
Suzuki and JSW STEEL LTD. The financial data and information required for the study are drawn
fromthe various annual reports of companies. The liquidity and leverage analysis of both the firms are
done. To analyses the leverage position four ratios are considered namely, capital gearing, debt-
equity, totaldebt and proprietary ratio. The result shows that JSW STEEL LTD has to increase the
portion of proprietor’s fund in business to improve long term solvency position.
• Kaur Harpreet (2016) tried to examine the qualities & quantities performer of Maruti Suzuki co. &
how had both impact on its market share in India, for this study secondary data has been collectedfrom
annual reports, journals, report automobile sites. Result shows that MSL has been successfully
leading automobile sector in India for last few years.
CHAPTER 4
RESEARCH
METHODOLOGY
RESEARCH METHODLOGY:
Research means “know about new things”. Sometimes, it may refer to scientific and systematic
search pertinent information on specific topic. In fact, research is an art of scientific
investigation. According to Clifford Woody research comprises of. “Define and redefining
problem, formulating hypothesis or suggested solution, collecting, organizing and evaluating
data; making deduction and reaching conclusion; and at last, carefully testing the conclusion
to determine whether they fit the formulating hypothesis”. Redman and Moray define research
as a “systematic effort to gain new knowledge”. Research can be defined as the search of
knowledge or any systematic investigation to establish fact.
OBJECTIVES OF STUDY:
The broad objectives of the study are to analysis the liquidity position of companies in India.
The objectives are as under:
 To do a comparative analysis of Gross Profit Ratio in the selected companies.
 To do a comparative analysis of Net Profit Ratio in the selected companies.
 To do a comparative analysis of Operating Cost Ratio in the selected companies.
 To do a comparative analysis of Operating Profit Ratio in the selected companies.
SCOPE OF STUDY:
The scope of my study will be confined to:
1. Financial Report of the Company for past few years.
2. Records compiled and held with company.
3. The market share of the three selected companies.
RESEARCH DESIGN:
This chapter covers Problem Identification, Survey of Existing Literature- Statement of
Problem, Objectives of the study-Hypothesis, Universe of Study, Sampling Design, Period of
Study- Data collection and data analysis, Tools and techniques for analysis of profitability
and Limitations of the study.
39
TYPES OF RESEARCH DESIGN:
 Exploratory Design
 Descriptive Design
I used descriptive research design in my research study.
Descriptive research design is a type of research design that aims to obtain information to
systematically describe a phenomenon, situation, or population. More specifically, it helps
answer the what, when, where, and how questions regarding the research problem, rather than
the why.
The descriptive method of research can involve the use of many different kinds of research
methods to investigate the variables in question. It predominantly employs quantitative data,
although qualitative data is also used sometimes for descriptive purposes.
It is important to note that in the descriptive method of research, unlike in experimental
research, the researcher does not control or manipulate any variables. Instead, the variables
are only identified, observed, and measured.
METHOD OF DATA COLLECTION
The data can be selected in
SECONDARY SOURCE OF DATA COLLECTION:
Despite all efforts no earlier study on the subject matter could be obtained from research
and was informed that they have never put these aspects in writing, although such things were
for bankers andother institution according to their requirement
I was able to study considerable amount of already published material (i.e., books, magazines,
annualreport of other companies etc.) on the subject and this served as useful input in conduct
40
41
of my project.
Information gained during the exploratory research while doing interaction management
were alsovaluable inputs.
The secondary data is collected by the detailed study & critical analysis of the various
records of thecompany.
DATA ANALYSIS
In this study data is analysis by various graphs and tables. Data Analysis:Data analysis is a
process of inspecting, cleansing, transforming, and modeling data with the goal of discovering
useful information, informing conclusions, and supporting decision-making. Data analysishas
multiple facets and approaches, encompassing diverse techniques under a variety of names,
and isused in different business, science, and social science domains. In today’s business world,
data analysisplays a role in making decisions more scientific and helping businesses operate
more effectively. Although many groups, organizations, and experts have different ways to
approach data analysis, most of them can be distilled into a one-size-fits-all definition. Data
analysis is the process of cleaning, changing, and processing raw data, and extracting
actionable, relevant information that helps businesses make informed decisions. The
procedure helps reduce the risks inherent in decision makingby providing useful insights and
statistics, often presented in charts, images, tables, and graphs
LIMITATIONS OF STUDY:
 Time: The time duration could not provide ample opportunity to study every detail of working
capital management of the company. The study cover 45 days. 68
 Economical Condition: The financial statements generally based on historical or original cost.
The current economical condition is ignored.
 Confidential Information: As the company on account of confidential report has not disclosed
some figures. Moreover, in some cases separate accounts of division are not separately
maintained thereby, leading to restrictions in study.
 Financial Matter: Since the financial matter are sensitive in nature the same could not
acquired easily.
 Data Availability: Data availability is very rare & the company is not ready to provide full
42
facts and figures about their organization that is under study. My study is confined to the topic
of financial management on profitability analysis of the three companies limited. In this study,
I cover various areas of profitability like gross profit, net profit, profit before tax, profit after
tax, profitability ratio, etc.
CHAPTER 5
DATA ANALYSIS
AND
INTERPRETATION
43
GROSS PROFIT RATIO
98.5
98
97.5
97 GROSS PROFIT RATIO
96.5
96
JSW STEEL LTD TATA STEEL LTD JINDAL STEEL AND
POWER LTD
Profitability Ratio
Gross profit ratio = (gross profit/revenue from operation) *100
Showing gross profit ratio
COMPANIE
S
GROSS PROFIT RATIO
JSW STEEL
LTD
(116928/120749) *100 = 96.83%
TATA
STEEL LTD
(127681//130473) *100 = 97.86%
JINDAL
STELL AND
POWER LTD
(102829/104515) *100 = 98.38%
The following table shows gross profit ratio. There is no norm to interpret gross profit ratio.
Generally,ahigher ratio is considered better. Here the company has highest ratio for the last
five years. So, the grossprofit ratio is satisfied. Showing gross profit ratio:
44
Net profit ratio = (net profit after tax/revenue from operation) *100
Showing net profit ratio
COMPANIE
S
NET PROFIT RATIO
JSW STEEL
LTD
(116928/120749) *100 = 96.83%
TATA
STEEL LTD
(127681/130473) *100 = 97.86%
JINDAL
STELL AND
POWER LTD
(102829/104515) *100 = 98.38%
The following table shows net profit ratio. Generally, the ideal net profit ratio is 10%.
The company has failed to attain the standard ratio, which means the company is
underpricing. Also shows lower profitability and lower return to the shareholders of the
company. Net profit ratio for the past five yearsshows negative value because of net loss
for the mentioned period except 2018-2019.
Showing net profit ratio
NET PROFIT RATIO
98.5
98
97.5
NET PROFIT RATIO
97
96.5
96
JSW STEEL LTD TATA STEEL LTD JINDAL STEEL AND
POWER
45
OPERATING COST RATIO
45
40
35
30
25
20
15
10
5
0
OPERATING COST RATIO
JSW STEEL LTD TAT STEEL LTD JINDAL STEEL
AND POWER LTD
Operating cost ratio = (operating cost/revenue from operation) *100
Showing operating cost ratio
COMPANIES OPERATING COST RATIO
JSW STEEL
LTD
(30168/120749) *100 = 24.98%
TATA
STEEL LTD
(35256/130473) *100 = 27.02%
JINDAL
STELL AND
POWER LTD
(42776/104515) *100 = 40.92%
The following table shows operating cost ratio. The ideal ratio of operating cost ratio
is 60% to 80%. Although, the lower it is, the better. Here, the company has lower
ratio, which indicates that the expenses are decreasing. This is a positive sign for the
company.
46
OPERATING PROFIT RATIO
99
98.8
98.6
98.4
98.2
98
97.8
97.6
97.4
97.2
OPERATING PROFIT RATIO
JSW STEEL LTD TATA STEEL LTD JINDAL STEEL
AND POWER
LTD
Operating profit ratio = (operating profit/revenue from
operation) *100 Operating profit = Net profit before taxes + non-
operating expenses – non-operating incomes
Showing operating profit ratio
COMPANIE
S
OPERATING PROFIT RATIO
JSW STEEL
LTD
(118820/120749) *100 = 98.4%
TATA
STEEL LTD
(127681/130473) *100 = 97.83%
JINDAL
STELL AND
POWER LTD
(103473/104515) *100 = 99%
The following table shows operating profit ratio. An operating profit ratio higher than
15% is considered good. The company has higher ratio for the past five years. So it
indicates that the companyis earning enough money from business operations to pay
for all of the associated costs
47
PROFIT AFTER TAX
35000
30000
25000
20000
PROFIT AFTER TAX
15000
10000
5000
0
JSE STEEL LTD TATA STEEL LTD JINDAL STEEL LTD
PROFIT AFTER TAX
COMPANIES Profit after Tax
JSW STEEL LTD 16702
TATA STEEL LTD 33011
JINDAL STEEL AND POWER
LTD
8283
The profit after tax of the three companies is shown in the graph below.
48
PROFIT BEFORE TAX
50000
45000
40000
35000
30000
25000
PROFIT BEFORE TAX
20000
15000
10000
5000
0
JSW STEEL LTD TATA STEEL LTD JINDAL STEELAND
POWER LTD
PROFIT BEFORE TAX
COMPANIES PROFIT BEFORE TAX
JSW STEEL LTD 24715
TATA STEEL LTD 44090
JINDAL STEEL AND POWER LTD 11168
CHAPTER 6
CONCLUSION
AND
SUGGESTIONS
Conclusion:
The study highlights, the financial performance of JINDAL STELL AND POWER LTD is the most
satisfactory. To conclude, JINDAL STELL AND POWER company has shown its power in the
industry despite being a public sector undertaking.
 JINDAL STELL AND POWER has the best gross profit ratio with TATA steel ltd. Nearly
behind it , but JSW steel l=td lacking far behind.
 Net profit ratio of JSW steel ltd is the lowest with TATA steel and JINDAL STELL AND
POWER ltd being just above it.
 We got to know that JSW steel steel limited has the highest export in the iron and steel
industry and leads the export market of india.
 Operating cost ratio of JSW steel ltd and TATA steel ltd is almost similar but the ratio of
JINDAL STELL AND POWER ltd. Is far head of them both.
 Operating profit ratio of TATA steel being the lowest and JSW steel ltd being far ahead TATA
steel in this ratio.
50
Suggestions:
 TATA steel has to improve its short-term financial position by increasing its working capital.
 JSW has to increase its short term financial conditions in order to finance even short-term
liabilities.
 Jsw steel is dependent on is creditors for working capital, which may lead to increased liabilities.
 TATA steel ltd share capital is constant for the past five years. They have to improve its share
capital by improving the net earnings.
 JINDAL STELL AND POWER LTD pay huge amounts of dividend in order to satisfy the need of
revenue of the government and so a diminished revenue is available for research and development
so JINDAL STELL AND POWER needs to think of that.
 JSW steel has utilized the dividend. This may create a bad impact on the investors. So, it is very
important to increase its sales revenue.
CHAPTER 7
BIBILOGRAPHY
51
Reference books:
• Brigham, E. and Houston, J., n.d. Fundamentals of financial management.
• Higgins, R., Koski, J. and Mitton, T., 2019. Analysis for financial management. New York, NY:
McGraw-Hill Education.
• Khan, M. and Jain, P., 2014. Financial management. New Delhi: McGraw Hill Education.
• Palmer, J., 1983. Financial ratio analysis. New York, N.Y.: American Institute of Certified Public
Accountants.
Journals:
• Dundas, J., 2009. Understanding Code Patterns – Analysis, Interpretation & Measurement.
International Journal of Computer and Electrical Engineering, pp.46-55.
Websites:
• En.wikipedia.org. 2021. Steel industry - Wikipedia. [online] Available at:
<https://en.wikipedia.org/wiki/Automotive_industry> [Accessed 28 March 2021].
• Tatasteel.com. 2021. Largest steel Manufacturer, Biggest Automobile Company in India.[online]
Available at: <https://www.tatamotors.com/> [Accessed 22 March 2021].
• Investopedia. 2021. Reading Financial Performance. [online] Available
at:<https://www.investopedia.com/terms/f/financialperformance.asp#:~:
text=Financial%20performance%20is%20a%20subjective,health%20ov
er%20a%20given%20period.> [Accessed 23 March 2021].
• En.wikipedia.org. 2021. Tata steel - Wikipedia. [online] Available at:
<https://en.wikipedia.org/wiki/Tata_steel> [Accessed 28 March 2021].
• Moneycontrol.com. 2021. The three companies Balance Sheet, The three companies Financial
Statement & Accounts.[online] Available at:
<https://www.moneycontrol.com/financials/tatamotors/balance- sheet VI/TM03> [Accessed 22
Msheet VI21].
ANNEXURE
BALANCE SHEET OF JSW STEEL :
Total Current Assets 186,042,134
Cash and Short Term Investments 101,946,477
Cash
Cash & Equivalents 26,604,994
Short Term Investments 75,341,483
Total Receivables, Net 43,878,105
Accounts Receivables - Trade, Net 40,367,204
Total Inventory 30,908,762
Prepaid Expenses 6,510,301
Other Current Assets, Total 2,798,489
Total Assets 353,385,985
Property/Plant/Equipment, Total - Net 116,855,571
Property/Plant/Equipment, Total - Gross
Accumulated Depreciation, Total
Goodwill, Net
Intangibles, Net 15,705,674
Long Term Investments 17,362,503
Note Receivable - Long Term
Other Long Term Assets, Total 17,420,103
54
Other Assets, Total
Total Current Liabilities 63,303,192
Accounts Payable 11,422,269
Payable/Accrued
Accrued Expenses 17,179,210
Notes Payable/Short Term Debt 12,330,248
Current Port. of LT Debt/Capital Leases 792,467
Other Current liabilities, Total 21,578,998
Total Liabilities 97,982,535
Total Long Term Debt 3,010,623
Long Term Debt 1,008,058
Capital Lease Obligations 2,002,565
Deferred Income Tax 17,185,000
Minority Interest 8,038,794
Other Liabilities, Total 6,444,926
Total Equity 255,403,450
Redeemable Preferred Stock, Total
Preferred Stock - Non Redeemable, Net
Common Stock, Total 897,514
Additional Paid-In Capital 4,403,893
Retained Earnings (Accumulated Deficit) 251,761,348
55
Treasury Stock - Common
ESOP Debt Guarantee
Unrealized Gain (Loss) 2,396,720
Other Equity, Total -4,056,025
Total Liabilities & Shareholders' Equity 353,385,985
Total Common Shares Outstanding 6,792.67
Total Preferred Shares Outstanding
56
BALANCE SHEET OF TATA STEEL :
Total Current Assets 203,634,913
Cash and Short Term Investments 118,540,312
Cash
Cash & Equivalents 26,566,097
Short Term Investments 91,974,215
Total Receivables, Net 43,980,097
Accounts Receivables - Trade, Net 40,379,873
Total Inventory 32,442,857
Prepaid Expenses 4,313,851
Other Current Assets, Total 4,357,796
Total Assets 375,788,742
Property/Plant/Equipment, Total – Net 124,777,408
Property/Plant/Equipment, Total - Gross
Accumulated Depreciation, Total
Goodwill, Net
Intangibles, Net 18,980,799
Long Term Investments 20,026,174
Note Receivable - Long Term
Other Long Term Assets, Total 8,369,448
57
Other Assets, Total
Total Current Liabilities 73,046,405
Accounts Payable 11,688,180
Payable/Accrued
Accrued Expenses 21,703,839
Notes Payable/Short Term Debt 15,856,252
Current Port. of LT Debt/Capital Leases 754,610
Other Current liabilities, Total 23,043,524
Total Liabilities 107,846,602
Total Long Term Debt 3,015,611
Long Term Debt 997,764
Capital Lease Obligations 2,017,847
Deferred Income Tax 18,362,110
Minority Interest 8,194,048
Other Liabilities, Total 5,228,428
Total Equity 267,942,140
Redeemable Preferred Stock, Total
Preferred Stock - Non Redeemable, Net
Common Stock, Total 897,514
Additional Paid-In Capital 4,403,893
Retained Earnings (Accumulated Deficit) 267,024,912
Treasury Stock - Common
ESOP Debt Guarantee
Unrealized Gain (Loss) 3,656,025
Other Equity, Total -8,040,204
Total Liabilities & Shareholders' Equity 375,788,742
Total Common Shares Outstanding 6,792.67
Total Preferred Shares Outstanding
57
58
BALANCE SHEET OF JINDAL STELL AND POWER LTD :
Total Current Assets 212,793,019
Cash and Short Term Investments 120,240,975
Cash
Cash & Equivalents 32,675,040
Short Term Investments 87,565,935
Total Receivables, Net 47,100,626
Accounts Receivables - Trade, Net 42,369,691
Total Inventory 37,801,695
Prepaid Expenses 2,916,308
Other Current Assets, Total 4,733,415
Total Assets 410,420,718
Property/Plant/Equipment, Total - Net 143,029,384
Property/Plant/Equipment, Total - Gross
Accumulated Depreciation, Total
Goodwill, Net
Intangibles, Net 20,753,637
Long Term Investments 23,177,896
Note Receivable - Long Term
Other Long Term Assets, Total 10,666,782
59
Other Assets, Total
Total Current Liabilities 81,871,964
Accounts Payable 13,865,671
Payable/Accrued
Accrued Expenses 25,182,366
Notes Payable/Short Term Debt 15,117,140
Current Port. of LT Debt/Capital Leases 1,271,589
Other Current liabilities, Total 26,435,198
Total Liabilities 122,089,510
Total Long Term Debt 2,680,837
Long Term Debt 514,096
Capital Lease Obligations 2,166,741
Deferred Income Tax 22,487,982
Minority Interest 8,434,910
Other Liabilities, Total 6,613,817
Total Equity 288,331,208
Redeemable Preferred Stock, Total
Preferred Stock - Non Redeemable, Net
Common Stock, Total 897,514
Additional Paid-In Capital 4,403,893
Retained Earnings (Accumulated Deficit) 284,826,992
60
Treasury Stock - Common
ESOP Debt Guarantee
Unrealized Gain (Loss) 4,151,967
Other Equity, Total -5,949,158
Total Liabilities & Shareholders' Equity 410,420,718
Total Common Shares Outstanding 6,792.67
Total Preferred Shares Outstanding

steel industry project.docx

  • 1.
  • 2.
    1 What is Profitability Profitabilityrefers to the profits or gains a business makes in relation to its expenses. Therefore, profitability analysis refers to the process of calculating or analyzing the profits of a business. It helps businesses identify their revenue streams and where they can reduce their expenses to generate maximum gains. Profitability analysis is an integral component of Enterprise Resource Planning (ERP), which is used to automate and integrate daily business operations. As a part of ERP, profitability analysis helps examine gains generated from different business segments like customers, products, or services. It thus offers quantitative as well as qualitative insights, and helps stakeholders evaluate the elements that generate profit for the business Profitability analysis is part of enterprise resource planning (ERP) and helps business leaders to identify ways to optimize profitability as it relates to various projects, plans, or products. It is the process of systematically analyzing profits derived from the various revenue streams of the business. Sometimes profitability analysis is incorrectly assumed to exclusively rely on profitability ratios. In fact, profitability analysis relies on both qualitative and quantitative analytics to help leaders get the full picture. While profitability analysis does answer many quantitative questions, it is unique in that it can also help business leaders identify which sources of information are most factual and reliable. This is especially helpful in helping to select new enterprise resource planning solutions as the need for factual and reliable data is paramount. ERP systems combine information from a variety of business processes and enable the flow of information between them. Advancements in ERP solutions have created access to more transparent and helpful information than in the past. This transactional information can be used to help perform holistic profitability analysis which often includes a deep look into which customers, vendors, and geographical locations are most profitable. Why Is Profitability Analysis Important? Understanding the quality of a business’s earnings is important for many reasons. In order to maximize profits, business leaders first need to understand the drivers behind their profits. This helps to create efficiencies in the processes and activities that generate revenue.
  • 3.
    2 Consequently, it forcesleaders to continually find ways to reduce overhead and other costs that impact profitability. The analysis helps to identify ways to enhance product mixes to maximize profits both in the near and short term. This makes it helpful for budgeting purposes as leaders work to create reasonable goals and map how they will achieve them. The ability to identify both short- and long-term product mixes also helps management to determine what modifications, if any, need to be made to the business. This results in the ability to anticipate sales and provides insights into customer demographics, geographic considerations, and product types that can be used to assess profit potential. One helpful piece of information created when analyzing various products is which products are the most and least profitable. This information is sometimes taken into consideration when business leaders choose to eliminate certain products. Finally, profitability analysis examines the various relationships with customers and vendors. This helps to identify which customers are the most and least profitable and which vendors have the biggest impact on profitability. This can be especially helpful in navigating relationships with customers and vendors. Common Methods Of Performing Profitability Analysis There are many ways to carry out analysis on profitability. Some industries have considerations that are specific and unique to the businesses that operate within them. While each business ultimately goes about it differently, here are three common methods of profitability analysis. Profitability Ratios Profitability ratios are financial metrics that are used to garner information on how well the business can generate revenue relative to its cost, assets, and equity over time. Some of the more common profitability ratios are operating profit margin, return on assets (ROA), and return on equity (ROE).
  • 4.
    3 Customer Profitability Analysis Agreat deal of attention is given to the data created as a result of transactions. The data provides unique insight into customers’ behaviors. As a result, transaction analysis can help to identify which customers result in the most profit, and which customers result in the least. It also helps to identify which products and product mixes are most commonly ordered. The most common approach is to calculate profit margin for each customer. However, profit per customer share is sometimes relied on as well. This helps to show the percentage of profit each customer is responsible for creating. Qualitative Analytics It is important for leaders to continually assess the various market conditions and relevant customer behavior patterns. This helps to identify trends and business cycles and allows leaders to plan appropriately. Types of Profitability Analysis Profitability ratios are divided into two broad categories. The first is margin ratios that help analyze how much profit a business is making or can make through its sales. The second is revenue ratios that indicate how the extent of returns a company can provide its shareholders. These two ratios are further categorized into the following types: Margin Ratios Gross Profit Margin Gross profit margin is the total profit of a business after deducting operational or inventory costs. It represents gross profit of the company in comparison to sales revenue. Gross profit margin is calculated to analyze how much profit a business is making after spending on
  • 5.
    4 production of goodsor services. If a business has a higher gross profit margin, it means that it can easily cover its operating and other expenses, and still provide a significant amount of net profit. Low gross profit margin indicates that the cost of production is high, and profits earned are low. Operating Profit Margin or EBIT Margin This represents how much profit a business has made after deducting variable costs like wages or the cost of raw material. This profit is calculated before deducting taxes or interest. It helps determine whether a company is capable of managing its fixed costs and can run its operations smoothly. Net Profit Margin This ratio represents the actual financial position of a company after the taxes and interests have been paid. It indicates a company’s net income or revenue after tax and interest liabilities are paid off. This net profit is utilized to pay dividends to the shareholders. A higher net profit margin indicates that a business is able to keep its expenses low and is making high profits. Cash Flow Margin It helps calculate the ability of a business to convert its sales into cash flow. Simply put, cash flow margin represents how much cash or income is a business able to generate from its operating activities. A higher cash flow margin indicates that a company is well-equipped to pay its vendors or suppliers, and purchase capital assets. Revenue Ratios Return on Assets Return on assets means the profit a company generates from its total assets. It compares the profits or net income generated from the assets to the capital invested by the company. Return on assets ratio indicates how well a company is utilizing its economic resources.
  • 6.
    5 Return on Equity Returnon equity indicates how much return a company is able to provide to its equity shareholders. It indicates the efficiency with which a company is managing the capital invested by the shareholders, and how much value it is able to create from it. Importance of Profitability Analysis Profitability analysis helps businesses determine future strategies, investments, and the performance of the business by analyzing the current financial position. Here is how businesses leverage profitability analysis to make key decisions:  Gross profit margin helps businesses determine whether they are making enough profit from their sales. If the gross profit margin is less, the business needs to do cost-cutting  Profitability analysis also helps potential investors know the financial position of a business and make investment decisions  Profitability analysis enables businesses to determine the return or profit percentage that they need to pay their shareholders Profitability Analysis Formula Profitability analysis is measured in the form of ratios or a percentage. Here are the formulas for different profitability analysis methods: Gross Profit Margin Gross Profit Margin = Gross Profit/Sales Here, you need to first calculate gross profit by subtracting the Cost of Goods Sold (COGS) from the selling price.
  • 7.
    6 Operating Profit Margin OperatingProfit Margin = Earnings Before Interest and Taxes (EBIT)/Sales You can calculate EBIT by subtracting gross profit from operating expenses. Another way to calculate EBIT is to add taxes and interest to the net income. Net Profit Margin Net Profit Margin = Net Income/Sales You will have to first calculate the net income of the business by subtracting COGS from gross income, and further deduct other expenses like interest and taxes. Cash Flow Margin Cash Flow Margin = Cash Flow from Operating Activities/Net Sales The cash flow from operating activities is calculated by adding net income, non-cash expenses and changes in working capital. You can calculate net sales of the company by reducing sales returns, allowances and discounts from gross sales amount. Return on Assets The Return on Assets = Net Income/Total Assets You can calculate total assets of the company by adding shareholder’s equity amount and the company’s debt. Return on Equity The Return on Equity = Net Income/Shareholder’s Equity Shareholder’s equity can be calculated by reducing the debt amount from the company’s total assets.
  • 8.
    7 Cash Return onAssets Cash Return on Assets = Cash Flow from Operating Activities/Total Assets Profitability Analysis Techniques Break-Even Analysis Break-even point in business is the amount at which your total expenditure is equal to your total revenue. This means that the net profit or net gain is zero. Moreoevr, break-even analysis is one of the best strategies for profitability analysis as it helps you understand the minimum revenue you need to generate in order to sustain your business. Benchmarking Industry Profitability Ratios You can analyze business profitability by researching the standard profitability ratio of businesses in your industry. Thus, to set that as a benchmark so that you know whether you will be able to compete in the market. Howto Perform Profitability Analysis Now that you know what is profitability analysis, let’s understand the steps to be taken to calculate the financial performance of your business: Step 1: Gather Data The first step in calculating profitability analysis is gathering the financial data of your business. First, collect all financial statements so that you have accurate details of business revenue and expenditures. Step 2: CalculateBreak-Even Analysis Then, the next step is to calculate the break-even analysis (as mentioned above), especially when you are planning to invest in a new idea or business.
  • 9.
    8 Break-even cost canbe calculated by using this formula: Break-even cost = fixed costs/contribution margin ratio Contribution margin ratio = unit price – variable cost per unit/unit price Step 3: UseMargin orRevenueRatios You can use different margin ratio or revenue ratio formulas to calculate the profitability of the business. An Exampleof Profitability Analysis Take a steel manufacturing company that has been facing decreased profits over the last three years. However, the company has made significant profits in the past six months, and it has received an invitation to bid for a project. The management of the company has to figure out whether the company is in a position to take on a new project, and whether the profits generated through this project will be sufficient to sustain the business. In fact, the company will have to calculate the break-even point (explained later in the article) and use profitability ratios to determine whether it can take on a new project. Maximizing profits is one of the fundamental rules of running a business. Whether you are a finance professional or a business leader, you must know what is profitability analysis and how to calculate it. Emeritus offers several online finance courses to help you learn profitability analysis and other advanced financial concepts. Do check them out and upskill to boost your career.
  • 10.
  • 11.
    9 INDUSTRY PROFILE: One ofthe primary forces behind industrialization has been the use of metals. Steel has traditionally occupied a top spot among metals. Steel production and consumption are frequently seen as measures of a country's economic development because it is both a raw material and an intermediary product. Therefore, it would not be an exaggeration to argue that the steel sector has always been at the forefront of industrial progress and that it is the foundation of any economy. The Indian steel industry is classified into three categories - major producers, main producers and secondary producers. The industry in India is classified based on the nature of the manufacturing companies into Integrated Steel Producers (ISP) and Secondary Producers. Integrated Steel Producers are companies that are present throughout the steel value chain - starting from the extraction of Iron Ore to the manufacturing and marketing of finished steel. The Integrated Steel Producers account for around 55.0 % of finished steel production in India. The integrated steel players in India include Steel Authority of India, Rashtriya Ispat Nigam Limited (Vizag Steel), Tata Steel, JSPL, JSW Steel and Essar Steel. The Mini Steel Plant/ Processing Units in the iron and steel industry which accounts for about 45 % total finished steel production, is composed of production units which are a diverse lot with widely varying product range, technology and scale of operation and include major product/industry segments such as pig iron produced by mini blast furnaces (MBFs), sponge iron, steel produced in electric arc (EAFs) or Induction Furnaces (IFs), 4 standalone cold rolled steel sheets and coils producers, re-rollers producing hot rolled long products such as rebars, wire rods and structurals, standalone GP/GC and color coated steel sheets/coil producers, wire drawing units, standalone tinplate producers etc. The units covered under the Secondary Sector produce either a product that serves a basic raw material to steel making such as pig iron or sponge iron or they use a semi finished or intermediate steel product to convert the same to another product of higher value. The sector also includes crude steel (semi finished products such as ingots, billets and blooms) produced using electric arc or induction furnaces using scrap or DRI in capacities less than one million tonne a year. These units are generally small in size compared to the integrated steel As of April 2022, India was the world's second-largest producer of crude steel, with an output of 10.14 MT. In FY22, the production of crude steel and finished steel stood at 133.596 MT and 120.01 MT, respectively. In April-Oct 2022, the production of crude steel and finished steel stood at 71.56 MT and 68.17 MT respectively. The growth in the Indian steel sector has
  • 12.
    10 been driven bythe domestic availability of raw materials such as iron ore and cost-effective labour. Consequently, the steel sector has been a major contributor to India's manufacturing output. The Indian steel industry is modern, with state-of-the-art steel mills. It has always strived for continuous modernisation of older plants and up-gradation to higher energy efficiency levels. MARKET SIZE In the past 10–12 years, India's steel sector has expanded significantly. Production has increased by 75% since 2008, while domestic steel demand has increased by almost 80%. The capacity for producing steel has grown concurrently, and the rise has been largely organic. In FY22, the production of crude steel and finished steel stood at 133.596 MT and 120.01 MT, respectively. The consumption of finished steel stood at 105.751 MT in FY22. In April 2022, India's finished steel consumption stood at 9.072 MT. In April-July 2022, the production of crude steel and finished steel stood at 40.95 MT and 38.55 MT respectively. In FY22, exports and imports of finished steel stood at 13.49 MT and 4.67 MT, respectively. In FY22, India's export rose by 25.1% YoY, compared with 2021. In FY21, India exported 9.49 MT of finished steel. In July 2022 exports of finished steel stood at 3.80 lakh MT. The annual production of steel is anticipated to exceed 300 million tonnes by 2030–2031. By 2030–31, crude steel production is projected to reach 255 million tonnes at 85% capacity utilisation achieving 230 million tonnes of finished steel production, assuming a 10% yield
  • 13.
    11 loss or a90% conversion ratio for the conversion of raw steel to finished steel. With net exports of 24 million tonnes, consumption is expected to reach 206 million tonnes by the years 2030–1931. As a result, it is anticipated that per-person steel consumption will grow to 160 kg. INVESTMENTS The steel industry and its associated mining and metallurgy sectors have seen major investments and developments in the recent past. According to the data released by the Department for Promotion of Industry and Internal Trade (DPIIT), between April 2000-September 2022, Indian metallurgical industries attracted FDI inflows of US$ 17.09 billion. In FY22, demand for steel is expected to increase by 17% to 110 million tonnes, driven by rising construction activities. Some of the major investments in the Indian steel industry are as follows:  In September 2022, Steel Authority of India Limited (JINDAL STELL AND POWER), a Maharatna PSU, supplied 30,000 tonnes of the entire DMR grade specialty steel for the nation’s first indigenously built Aircraft Carrier INS Vikrant.
  • 14.
    12  In August2022, Tata Steel signed an MoU with Punjab Government to set up a steel scrap based electric arc furnace steel plant.  In May 2022, Tata Steel announced a CAPEX of Rs. 12,000 crores (US$ 1.50 billion).  In October 2021, Tata Steel was planning to set up more scrap-based facilities that will have a capacity of at least a billion tonnes by 2025.  In October 2021, JSW Steel invested Rs. 150 billion (US$ 19.9 million) to build a steel plant in Jammu and Kashmir and boost manufacturing in the region.  In October 2021, ArcelorMittal and Nippon Steel Corp.'s joint venture steel firm in India, announced a plan to expand its operations in the country by investing ~Rs. 1 trillion (US$ 13.34 billion) over 10 years.  In August 2021, Tata Steel announced to invest Rs. 8,000 crore (US$ 1.08 billion) in capital expenditure to develop operations in India in FY22.  In August 2021, ArcelorMittal announced to invest Rs. 1 lakh crore (US$ 13.48 billion) in Gujarat for capacity expansion.  In August 2021, Tata Steel announced to invest Rs. 3,000 crore (US$ 404.46 million) in Jharkhand to expand capacities over the next three years.  In August 2021, Jindal Steel & Power Ltd. announced plans to invest US$ 2.4 billion to increase capacity over the next six years to meet the rising demand from customers.  In the next three years from June 2021, JSW Steel is planning to invest Rs. 47,457 crore (US$ 6.36 billion) to increase Vijayanagar's steel plant capacity by 5 MTPA and establish a mining infrastructure in Odisha.
  • 15.
    13 GOVERNMENT INITIATIVES Some ofthe other recent Government initiatives in this sector are as follows:  In October 2021, the government announced guidelines for the approved specialty steel production-linked incentive (PLI) scheme.  In October 2021, India and Russia signed an MoU to carry out R&D in the steel sector and produce coking coal (used in steel making).  In July 2021, the Union Cabinet approved the production-linked incentive (PLI) scheme for specialty steel. The scheme is expected to attract investment worth ~Rs. 400 billion (US$ 5.37 billion) and expand specialty steel capacity by 25 million tonnes (MT), to 42 MT in FY27, from 18 MT in FY21.  In June 2021, Minister of Steel & Petroleum & Natural Gas, Mr. Dharmendra Pradhan addressed the webinar on 'Making Eastern India a manufacturing hub with respect to metallurgical industries', organised by the Indian Institute of Metals. In 2020, 'Mission Purvodaya' was launched to accelerate the development of the eastern states of India (Odisha, Jharkhand, Chhattisgarh, West Bengal and the northern part of Andhra Pradesh) through the establishment of an integrated steel hub in Kolkata, West Bengal. Eastern India has the potential to add >75% of the country's incremental steel capacity. It is expected that of the 300 MT capacity by 2030-31, >200 MT can come from this region alone.  In June 2021, JSW Steel, CSIR-National Chemical Lab (NCL), Scottish Development International (SDI) and India H2 Alliance (IH2A) joined forces to commercialise hydrogen in the steel and cement sectors.  Under the Union Budget 2022-23, the government allocated Rs. 47 crore (US$ 6.2 million) to the Ministry of Steel. The budget's focus is on creating infrastructure and manufacturing to propel the economy.  In addition, enhanced outlays for key sectors such as defence services, railways, roads, transport and highways would provide impetus to steel consumption.
  • 16.
    14  In January2021, the Ministry of Steel, Government of India, signed a Memorandum of Cooperation (MoC) with the Ministry of Economy, Trade and Industry, Government of Japan, to boost the steel sector through joint activities under the framework of India–Japan Steel Dialogue.  The Union Cabinet, Government of India approved the National Steel Policy (NSP) 2017, as it intends to create a globally competitive steel industry in India. NSP 2017 envisage 300 million tonnes (MT) steel-making capacity and 160 kgs per capita steel consumption by 2030-31.  The Ministry of Steel is facilitating the setting up of an industry driven Steel Research and Technology Mission of India (SRTMI) in association with the public and private sector steel companies to spearhead research and development activities in the iron and steel industry at an initial corpus of Rs. 200 crore (US$ 30 million).  The Government of India raised import duty on most steel items twice, each time by 2.5% and imposed measures including anti-dumping and safeguard duties on iron and steel items. Global Scenario In Jan-May 2019, the world crude steel production reached 764.072 million tonnes (mt) and showed a growth of 5.03% over Jan-May 2018. China remained world’s largest crude steel producer in same period (404.879 mt) followed by India (45.314 mt), Japan (42.294 mt) and the USA (37.169 mt). World Steel Association has projected Indian steel demand to grow by7.1% in 2019 while globally, steel demand has been projected to grow by 1.3% in 2019. Chinese steel use is projected to show 1.0% growth in 2019. Per capita finished steel consumption in 2018 was 224.5 kg for world and 590.1 kg for China (Source: World Steel Association). The same for India was 70.9 kg in 2018. Domestic Scenario The Indian steel industry has entered into a new development stage, post de-regulation, riding high on the resurgent economy and rising demand for steel. Rapid rise in production has resulted in India becoming the 2nd largest producer of crude steel during 2018, from its 3rd largest status in 2017. The country is also the largest producer of Sponge Iron or DRI in the world and the 3rd largest finished steel consumer in the world after China & USA. In 2018-19, production of total finished steel (alloy + non alloy) was 131.572 mt, a growth of 3.7% over last year
  • 17.
    15 National Steel Policy-2017 Withpassage of time and continued growth in the domestic steel industry, it was felt that the NSP 2005 needs to be in sync with changing times. 5 Accordingly, after a detailed review, the Government has released the National Steel Policy 2017, which has laid down the broad roadmap for encouraging long term growth for the Indian steel industry, both on demand and supply sides, by 2030- 31, with a vision to create a technologically advanced and globally competitive steel industry that promotes economic growth. The National Steel Policy aims at building a globally competitive industry with a crude steel capacity of 300 MT by 2030- 31from present level of 125 million tons per annum (MTPA and increase per Capita Steel Consumption to 160 Kgs. by 2030-31 amongst other objectives. The creation of additional capacity for fulfilling the anticipated demand will require significant capital investment of about Rs. 10 lakh Crore by 2030-31 and will also increase employment in the range of 6 36 Lakhs by 2030-31 from the current level of 25 Lakhs i.e. around 1 million additional work- forces through direct & indirect opportunities. Hence ensuring safety of the people going to be deployed in executing the new projects along with that of existing manpower would be a crucial factor amongst others in achieving the policy objectives and sustainable growth of industry as well. Occupational Safety & Working Conditions Management in India Iron and Steel Industry Under the Constitution of India, labour is a subject in the concurrent list (under 7 th schedule) where both the Central and the State Governments are competent to enact legislation subject to certain matters reserved for the Central Government. The Constitution of India provides detailed provisions for the rights of the citizens and also lays down the principles in the governance of the country called as “Directive Principles of State Policy”. These Directive Principles provide for securing the safety and health and strength of employees, men and women, that the tender age of children are not abused, that citizens are not forced by economic necessity to enter avocations unsuited to their age or strength (Article 39), just and humane conditions of work and maternity relief are provided (Article 42), that the Government shall take steps, by suitable legislation or in any other way, to secure the participation of employee in the management of enterprises, establishments or other
  • 18.
    16 organizations engaged inany industry (Article 43A), for ensuring that no child below the age of 14 is employed to work in any factory or mine or engaged in any other hazardous employment (Article 24). On the basis of Directive Principles as well as international instruments, the Government of India, Ministry of Labour & Employment, had declared the National Policy on Safety, Health and Environment at Workplace (NPSHEW) on 20th February, 2009. The purpose of this National Policy is to establish a preventive safety and health culture in the country through elimination of the incidents of work related injuries, diseases, fatalities, disasters and to enhance the well being of employees in all the sectors of economic activity in the country. Major Laws relating to Occupational Safety & Working Conditions Management There are four main legislations that cover Occupational Safety & Working Conditions Management at workplace. (i) The Factories Act, 1948 , covering factories wherein the enforcement of safety at workplace is by the Chief Inspector of Factories in the respective states, (ii) The Mines Act, 1952 and Mines Rules, 1955 for mining industry where the enforcement is by the Directorate General of Mines Safety (DGMS) under Ministry of Labour & Employment , Government of India, (iii) The Dock Workers (Safety, Health and Welfare) Act, 1986 followed by notification of the Dock Workers (Safety, Health and Welfare) Regulations, 1990 dealing with the major ports of India and the enforcement is by the Directorate General of Factory Advice Service & Labour Institutes (DGFASLI), under Ministry of Labour & Employment , Government of India. (iv) The Building & Other Construction Workers (Regulations of Employment and Conditions of Service) Act, 1996 , covering construction workers at construction sites wherein the enforcement is by the Directorate General Labour Welfare in the central sphere and by the Labour Commissioners/Factory Inspectorates in the States/UTs
  • 19.
    17 Status of Safetyin the Steel Industry Occupational Safety & Working Conditions is relatively neglected area by Indian industry and because of this while India has approximately 3% share of global manufacturing, India has almost 30% share of the industrial fatalities globally. Even Steel industry in India lags its global peers on this parameter and has patchy safety performance with many major incidents involving multiple fatalities. Most of the companies actually do not even have a proper safety management system comparable to global best practices. Though most of large ISPs are OHSAS- 18001 certified, never the less their contribution in workplace fatalities is not insignificant. Contractor workers which accounts for nearly half of the manpower deployed in steel industry are more susceptible to incidents as they are unskilled, not so educated and unaware of the hazardous work environment. However, in-spite of all efforts, their share in fatalities continues to be higher on year to year basis. Safety is still being managed in isolation and not as an essential / integral part of overall business decisions, culture & performance in most of the organizations. Efforts for benchmarking by taking lessons from past failures & good practices from peer industry are limited to few organizations only. Hazards in Steel Industry Hazards in Primary/ Integrated Steel Making Integrated Iron and Steel Industry inherently has many potential hazards which need to be mitigated properly. The Industry has been classified as hazardous process industry as per Chapter 1 Sec-2 (cb) of Factories Act 1948 (Amended in 1987). The hazards mainly emanate from extremely high temperature process involving liquid metal, generation of by-product gases which have toxic and explosive constituents, large amount of material handling/ transporting and manpower intensive multi-unit operations. The hazardous chemicals, electricity, steam, working at height, working in confined space etc. in addition to project activities add to the risks, especially when they are carried out besides the existing operating units. The various hazards along with the areas of their presence are enumerated in the table belowType of Hazard/Risk Major areas where Hazard is faced Toxic gases (rich in Carbon monoxide) All over the plant Explosive Gases (Rich in Hydrogen and Methane) All over the plant Harmful Chemicals Coal Chemicals plant, CRM Liquid metal/ slag (burn, Blast Furnace, SMS, Continuous casting, 9 explosions) Foundries Extreme Temperature (-180 OC
  • 20.
    18 to 1700 OC)Coke Ovens, Blast Furnace, SMS, Continuous casting, Foundries, Rolling Mills and Cryogenic Oxygen Plant Fire All over the plant Electric Shock, Electrocution, Flash over All over the plant and project sites Rail/ Road Traffic Movement All over the plant and project sites Moving/ Rotating machines (Hit, Caught, pressed etc.) All over the plant and project sites Working at Height All over the plant and project sites Dust, noise, heat and Vibration All over the plant Material Handling All over the plant and project sites Confined Space (suffocation/ gas poisoning) Furnaces, Tanks, Gas Pipelines, Gas holders, Sumps, Pits, Oil cellar, Conveyor/ cable galleries, Silos, etc. High pressure Steam, Water & industrial gases All over the plant The above safety hazards are associated with varying levels of risks which may lead to injuries as given in the table belowSl. No. Type of hazards A Physical Hazards Sub type Hazard description / Risk Noise Exposure to noise levels exceeding those set by the competent authorities may result in noise-induced hearing loss. Exposure to high noise levels may also interfere with communication and may result in nervous fatigue with an increased risk of occupational injury. Vibration Exposure of workers to hazardous vibration is mainly known as: (a) whole-body vibration, when the body is supported on a surface that is vibrating, which occurs in all forms of transport and when working near vibrating industrial machinery (b) Hand-transmitted vibration, which enters the body through the hands and is caused by various processes in which vibrating tools or work pieces are grasped or pushed by the hands or fingers. Heat and cold stress Risks arise in special conditions: (a) temperature and/or humidity are unusually high (b) workers are exposed to high radiant heat (c) high temperatures and/or humidity occur in combination with heavy protective clothing or a high work rate
  • 21.
    19 (d) temperature isunusually low; 10 Lack of proper illumination Poor lighting affects the Occupational Safety & Working Conditions of people at work causing symptoms like eyestrain, migraine and headaches. Symptoms of this include headaches, lethargy, irritability and poor concentration. Work equipment and machinery guarding The use of work equipment, including machinery and hand and portable power tools, may result in incidents, many of which are serious and some fatal. Lack of guards or inadequate guards, interlocks, safety devices, improper maintenance, no adherence to SMPs etc. can lead to incidents caused by entanglement, sheering, crushing, trapping, cutting, etc. Cranes and hoists All machinery used to lift and/or transport equipment, materials, molten metal or slag should be designed, constructed and erected, inspected, maintained and operated as specified by the manufacturer/ site specific SOPs/ SMPs which otherwise would lead to crane failure / overturning , failure of tools & tackles like slings etc. leading to material slippage, hitting nearby structures/ overhead line etc. Control of hazardous energy The iron and steel industry regularly uses different sources of energy (electric, mechanical, hydraulic, pneumatic, etc.). The safe control of energy should be addressed by procedure and carried out by appropriately trained personnel in accordance with the nature of the energy source and the characteristics of the facilities. Falling objects Failure to properly secure loose materials at height, maintaining proper stack heights, preventing unauthorized entry etc. leading to fall of objects and hitting a nearby person Slips, trips and falls Inadequate housekeeping, improper covers on opening, unsuitable platforms or walkways equipped with handrails and protective barriers etc. may lead slip & trip injuries. Fall from height may occur due to non -usage of fall arrest equipment. Rail & road transport Internal transport, such as road and rail vehicles, transfer cars etc. used in the transport of raw materials, intermediates, products, waste etc. has the potential to cause injuries to workers and other people. The hazards can be caused by interaction between vehicles, vehicles and other objects and personnel, or by loads falling off or from the vehicle. Fire & explosion Steel Plants stores & handles number of flammable chemicals like tar, naptha, benzol, fuel gases, oils, LPG, Propane, Oxygen etc. which possess potential fire & explosion hazards. Hot metal/ slag sparks, welding sparks, electrical short circuiting etc. can also lead to fire in surrounding areas if combustible materials are present. Confined spaces Bin, silos, tunnels, ESPs, manholes, etc. are examples of confined spaces where entry of persons & carrying out jobs requires special precautions. Toxic or flammable gases, oxygen displacement and engulfment are the principal 11 hazards. B Chemical Hazards Sub type Hazard description / Risk Chemicals in the workplace These substances may present a hazard as the result of contact with the body or absorption into the body.
  • 22.
    20 Absorption can occurthrough the skin, by ingestion or by inhalation. Chemicals can have acute (short-term) and/or chronic (long-term) Health effects. Chemicals may present a safety hazard as a result of their chemical and physical properties. Inhalable agents (gases, vapours, dusts and fumes) The production of iron and steel involves the consumption and generation of a variety of inhalable agents including, but not limited to, gases, vapours, dusts, fumes, smokes and aerosols. These agents comprise a variety of toxicological hazards including irritants, chemical asphyxiants, fibrogens, allergens, carcinogens and systemic toxicants. The pulmonary system (lungs) can be affected by exposure to harmful agents through acute (short-term) injury to lung tissue, the development of pneumoconiosis, pulmonary dysfunction and the development of lung cancer. Silica dust is most harmful to lungs and causes silicosis. Certain harmful agents that are inhaled through the lungs can cause target organ damage and/or systemic toxic effects. Certain asphyxiants can cause death in a matter of seconds at high concentrations by displacing oxygen. Specific agents that may be found in the iron and steel industry include heavy metals (e.g. lead, chromium, zinc, nickel and manganese) in the form of fumes, particulates and adsorbates on inert dust particles. Acid mists from pickling areas can cause skin, eye and respiratory irritation. C Radiation Hazards Sub type Hazard description / Risk Ionizing radiation All exposure to ionizing radiation should be kept as low as possible, as there is evidence that damage caused by radiation may be permanent, and that there is a significant increase in the incidence of cancer and some types of malignancies, as a consequence of even low doses of ionizing radiation. Radiation levels to be periodically measured through installation of Radiation Detection Equipments as per amended 2nd Schedule of Factories Act. Non-ionizing radiation Non-ionizing radiation is usually referred to as ultraviolet (UV), visible and infrared (IR) radiation Absorption in the UV and visible portions of the spectrum produces photochemical reactions. In the IR region, all of the absorbed radiant energy is converted into heat. Exposure to some radio-frequency and microwave radiation can result in the formation of cataracts of the eye. Exposure of the eyes to visible and IR radiation can cause thermal injury to the retina and damage to the lens, which may result in the formation of cataracts. Exposure of the eyes to UV radiation can result in 12 inflammation of the conjunctiva and cornea. D Ergonomic Hazards Hazard description / Risk These hazards are due to tool design, equipment design, job and task design, work station design, and manual handling etc. E Psychological Hazards Hazard description / Risk These hazards are due to shift work, work load, harassment, discrimination, bullying, and stress etc
  • 23.
    21 ROAD AHEAD The steelindustry has emerged as a major focus area given the dependence of a diverse range of sectors on its output as India works to become a manufacturing powerhouse through policy initiatives like Make in India. With the industry accounting for about 2% of the nation's GDP, India ranks as the world's second-largest producer of steel and is poised to overtake China as the world's second-largest consumer of steel. Both the industry and the nation's export manufacturing capacity have the potential to help India regain its favourable steel trade balance. The National Steel Policy, 2017 envisage 300 million tonnes of production capacity by 2030- 31. The per capita consumption of steel has increased from 57.6 kgs to 74.1 kgs during the last five years. The government has a fixed objective of increasing rural consumption of steel from the current 19.6 kg/per capita to 38 kg/per capita by 2030-31. As per Indian Steel Association (ISA), steel demand will grow by 7.2% in 2019-20 and 2020-21. Huge scope for growth is offered by India's comparatively low per capita steel consumption and the expected rise in consumption due to increased infrastructure construction and the thriving automobile and railways sectors. Industry Contacts  Steel Authority of India Ltd  Ministry of Steel  Aluminium Association of India  Federation of Indian Mineral Industries  Indian Stainless Steel Development Association States with the Highest Steel-Producing Capacity in India  Odisha  Chhattisgarh  Jharkhand
  • 24.
    22  Karnataka ROBUST DEMAND *India’sfinished steel consumption is anticipated to increase to 230 MT by 2030-31 from 133.596 MT in FY22. *As of October 2021, India was the world’s second-largest producer of crude steel, with an output of 9.8 MT. INCREASING INVESTMENTS The industry is witnessing consolidation of players, which has led to investment by entities from other sectors. The ongoing consolidation also presents an opportunity to global players to enter the Indian market. POLICY SUPPORT *In October 2021, the government announced guidelines for the approved specialty steel production-linked incentive (PLI) scheme.
  • 25.
    23 *Under the UnionBudget 2022-23, the government allocated Rs. 47 crore (US$ 6.2 million) to the Ministry of Steel. COMPETITIVE ADVANTAGE *As of September 2021, India was the world’s second-largest producer of crude steel, with an output of 9.5 MT. *Easy availability of low-cost manpower and presence of abundant iron ore reserves make India competitive in the global set up. *India is home to fifth-highest reserves of iron ore in the world. JSW STEEL LTD JSW Steel is a flagship company of the JSW Group. The company is a leading integrated steel manufacturer. Currently one of the fastest-growing companies in India, it has a presence in over 100 countries. JSW is also the first company to manufacture high-strength and advanced high-end steel products for its automotive segments. With the largest product portfolio in steel, the company is also India's largest steel exporter, shipping to over 100 countries across five continents. With plants in Karnataka, Tamil Nadu, and Maharashtra, it has the capacity to produce 18 MTPA. Now, as the company ramp-ups production plans, it is on track to hit the 40 MTPA mark, within a span of 10 years. JSW Steel plans to increase its capacity to produce around 27 million tonnes (MT) of crude steel by financial year 2022 from about 18 MT in fiscal year 2020. The US$ 22 billion JSW Group is ranked among India's leading business houses. JSW's innovative and sustainable presence in various sectors including Steel, Energy, Infrastructure, Cement, Paints, Venture Capital and Sports is helping the Group play an important role in driving India’s economic growth. The Group strives for excellence by leveraging its strengths & capabilities including a successful track-record of executing large capital-intensive & technically complex projects, differentiated product-mix, state-of-the-art manufacturing facilities and greater focus on pursuing sustainable growth.
  • 26.
    24 With a culturallydiverse workforce spread across India, USA, Europe and Africa, JSW Group directly employs nearly 40,000 people. It also has a strong social development focus aimed at empowering local communities residing around its Plant & Port locations. JSW Group is known to create value for all its stakeholders by combining its growth roadmap, superior execution capabilities and a relentless drive to be #BetterEveryday. TATA STEEL LTD Tata Steel is currently the world’s second-most geographically diversified steel producer with an annual crude steel capacity of 34 million tonnes per annum (MTPA). The company one of the few steel operations that is fully integrated – from mining to the manufacturing and marketing of finished products. Continuous improvement in its product and service portfolio, along with success in value creating initiatives for customers, allows the company to serve global growth markets. Today, it operates in 26 countries and has a commercial presence in over 50 countries with employees across five continents. The company’s raw material operations are spread across India and Canada which helps it to be self-sufficient in steel production.The company is dominant in various parts of the world mainly India ,Europe and South-East Asia. INDIA Tata Steel was established in India as Asia’s first integrated private steel company in 1907. With this, we also developed India’s first industrial city at Jamshedpur. Today, we are among the leading global steel companies. Our annual crude steel capacity across Indian operations is nearly 20 MnTPA and we registered a turnover of INR 91,037 crore in FY21. We also set up our second greenfield steel plant of 3 MnTPA in the eastern state of Odisha in 2016; the expansion to 8 MnTPA in currently underway. We possess and operate captive mines that help us maintain cost- competitiveness and production efficiencies through an uninterrupted supply of raw material. This is how we ensure that we remain the lowest cost producer of steel in Asia. The Indian product portfolio is divided into four segments – Automotive and Special Products; Industrial Products, Projects and Exports; Branded Products and Retail; and Services and
  • 27.
    25 Solutions. The Companysupplies hot-rolled, cold-rolled, galvanised, branded solution offerings and more. EUROPE Tata Steel is one of the largest steel producers in Europe with a crude steel production capacity of over 12.4 MnTPA. We established our presence in the European continent after acquiring Corus in 2007. The manufacturing facilities in Europe comprise primary steel-making facilities in the Netherlands and the United Kingdom, with downstream operations in the Netherlands, the United Kingdom, Germany, France, Belgium, Sweden, and Turkey. The European operations produce a wide range of high-quality quality strip steel products for demanding markets such as construction, automotive, packaging and engineering. SOUTH-EAST ASIA Tata Steel’s operations in South-East Asia, with 2.2 MnTPA capacity, began in 2004 with the acquisition of NatSteel, Singapore. The operations are run by NatSteel Holdings Pte Ltd., a wholly-owned subsidiary of Tata Steel. The Company’s flagship facility at Singapore is one of the largest single downstream rebar fabrication operations in the world. This plant is the only local steel mill with an integrated upstream and downstream operation, where steel is manufactured through recycling scrap, and fabricated according to customers’ needs.
  • 28.
    26 In 2015, weacquired a majority stake in Thailand-based steelmaker Millennium Steel, which strengthened our South-East Asian operations. is the largest and most diverse long steel manufacturer in Thailand using recyclable steel scrap as raw material. The product range includes High Tensile Rebars, ready to use Cut & Bend products, light structurals, and specialty wire rods for making Tire Cord, Tire bead, Wire Ropes, and stick electrodes. The company has a pan Thailand distribution network and regularly exports steel to Laos, Cambodia, Indonesia, Malaysia, India, and Bangladesh. JINDAL STEEL AND POWER LTD With its timeless business philosophy JSPL is primed to not merely survive but win in a marketplace marked by frenetic change. Indeed, the company’s scorching success story has been scripted essentially by its resolve to innovate, set new standards, enhance capabilities, enrich lives and to ensure that it stays true to its haloed value system. Not surprisingly, the company is very much a future corporation, poised to become the most preferred steel manufacturer in the country. JSPL is an industrial powerhouse with a dominant presence in steel, power, mining and infrastructure sectors. Part of the US $ 18 billion OP Jindal Group this young, agile and responsive company is constantly expanding its capabilities to fuel its fairy tale journey that has seen it grow to a US $ 3.3 billion business conglomerate. The company has committed investments exceeding US $ 30 billion in the future and has several business initiatives running simultaneously across continents. Led by Mr Naveen Jindal, the youngest son of the legendary Shri O.P. Jindal, the company produces economical and efficient steel and power through backward and forward integration. From the widest flat products to a whole range of long products, JSPL today sports a product portfolio that caters to markets across the steel value chain. The company produces the world's longest (121-meter) rails and it is the first in the country to manufacture large-size parallel flange beams. JSPL operates the largest coal-based sponge iron plant in the world and has an installed capacity of 3 MTPA (million tonnes per annum) of steel at Raigarh in Chhattisgarh. Also, it has set up a 0.6 MTPA wire rod mill and a 1 MTPA capacity bar mill at Patratu, Jharkhand, a medium and
  • 29.
    27 light structural millat Raigarh, Chhattisgarh and a 2.5 MTPA steel melting shop and a plate mill to produce up to 5.00-meter-wide plates at Angul, Odisha. An enterprising spirit and the ability to discern future trends have been the driving force behind the company's remarkable growth story. The organisation is wedded to ideals like innovation and technological leadership and is backed by a highly driven and dedicated workforce of 15000 people. JSPL has been rated as the second highest value creator in the world by the Boston Consulting Group, the 11th fastest growing company in India by Business World and has figured in the Forbes Asia list of Fab 50 companies. It has also been named among the Best Blue Chip companies and rated as the Highest Wealth Creator by the Dalal Street Journal. Dun & Bradstreet has ranked it 4th in its list of companies that generated the highest total income in the iron and steel sector. More ENVIRONMENTAL ISSUES OF THE STEEL INDUSTRY  Steel is ‘iron with most of the carbon removed’  Iron constitutes about five per cent of the Earth's crust and is the fourth most abundant element in the crust.  98% of the iron ore mined is used to make steel  Steel represents around 95% of all metals produced
  • 30.
    28  The biggestproducer of steel by far is China (1607 million metric tonnes in 2013), followed by the EU (165), Japan (110), USA (87) and India (81)  Steel use per capita increased from 150kg in 2001 to 220kg in 2010 (Wsteel Assoc)  51% of global steel is used for construction (Wsteel Assoc  6.5% of CO2 emissions derive from iron and steel production (IEA 2010)  Iron doesn’t occur naturally. Being highly reactive, it combines easily with other minerals to form ores. Those with the highest iron content are found near the surface of the earth and are relatively easy to mine.  The principal iron ores are hematite (Fe2O3) and magnetite (Fe3O4).  Most iron ore is extracted through opencast mines.  To be economically viable for mining, iron ore must contain at least 20% iron.  The three major sources of iron are China (23%), Australia (18%) and Brazil (18%). (2011 figures) Iron ore is converted into various types of iron through several processes. The most common process is the use of a blast furnace to produce pig iron which is about 92-94% iron and 3-5% carbon with smaller amounts of other elements. Pig iron has only limited uses, and most of this iron goes on to a steel mill where it is converted into various steel alloys by further reducing the carbon content and adding other elements such as manganese and nickel to give the steel specific properties. Limestone  Limestone is calcium carbonate (CaCO3). It is mainly composed of the skeletal remains of marine organisms.  Geologically, limestone occurs as a sedimentary layer over bedrock. As such it is relatively easy to extract through quarrying.  Limestone is removed from the quarry, crushed and transported to steel mills. Coke Coke is produced from coal. The coal is heated, or ‘carbonised’ in an oven until it becomes coke. It is then removed from the oven and cooled before use in the blast furnace. The coal gas produced during carbonisation is collected and used as a fuel in the manufacturing process while by-products such as tar, benzole and sulphur are extracted for further refining.
  • 31.
    29 Recycling 42% of crudesteel produced is recycled material Re-melting proportion of steel scrap is constrained by availability. Availability can sometimes be defined as cost effective recovery. Iron and steel are the world's most recycled materials, and among the easiest materials to reprocess, as they can be separated magnetically from the waste stream. Recycling is via a steelworks: scrap is either re-melted in an electric arc furnace (90-100% scrap), or used as part of the charge in a Basic Oxygen Furnace (around 25% scrap). Any grade of steel can be recycled to top quality new metal, with no 'downgrading' from prime to lower quality materials as steel is recycled repeatedly. Recovery and reuse in construction Globally around 85% of construction steel is currently recovered from demolition (sourceWSA) (UK 96% source steelconstruction.info) Re-use of structural steel Steel reuse is any process where end-of-life steel is not re-melted but rather enters a new product use phase. Steel buildings and products are intrinsically demountable. Easily re-usable components include:  Piles (sheet and bearing piles)  Structural members including hollow sections  Light gauge products such as purlins and rails. Design for reuse To facilitate greater reuse it is important that designers not only use steel but also do what they can to optimise future reuse. Steps that the designer can take to maximise the opportunity for reusing structural steel include:
  • 32.
    30  End platebeam to column and beam to beam connections  Use bolted connections in preference to welded joints to allow the structure to be dismantled during deconstruction  Use standard connection details including bolt sizes and the spacing of holes  Ensure easy and permanent access to connections  Where feasible, try to ensure that the steel is free from coatings or coverings that will prevent visual assessment of the condition of the steel.  Minimise the use of fixings to structural steel elements that require welding, drilling holes, or fixing with Hilti nails; use clamped fittings where possible  Identify the origin and properties of the component for example by bar-coding or e-tagging or stamping and keep an inventory of products  Use long-span beams as they are more likely to allow flexibility of use and to be reusable by cutting the beam to a new length. (source: SteelConstruction.info) The environmental impact of steel production Steel production has a number of impacts on the environment, including air emissions (CO, SOx, NOx, PM2), wastewater contaminants, hazardous wastes, and solid wastes. The major environmental impacts from integrated steel mills are from coking and iron-making. Climate change Virtually all of the greenhouse gas emissions associated with steel production are from the carbon dioxide emissions related to energy consumption. Emissions to air Coke production is one of the major pollution sources from steel production. Air emissions such as coke oven gas, naphthalene, ammonium compounds, crude light oil, sulfur and coke dust are released from coke ovens. Emissions to water Water emissions come from the water used to cool coke after it has finished baking. Quenching water becomes contaminated with coke breezes and other compounds. While the volume of
  • 33.
    31 contaminated water canbe great, quenching water is fairly easy to reuse. Most pollutants can be removed by filtration. Waste Slag, the limestone and iron ore impurities collected at the top of the molten iron, make up the largest portion of iron-making by-products. Sulfur dioxide and hydrogen sulfide are volatized and captured in air emissions control equipment and the residual slag is sold to the construction industry. While this is not a pollution prevention technique, the solid waste does not reach landfills. Gaseous emissions and metal dust are the most prominent sources of waste from electric arc furnaces.
  • 34.
  • 35.
    32 Profit Analysis Introduction toProfit Analysis In managerial economics, profit analysis is a form of cost accounting used for elementary instruction and short run decisions. A profit analysis widens the use of info provided by breakeven analysis. An important part of profit analysis is the point where total revenues and total costs are equal. At this breakeven point, the company does not experience any income or any loss. Components of Profit Analysis The key components involved in profit analysis include: • Selling price per unit • Level or volume of activity • Total fixed costs • Per unit variable cost • Sales mix Assumptions in Profit Analysis The profit analysis incorporates the following assumptions: • Unvarying sales price, • Unvarying variable cost per unit, • Unvarying total fixed cost, • Unvarying sales mix, • Units sold equal units produced. These are largely linearizing and simplifying assumptions, which are frequently presumed in elementary discussions of costs and profits. In more advanced accounting treatments, costs and revenue are nonlinear thus making the analysis more complicated.
  • 36.
    33 Applications of ProfitAnalysis The profit analysis is helpful in simplifying the calculation of breakeven in breakeven analysis. Besides, it is generally helpful in simple calculation of Target Income Sales. Moreover, it also simplifies the process of analyzing short run trade-offs in operational decisions. Method adopted for Profit Analysis The main method adopted to carry out profit analysis is the profit volume ratio which is calculated by dividing the shareholders contribution by the sales and then multiplying it by 100 as follows: Profit Volume Ratio = (Shareholder’s contribution / Sales) * 100 Limitations of Profit Analysis The profit analysis is a short run and marginal analysis which presumes the unit variable costs and the unit revenues to be constant. This is, however, appropriate for small deviations from current production and sales. Besides, the profit analysis also presumes a neat division between variable costs and fixed costs, though in the long run, all costs are variable. Therefore, for longer term profit analysis considering the complete life-cycle of a product it is preferable to carry out activity-based costing or throughout accounting. Conceptual Review Financial performance is the process of measuring the results of a firm’s policies and operations in monetary terms. It is used to measure firm’s overall financial health over a given period of time and can also be used to compare similar firms across the same industry or to compare industries or sectors in aggregation. It also includes analysis and interpretation of various financial statements These are important factors used for the analysis of financial performance of the company. It refers to the degree to which financial objectives being or has been accomplished and is an important aspect of finance risk management. It can measure a firm’s wealth Financial performance analysis includes analysis and interpretation of financial statements in such a way that it undertakes full diagnosis of theprofitability and financial soundness of the business. Ratio analysis and comparative statements are the important tools used for the analysis of the financial performance of that particular company.
  • 37.
    34 Ratio analysis Ratio analysisis a quantitative method of gaining insight into a company's liquidity, operational efficiency, and profitability by studying its financial statements such as the balance sheet and income statement. Ratio analysis is a cornerstone of fundamental equity analysis. A) Liquidity ratio Liquidity refers to the ability of the concern to meet its current obligations as and when these become due. These ratios measure short term solvency of a firm. 1. Current ratios: It may be defined as the relationship between current assets and current liabilities. It is also known as working capital ratio. It is most widely used to make the analysis of a short-term financial position of the firm. 2. Liquid ratio: It is the ratio of liquid assets to current liabilities. It is the measure of instant debt paying ability of the business enterprise. It is also known as quick ratio, acid test ratio, or near money ratio. 3. Absolute liquid ratio: It is calculated by dividing absolute liquid assets like cash in hand, cash at bank and marketable securities by current liability. It is also known as cash ratio. B) Solvency ratio (long term solvency ratio) The term solvency means the ability of the firm to pay of its outside liabilities, that is, its long term and short term. Solvency ratio is also known as long term solvency ratio or long-term liquidity ratio. 1. Debt-equity ratio: It expresses the relationship between long term debt and equity. Long term debt means funds invested by the outsiders. It includes debentures, mortgages, all long-term loans etc. 2. Proprietary ratio: It establishes the relationship between shareholders’ or proprietors’ fund and total assets. It shows how much funds have been contributed by shareholders in the total assets of the firm. It is also known as equity ratio or net worth ratio. 3. Solvency ratio: This ratio expresses the relationship between total assets and total liabilities of a business. A firm is said to be solvent when it has assets worth more than its outsiders’ liabilities. It is also known as ratio of total assets to total debt. 4. Fixed asset to net worth ratio: This ratio establishes the relationship between two components that is fixed assets and proprietors’ fund. This ratio indicates the extent to which shareholders’ funds are invested in the fixed assets. This ratio is also known as proprietors’ fund ratio.
  • 38.
    35 5. Fixed assetratio: This ratio establishes the relationship between two components that is, fixed assets and long-term funds. Long term fund includes, shareholders’ fund and long term borrowed funds. Thus, it is called capital employed. 6. Capital gearing ratio: The gearing ratio is a measure of financial risk and expresses the amount of a company’s debt in terms of its equity. The term capital gearing means, the proportion between fixed income bearing funds and equity. C) Profitability ratio 1. Gross profit ratio: Gross profit ratio (GP ratio) is a financial ratio that measures the performance and efficiency of a business by dividing its gross profit figure by the total net sales. It is then called gross profit percentage or gross profit margin. 2. Net profit ratio: The net profit percentage is the ratio of after-tax profits to net sales. It reveals the remaining profit after all costs of production, administration, and financing have been deducted from sales, and income taxes recognized. It is also used to compare the results of a business with its competitors. 3. Operating cost ratio: It is computed by dividing operating expenses of a particular period by net sales made during that period. It is also known as operating expense ratio. 4. Operating profit ratio: The operating profit margin ratio indicates how much profit a company makes after paying for variable costs of production such as wages, raw materials, etc. It is also expressed as a percentage of sales and then shows the efficiency of a company controlling the costs and expenses associated with business operations. Comparative balance sheet A comparative balance sheet is a statement that shows the financial position of an organization over different periods for which comparison is made or required. The financial position is compared with 2 or more periods to depict the trend, direction of change, analyze and take suitable actions. It is the study of trend of same items, group of items and computed items in two or more balance sheets of the same concern at different period. Preparing Comparative Financial Statements is the most commonly used technique for analyzing financial statements. This technique determines the profitability and financial position of a business by comparing financial statements. Hence, this technique is also termed as Horizontal Analysis.
  • 39.
    36 Typically, the incomestatements and balance sheets are prepared in a comparative form to undertake such an analysis. In this study, the balance sheets of past five years are taken for the comparative analysis. Interpretation of the comparative balance sheet is made on the basis of current financial position, liquidity position, long term financial position and profitability of the concern. The excess of current assets over current liability will give the figure of working capital. An increase in working capital means an increase in current financial position of the company. And excess current assets over current liabilities show a good short term financial position. If liquid assets like cash in hand, cash at bank, bills receivable, debtors etc. shows an increase in current year when compared to the base year, this improves the liquidity position of the concern. Long term financial position of the concern can be analyzed by studying the changes in fixed assets, long term liabilities and capital. Increase in fixed assets is compared with increase in long term liabilities and capital. If, increase in fixed asset is more than increase in long term liabilities, it is meant for that part of fixed assets has been financed by the working capital. Increase in balance of P&L account and other reserves created from profit will means an increased profitability of the concern. Empirical Review- The empirical review is simply talking about the various researches done by other researchers concerning your topic or peoples research works that are similar to your research work. The names of various researchers must be attached to their findings or statement. An empirical literature review is more commonly called a systematic literature review and it examines past empirical studies to answer a particular research question. The empirical studies we examine are usually random controlled trials (RCTs). The literature review helps to form the theoretical basis of the research. • Shinde Govind P. & Dubey Manisha (2011) conducted a study considering the segments such as passenger vehicle, commercial vehicle, and utility vehicle, two and three-wheeler vehicle of key player’s performance and also made a SWOT analysis and studied key factors influencing growth of automobile industry. • Fernandez (2007) says through the study that those who lead to corporate finance every day or are somehow related to this area, is important to have in mind all these methods and what are behind them.
  • 40.
    37 Valuation is notalso essential for M&A opportunities but also to understand where the company is creating or destroying value. • Anu B. (2015) made an attempt to examine the relationship between capital structure indicators, market price per shares and also to test relationship between debt-equity and market price per share ofselected companies in industry. The study concludes that all three companies support the hypothesis that there is relation between debt-equity and MPS. • Devani (2010) concluded that the studyon relationship between dividend per share, earnings per share, price earnings, dividend yield and dividend cover with equity share prices leads to a concept that all the selected explanatory variable has a significant impact on the equity share prices except growth variable. • Daniel A Moses Joshunar (2013) conducted a study to identify the financial strength and weakness of the JSW STEEL LTD. Using past 5-year financial statements. Trend analysis & ratio analysis used to comment of financial status of company. Financial performance of company is satisfactory and also suggested to increase the loan levels of company for the better performance. • Zafar S.M. Tariq & Khalid S.M (2012) conducted a study and explored that ratio are calculated from financial statements which are prepared as desired policies adoptedon depreciation and stock valuation by the management. Ratio is a simple comparison of numerator and a denominator that cannot produce complete and authentic picture of business. Results are manipulated and also may not highlight other factors which affect performance of firm by promoters. • Huda Salhe Meften & Manish Roy Tirkey (2014) have studied the financial analysis of Hindustan petroleum corporation Ltd. The study is based on secondary data. The company has got excellent gross profit ratio and trend is rising in with is appreciable indicating efficiency in production cost. The net profit for the year 2010-11 is excellent & it is 8 times past year indicating reduction in operating reduction in operating expenses and large proportion of net sales available to the shareholders of company. • Surekha B. & Krishnaiah K. Rama (2015) undertook a study to reveal the prosperity of The three companies Company. It can be concluded that inner strength of company is remarkable. Company can further improve its profitability by optimum capital gearing, reduction in administration and
  • 41.
    38 financialexpenses for thegrowth of company. • Agarwal, Nidhi (2015) conducted a study focusing on the comparative financial performance of Maruti Suzuki and JSW STEEL LTD. The financial data and information required for the study are drawn fromthe various annual reports of companies. The liquidity and leverage analysis of both the firms are done. To analyses the leverage position four ratios are considered namely, capital gearing, debt- equity, totaldebt and proprietary ratio. The result shows that JSW STEEL LTD has to increase the portion of proprietor’s fund in business to improve long term solvency position. • Kaur Harpreet (2016) tried to examine the qualities & quantities performer of Maruti Suzuki co. & how had both impact on its market share in India, for this study secondary data has been collectedfrom annual reports, journals, report automobile sites. Result shows that MSL has been successfully leading automobile sector in India for last few years.
  • 42.
  • 43.
    RESEARCH METHODLOGY: Research means“know about new things”. Sometimes, it may refer to scientific and systematic search pertinent information on specific topic. In fact, research is an art of scientific investigation. According to Clifford Woody research comprises of. “Define and redefining problem, formulating hypothesis or suggested solution, collecting, organizing and evaluating data; making deduction and reaching conclusion; and at last, carefully testing the conclusion to determine whether they fit the formulating hypothesis”. Redman and Moray define research as a “systematic effort to gain new knowledge”. Research can be defined as the search of knowledge or any systematic investigation to establish fact. OBJECTIVES OF STUDY: The broad objectives of the study are to analysis the liquidity position of companies in India. The objectives are as under:  To do a comparative analysis of Gross Profit Ratio in the selected companies.  To do a comparative analysis of Net Profit Ratio in the selected companies.  To do a comparative analysis of Operating Cost Ratio in the selected companies.  To do a comparative analysis of Operating Profit Ratio in the selected companies. SCOPE OF STUDY: The scope of my study will be confined to: 1. Financial Report of the Company for past few years. 2. Records compiled and held with company. 3. The market share of the three selected companies. RESEARCH DESIGN: This chapter covers Problem Identification, Survey of Existing Literature- Statement of Problem, Objectives of the study-Hypothesis, Universe of Study, Sampling Design, Period of Study- Data collection and data analysis, Tools and techniques for analysis of profitability and Limitations of the study. 39
  • 44.
    TYPES OF RESEARCHDESIGN:  Exploratory Design  Descriptive Design I used descriptive research design in my research study. Descriptive research design is a type of research design that aims to obtain information to systematically describe a phenomenon, situation, or population. More specifically, it helps answer the what, when, where, and how questions regarding the research problem, rather than the why. The descriptive method of research can involve the use of many different kinds of research methods to investigate the variables in question. It predominantly employs quantitative data, although qualitative data is also used sometimes for descriptive purposes. It is important to note that in the descriptive method of research, unlike in experimental research, the researcher does not control or manipulate any variables. Instead, the variables are only identified, observed, and measured. METHOD OF DATA COLLECTION The data can be selected in SECONDARY SOURCE OF DATA COLLECTION: Despite all efforts no earlier study on the subject matter could be obtained from research and was informed that they have never put these aspects in writing, although such things were for bankers andother institution according to their requirement I was able to study considerable amount of already published material (i.e., books, magazines, annualreport of other companies etc.) on the subject and this served as useful input in conduct 40
  • 45.
    41 of my project. Informationgained during the exploratory research while doing interaction management were alsovaluable inputs. The secondary data is collected by the detailed study & critical analysis of the various records of thecompany. DATA ANALYSIS In this study data is analysis by various graphs and tables. Data Analysis:Data analysis is a process of inspecting, cleansing, transforming, and modeling data with the goal of discovering useful information, informing conclusions, and supporting decision-making. Data analysishas multiple facets and approaches, encompassing diverse techniques under a variety of names, and isused in different business, science, and social science domains. In today’s business world, data analysisplays a role in making decisions more scientific and helping businesses operate more effectively. Although many groups, organizations, and experts have different ways to approach data analysis, most of them can be distilled into a one-size-fits-all definition. Data analysis is the process of cleaning, changing, and processing raw data, and extracting actionable, relevant information that helps businesses make informed decisions. The procedure helps reduce the risks inherent in decision makingby providing useful insights and statistics, often presented in charts, images, tables, and graphs LIMITATIONS OF STUDY:  Time: The time duration could not provide ample opportunity to study every detail of working capital management of the company. The study cover 45 days. 68  Economical Condition: The financial statements generally based on historical or original cost. The current economical condition is ignored.  Confidential Information: As the company on account of confidential report has not disclosed some figures. Moreover, in some cases separate accounts of division are not separately maintained thereby, leading to restrictions in study.  Financial Matter: Since the financial matter are sensitive in nature the same could not acquired easily.  Data Availability: Data availability is very rare & the company is not ready to provide full
  • 46.
    42 facts and figuresabout their organization that is under study. My study is confined to the topic of financial management on profitability analysis of the three companies limited. In this study, I cover various areas of profitability like gross profit, net profit, profit before tax, profit after tax, profitability ratio, etc.
  • 47.
  • 48.
    43 GROSS PROFIT RATIO 98.5 98 97.5 97GROSS PROFIT RATIO 96.5 96 JSW STEEL LTD TATA STEEL LTD JINDAL STEEL AND POWER LTD Profitability Ratio Gross profit ratio = (gross profit/revenue from operation) *100 Showing gross profit ratio COMPANIE S GROSS PROFIT RATIO JSW STEEL LTD (116928/120749) *100 = 96.83% TATA STEEL LTD (127681//130473) *100 = 97.86% JINDAL STELL AND POWER LTD (102829/104515) *100 = 98.38% The following table shows gross profit ratio. There is no norm to interpret gross profit ratio. Generally,ahigher ratio is considered better. Here the company has highest ratio for the last five years. So, the grossprofit ratio is satisfied. Showing gross profit ratio:
  • 49.
    44 Net profit ratio= (net profit after tax/revenue from operation) *100 Showing net profit ratio COMPANIE S NET PROFIT RATIO JSW STEEL LTD (116928/120749) *100 = 96.83% TATA STEEL LTD (127681/130473) *100 = 97.86% JINDAL STELL AND POWER LTD (102829/104515) *100 = 98.38% The following table shows net profit ratio. Generally, the ideal net profit ratio is 10%. The company has failed to attain the standard ratio, which means the company is underpricing. Also shows lower profitability and lower return to the shareholders of the company. Net profit ratio for the past five yearsshows negative value because of net loss for the mentioned period except 2018-2019. Showing net profit ratio NET PROFIT RATIO 98.5 98 97.5 NET PROFIT RATIO 97 96.5 96 JSW STEEL LTD TATA STEEL LTD JINDAL STEEL AND POWER
  • 50.
    45 OPERATING COST RATIO 45 40 35 30 25 20 15 10 5 0 OPERATINGCOST RATIO JSW STEEL LTD TAT STEEL LTD JINDAL STEEL AND POWER LTD Operating cost ratio = (operating cost/revenue from operation) *100 Showing operating cost ratio COMPANIES OPERATING COST RATIO JSW STEEL LTD (30168/120749) *100 = 24.98% TATA STEEL LTD (35256/130473) *100 = 27.02% JINDAL STELL AND POWER LTD (42776/104515) *100 = 40.92% The following table shows operating cost ratio. The ideal ratio of operating cost ratio is 60% to 80%. Although, the lower it is, the better. Here, the company has lower ratio, which indicates that the expenses are decreasing. This is a positive sign for the company.
  • 51.
    46 OPERATING PROFIT RATIO 99 98.8 98.6 98.4 98.2 98 97.8 97.6 97.4 97.2 OPERATINGPROFIT RATIO JSW STEEL LTD TATA STEEL LTD JINDAL STEEL AND POWER LTD Operating profit ratio = (operating profit/revenue from operation) *100 Operating profit = Net profit before taxes + non- operating expenses – non-operating incomes Showing operating profit ratio COMPANIE S OPERATING PROFIT RATIO JSW STEEL LTD (118820/120749) *100 = 98.4% TATA STEEL LTD (127681/130473) *100 = 97.83% JINDAL STELL AND POWER LTD (103473/104515) *100 = 99% The following table shows operating profit ratio. An operating profit ratio higher than 15% is considered good. The company has higher ratio for the past five years. So it indicates that the companyis earning enough money from business operations to pay for all of the associated costs
  • 52.
    47 PROFIT AFTER TAX 35000 30000 25000 20000 PROFITAFTER TAX 15000 10000 5000 0 JSE STEEL LTD TATA STEEL LTD JINDAL STEEL LTD PROFIT AFTER TAX COMPANIES Profit after Tax JSW STEEL LTD 16702 TATA STEEL LTD 33011 JINDAL STEEL AND POWER LTD 8283 The profit after tax of the three companies is shown in the graph below.
  • 53.
    48 PROFIT BEFORE TAX 50000 45000 40000 35000 30000 25000 PROFITBEFORE TAX 20000 15000 10000 5000 0 JSW STEEL LTD TATA STEEL LTD JINDAL STEELAND POWER LTD PROFIT BEFORE TAX COMPANIES PROFIT BEFORE TAX JSW STEEL LTD 24715 TATA STEEL LTD 44090 JINDAL STEEL AND POWER LTD 11168
  • 54.
  • 55.
    Conclusion: The study highlights,the financial performance of JINDAL STELL AND POWER LTD is the most satisfactory. To conclude, JINDAL STELL AND POWER company has shown its power in the industry despite being a public sector undertaking.  JINDAL STELL AND POWER has the best gross profit ratio with TATA steel ltd. Nearly behind it , but JSW steel l=td lacking far behind.  Net profit ratio of JSW steel ltd is the lowest with TATA steel and JINDAL STELL AND POWER ltd being just above it.  We got to know that JSW steel steel limited has the highest export in the iron and steel industry and leads the export market of india.  Operating cost ratio of JSW steel ltd and TATA steel ltd is almost similar but the ratio of JINDAL STELL AND POWER ltd. Is far head of them both.  Operating profit ratio of TATA steel being the lowest and JSW steel ltd being far ahead TATA steel in this ratio.
  • 56.
    50 Suggestions:  TATA steelhas to improve its short-term financial position by increasing its working capital.  JSW has to increase its short term financial conditions in order to finance even short-term liabilities.  Jsw steel is dependent on is creditors for working capital, which may lead to increased liabilities.  TATA steel ltd share capital is constant for the past five years. They have to improve its share capital by improving the net earnings.  JINDAL STELL AND POWER LTD pay huge amounts of dividend in order to satisfy the need of revenue of the government and so a diminished revenue is available for research and development so JINDAL STELL AND POWER needs to think of that.  JSW steel has utilized the dividend. This may create a bad impact on the investors. So, it is very important to increase its sales revenue.
  • 57.
  • 58.
    51 Reference books: • Brigham,E. and Houston, J., n.d. Fundamentals of financial management. • Higgins, R., Koski, J. and Mitton, T., 2019. Analysis for financial management. New York, NY: McGraw-Hill Education. • Khan, M. and Jain, P., 2014. Financial management. New Delhi: McGraw Hill Education. • Palmer, J., 1983. Financial ratio analysis. New York, N.Y.: American Institute of Certified Public Accountants. Journals: • Dundas, J., 2009. Understanding Code Patterns – Analysis, Interpretation & Measurement. International Journal of Computer and Electrical Engineering, pp.46-55. Websites: • En.wikipedia.org. 2021. Steel industry - Wikipedia. [online] Available at: <https://en.wikipedia.org/wiki/Automotive_industry> [Accessed 28 March 2021]. • Tatasteel.com. 2021. Largest steel Manufacturer, Biggest Automobile Company in India.[online] Available at: <https://www.tatamotors.com/> [Accessed 22 March 2021]. • Investopedia. 2021. Reading Financial Performance. [online] Available at:<https://www.investopedia.com/terms/f/financialperformance.asp#:~: text=Financial%20performance%20is%20a%20subjective,health%20ov er%20a%20given%20period.> [Accessed 23 March 2021]. • En.wikipedia.org. 2021. Tata steel - Wikipedia. [online] Available at: <https://en.wikipedia.org/wiki/Tata_steel> [Accessed 28 March 2021]. • Moneycontrol.com. 2021. The three companies Balance Sheet, The three companies Financial Statement & Accounts.[online] Available at: <https://www.moneycontrol.com/financials/tatamotors/balance- sheet VI/TM03> [Accessed 22 Msheet VI21].
  • 59.
  • 60.
    BALANCE SHEET OFJSW STEEL : Total Current Assets 186,042,134 Cash and Short Term Investments 101,946,477 Cash Cash & Equivalents 26,604,994 Short Term Investments 75,341,483 Total Receivables, Net 43,878,105 Accounts Receivables - Trade, Net 40,367,204 Total Inventory 30,908,762 Prepaid Expenses 6,510,301 Other Current Assets, Total 2,798,489 Total Assets 353,385,985 Property/Plant/Equipment, Total - Net 116,855,571 Property/Plant/Equipment, Total - Gross Accumulated Depreciation, Total Goodwill, Net Intangibles, Net 15,705,674 Long Term Investments 17,362,503 Note Receivable - Long Term Other Long Term Assets, Total 17,420,103
  • 61.
    54 Other Assets, Total TotalCurrent Liabilities 63,303,192 Accounts Payable 11,422,269 Payable/Accrued Accrued Expenses 17,179,210 Notes Payable/Short Term Debt 12,330,248 Current Port. of LT Debt/Capital Leases 792,467 Other Current liabilities, Total 21,578,998 Total Liabilities 97,982,535 Total Long Term Debt 3,010,623 Long Term Debt 1,008,058 Capital Lease Obligations 2,002,565 Deferred Income Tax 17,185,000 Minority Interest 8,038,794 Other Liabilities, Total 6,444,926 Total Equity 255,403,450 Redeemable Preferred Stock, Total Preferred Stock - Non Redeemable, Net Common Stock, Total 897,514 Additional Paid-In Capital 4,403,893 Retained Earnings (Accumulated Deficit) 251,761,348
  • 62.
    55 Treasury Stock -Common ESOP Debt Guarantee Unrealized Gain (Loss) 2,396,720 Other Equity, Total -4,056,025 Total Liabilities & Shareholders' Equity 353,385,985 Total Common Shares Outstanding 6,792.67 Total Preferred Shares Outstanding
  • 63.
    56 BALANCE SHEET OFTATA STEEL : Total Current Assets 203,634,913 Cash and Short Term Investments 118,540,312 Cash Cash & Equivalents 26,566,097 Short Term Investments 91,974,215 Total Receivables, Net 43,980,097 Accounts Receivables - Trade, Net 40,379,873 Total Inventory 32,442,857 Prepaid Expenses 4,313,851 Other Current Assets, Total 4,357,796 Total Assets 375,788,742 Property/Plant/Equipment, Total – Net 124,777,408 Property/Plant/Equipment, Total - Gross Accumulated Depreciation, Total Goodwill, Net Intangibles, Net 18,980,799 Long Term Investments 20,026,174 Note Receivable - Long Term Other Long Term Assets, Total 8,369,448
  • 64.
    57 Other Assets, Total TotalCurrent Liabilities 73,046,405 Accounts Payable 11,688,180 Payable/Accrued Accrued Expenses 21,703,839 Notes Payable/Short Term Debt 15,856,252 Current Port. of LT Debt/Capital Leases 754,610 Other Current liabilities, Total 23,043,524 Total Liabilities 107,846,602 Total Long Term Debt 3,015,611 Long Term Debt 997,764 Capital Lease Obligations 2,017,847 Deferred Income Tax 18,362,110 Minority Interest 8,194,048 Other Liabilities, Total 5,228,428 Total Equity 267,942,140 Redeemable Preferred Stock, Total Preferred Stock - Non Redeemable, Net Common Stock, Total 897,514 Additional Paid-In Capital 4,403,893 Retained Earnings (Accumulated Deficit) 267,024,912
  • 65.
    Treasury Stock -Common ESOP Debt Guarantee Unrealized Gain (Loss) 3,656,025 Other Equity, Total -8,040,204 Total Liabilities & Shareholders' Equity 375,788,742 Total Common Shares Outstanding 6,792.67 Total Preferred Shares Outstanding 57
  • 66.
    58 BALANCE SHEET OFJINDAL STELL AND POWER LTD : Total Current Assets 212,793,019 Cash and Short Term Investments 120,240,975 Cash Cash & Equivalents 32,675,040 Short Term Investments 87,565,935 Total Receivables, Net 47,100,626 Accounts Receivables - Trade, Net 42,369,691 Total Inventory 37,801,695 Prepaid Expenses 2,916,308 Other Current Assets, Total 4,733,415 Total Assets 410,420,718 Property/Plant/Equipment, Total - Net 143,029,384 Property/Plant/Equipment, Total - Gross Accumulated Depreciation, Total Goodwill, Net Intangibles, Net 20,753,637 Long Term Investments 23,177,896 Note Receivable - Long Term Other Long Term Assets, Total 10,666,782
  • 67.
    59 Other Assets, Total TotalCurrent Liabilities 81,871,964 Accounts Payable 13,865,671 Payable/Accrued Accrued Expenses 25,182,366 Notes Payable/Short Term Debt 15,117,140 Current Port. of LT Debt/Capital Leases 1,271,589 Other Current liabilities, Total 26,435,198 Total Liabilities 122,089,510 Total Long Term Debt 2,680,837 Long Term Debt 514,096 Capital Lease Obligations 2,166,741 Deferred Income Tax 22,487,982 Minority Interest 8,434,910 Other Liabilities, Total 6,613,817 Total Equity 288,331,208 Redeemable Preferred Stock, Total Preferred Stock - Non Redeemable, Net Common Stock, Total 897,514 Additional Paid-In Capital 4,403,893 Retained Earnings (Accumulated Deficit) 284,826,992
  • 68.
    60 Treasury Stock -Common ESOP Debt Guarantee Unrealized Gain (Loss) 4,151,967 Other Equity, Total -5,949,158 Total Liabilities & Shareholders' Equity 410,420,718 Total Common Shares Outstanding 6,792.67 Total Preferred Shares Outstanding