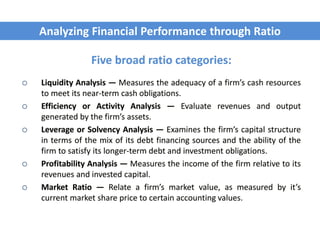
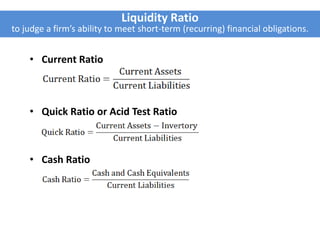
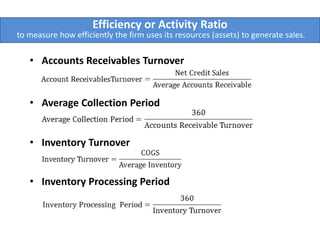
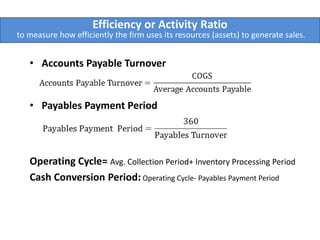
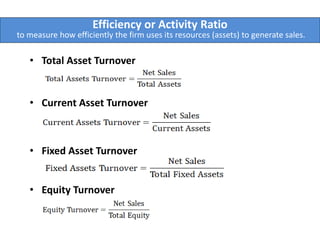
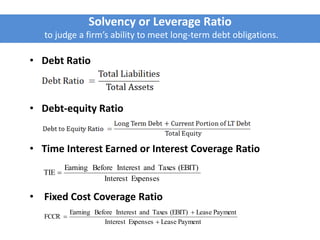
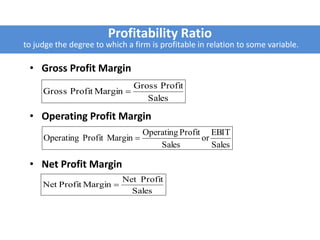
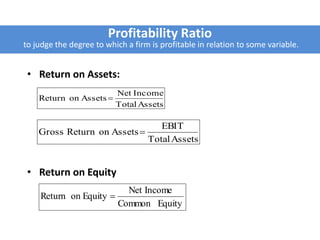
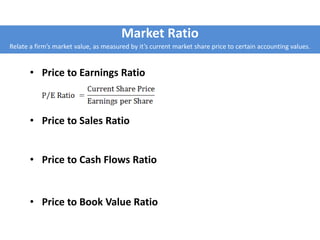
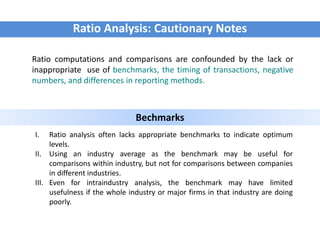
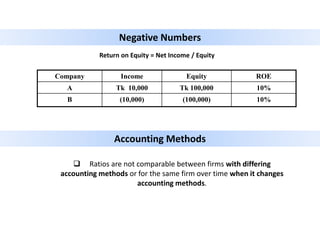
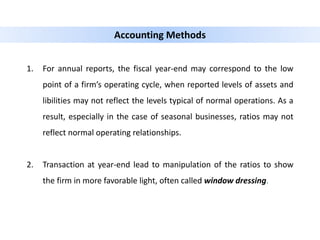
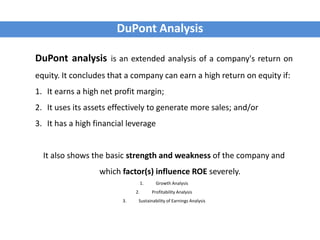
Financial
Analysis
Prepared By:
Md. Kamruzzaman Didar
Senior Lecturer of Finance
Department of Business Administration
How to measure the financial performance of a company
through financial statements???
1. Ratio Analysis
2. Common size Analysis
3. Trend Analysis-give an picture how financial statements
items are changes over time.
4. DuPont Analysis
1. Growth Analysis
2. Profitability Analysis
3. Sustainability of Earnings Analysis
• Ratios are intended to provide meaningful relationship among
the individual values in the financial statements.
• Financial ratios, calculated from the information of financial
statements, are used to analyze a firm’s past financial
performance.
• Financial ratios are used to compare the risk and return of
different firms in order to help investors and creditors make
intelligent investment and credit decisions.
• Ratios are meaningful, if we compare with- the aggregrate
economy, the industry or industry avegare, its major
competitiors/ peers (cross-sectional analysis) and its past
performance (Time-series analysis).
Analyzing Financial Performance through Ratio
 Such decisions range from an evaluation of changes in performance over time for
a particular investment to a comparison among all firms within a single industry
or peer firm (Matched firm) at a specific point in time.
Purpose and Use of Ratio Analysis
• Ratios can be used to compare the risk and return relationships
of different firms of different sizes.
• Ratios can provide a profile of a firm, its economic
characteristics and competitive strategies, and its unique
operating, financial and investment characteristics.
• Given the differences between industries and of the effect of
varying capital structures, and differences in accounting &
reporting methods, changes (trends) in a ratio and variability
over time may be more informative than the level at any point
in time.
Analyzing Financial Performance through Ratio
Five broad ratio categories:
 Liquidity Analysis — Measures the adequacy of a firm’s cash resources
to meet its near-term cash obligations.
 Efficiency or Activity Analysis — Evaluate revenues and output
generated by the firm’s assets.
 Leverage or Solvency Analysis — Examines the firm’s capital structure
in terms of the mix of its debt financing sources and the ability of the
firm to satisfy its longer-term debt and investment obligations.
 Profitability Analysis — Measures the income of the firm relative to its
revenues and invested capital.
 Market Ratio — Relate a firm’s market value, as measured by it’s
current market share price to certain accounting values.
Analyzing Financial Performance through Ratio
Liquidity Ratio
to judge a firm’s ability to meet short-term (recurring) financial obligations.
• Current Ratio
• Quick Ratio or Acid Test Ratio
• Cash Ratio
Efficiency or Activity Ratio
to measure how efficiently the firm uses its resources (assets) to generate sales.
• Accounts Receivables Turnover
• Average Collection Period
• Inventory Turnover
• Inventory Processing Period
Efficiency or Activity Ratio
to measure how efficiently the firm uses its resources (assets) to generate sales.
• Accounts Payable Turnover
• Payables Payment Period
Operating Cycle= Avg. Collection Period+ Inventory Processing Period
Cash Conversion Period: Operating Cycle- Payables Payment Period
Efficiency or Activity Ratio
to measure how efficiently the firm uses its resources (assets) to generate sales.
• Total Asset Turnover
• Current Asset Turnover
• Fixed Asset Turnover
• Equity Turnover
Solvency or Leverage Ratio
to judge a firm’s ability to meet long-term debt obligations.
• Debt Ratio
• Debt-equity Ratio
• Time Interest Earned or Interest Coverage Ratio
• Fixed Cost Coverage Ratio
ExpensesInterest
(EBIT)TaxesandInterestBeforeEarning
TIE 
PaymentLeaseExpensesInterest
PaymentLease(EBIT)TaxesandInterestBeforeEarning
FCCR



Profitability Ratio
to judge the degree to which a firm is profitable in relation to some variable.
• Gross Profit Margin
• Operating Profit Margin
• Net Profit Margin
Sales
EBIT
or
Sales
ProfitOperating
MarginProfitOperating 
Sales
ProfitGross
MarginProfitGross 
Sales
ProfitNet
MarginProfitNet 
• Return on Assets:
• Return on Equity
AssetsTotal
IncomeNet
AssetsonReturn 
AssetsTotal
EBIT
AssetsonReturnGross 
EquityCommon
IncomeNet
EquityonReturn 
Profitability Ratio
to judge the degree to which a firm is profitable in relation to some variable.
Market Ratio
Relate a firm’s market value, as measured by it’s current market share price to certain accounting values.
• Price to Earnings Ratio
• Price to Sales Ratio
• Price to Cash Flows Ratio
• Price to Book Value Ratio
Ratio Analysis: Cautionary Notes
Ratio computations and comparisons are confounded by the lack or
inappropriate use of benchmarks, the timing of transactions, negative
numbers, and differences in reporting methods.
Bechmarks
I. Ratio analysis often lacks appropriate benchmarks to indicate optimum
levels.
II. Using an industry average as the benchmark may be useful for
comparisons within industry, but not for comparisons between companies
in different industries.
III. Even for intraindustry analysis, the benchmark may have limited
usefulness if the whole industry or major firms in that industry are doing
poorly.
Return on Equity = Net Income / Equity
Company Income Equity ROE
A Tk 10,000 Tk 100,000 10%
B (10,000) (100,000) 10%
Negative Numbers
Accounting Methods
 Ratios are not comparable between firms with differing
accounting methods or for the same firm over time when it changes
accounting methods.
1. For annual reports, the fiscal year-end may correspond to the low
point of a firm’s operating cycle, when reported levels of assets and
libilities may not reflect the levels typical of normal operations. As a
result, especially in the case of seasonal businesses, ratios may not
reflect normal operating relationships.
2. Transaction at year-end lead to manipulation of the ratios to show
the firm in more favorable light, often called window dressing.
Accounting Methods
DuPont Analysis
DuPont analysis is an extended analysis of a company's return on
equity. It concludes that a company can earn a high return on equity if:
1. It earns a high net profit margin;
2. It uses its assets effectively to generate more sales; and/or
3. It has a high financial leverage
It also shows the basic strength and weakness of the company and
which factor(s) influence ROE severely.
1. Growth Analysis
2. Profitability Analysis
3. Sustainability of Earnings Analysis
ROE Decomposition
3 Factors ROE Decomposition :
NPM
Ability to cut
cost and
maximize profit
Ability to utilize
TA to generate
sales
Ability of utilize
financial
leverage or debt
TAT EM
ROE = EBIT Margin × Interest Burden × Tax Burden × Asset Turnover
× Financial Leverage
ROE Decomposition
5 Factors ROE Decomposition :
DuPont equation provides a broader picture of the return the company is
earning on its equity. It tells where a company's strength lies and where
there is a room for improvement.
DuPont equation could be further extended by breaking up net profit
margin into EBIT margin, tax burden and interest burden. This five-factor
analysis provides an even deeper insight.
A common-size financial statement is simply one that is created to display line items on
a statement as a percentage of one selected or common figure. Creating common-size
financial statements makes it easier to analyze a company over time and compare it
with peers. Using common-size financial statements helps investors spot trends that a
raw financial statement may not uncover.
All three of the primary financial statements can be put into a Common-size format.
Common-Size Analysis Of Financial Statements
Advantages of Common Size statement:
1. It reveals Sources and Application of Funds in a nutshell which help in
taking decision.
2. If common size statements of 2 or more years are compared it indicate
the changing proportion of various components of Assets, Liabilities,
Cost, Net Sale & Profit.
3. When Inter Firm Comparison is made with the help of Common size
statement it helps in doing corporate evaluation and Ranking.
Linde Bangladesh Ltd.
Statement of Comprehensive Income
For the year ended December 2011, 2012 & 2013
Particulars 2011 % 2012 %
Revenue 3,199.38 100% 3,729.75 100%
Cost of sales -1,857.53 -58% -2,279.81 -61%
Gross profit 1,341.84 42% 1,449.95 39%
Operating expenses -520.19 -16% -582.42 -16%
Profit from operations 821.66 26% 867.53 23%
Gain on sale of lease land - -
Gain on disposal of PPE 17.6 1% 2.03 0%
Interest income, net 63.95 2% 70.58 2%
Profit before taxation 903.21 28% 940.14 25%
Taxation -235.19 -7% -258.62 -7%
Net profit for the year 668.02 21% 681.52 18%
Common-Size Income Statement of Linde BD
Common-Size Financial Position of Linde BD
Linde Bangladesh Ltd.
Statement of Financial Position
As at December 2011, 2012 & 2013
Particulars 2011 %
Assets
Non-current assets:
Property, plant and equipment 1,044 37.3%
Intangible assets 5 0.2%
Investment in subsidiary 0 0.0%
Total non-current/ Fixed assets 1,048 37.4%
Current assets:
Inventories 361 12.9%
Trade debtors 200 7.1%
Advances, deposits and prepayments 118 4.2%
Cash and cash equivalents 1,074 38.3%
Total current assets 1,754 62.6%
Total assets 2,802 100%
Equity and Liabilities
Shareholders’ equity:
Share capital 152 7.6%
Revaluation reserve 20 1.0%
General reserve 1,823 91.4%
Total equity 1,995 100%
Non-current liabilities:
Finance lease 0 0.0%
Employee benefits 114 4.1%
Deferred tax liabilities 65 2.3%
Other non-current liabilities 166 5.9%
Total non-current liabilities 345 12.3%
Current liabilities:
Current portion of Finance Lease 0 0.0%
Trade creditors 59 2.1%
Expense creditors and accruals 207 7.4%
Sundry creditors 55 2.0%
Provision for taxation (net of advance tax payment) 140 5.0%
Total current liabilities 461 16.5%
Total liabilities 806 28.8%
Total equity and liabilities 2,802 100%

Chapter 05(a) financial analysis-ratio and other analysis

  • 1.
    Financial Analysis Prepared By: Md. KamruzzamanDidar Senior Lecturer of Finance Department of Business Administration
  • 2.
    How to measurethe financial performance of a company through financial statements??? 1. Ratio Analysis 2. Common size Analysis 3. Trend Analysis-give an picture how financial statements items are changes over time. 4. DuPont Analysis 1. Growth Analysis 2. Profitability Analysis 3. Sustainability of Earnings Analysis
  • 3.
    • Ratios areintended to provide meaningful relationship among the individual values in the financial statements. • Financial ratios, calculated from the information of financial statements, are used to analyze a firm’s past financial performance. • Financial ratios are used to compare the risk and return of different firms in order to help investors and creditors make intelligent investment and credit decisions. • Ratios are meaningful, if we compare with- the aggregrate economy, the industry or industry avegare, its major competitiors/ peers (cross-sectional analysis) and its past performance (Time-series analysis). Analyzing Financial Performance through Ratio
  • 4.
     Such decisionsrange from an evaluation of changes in performance over time for a particular investment to a comparison among all firms within a single industry or peer firm (Matched firm) at a specific point in time. Purpose and Use of Ratio Analysis • Ratios can be used to compare the risk and return relationships of different firms of different sizes. • Ratios can provide a profile of a firm, its economic characteristics and competitive strategies, and its unique operating, financial and investment characteristics. • Given the differences between industries and of the effect of varying capital structures, and differences in accounting & reporting methods, changes (trends) in a ratio and variability over time may be more informative than the level at any point in time. Analyzing Financial Performance through Ratio
  • 5.
    Five broad ratiocategories:  Liquidity Analysis — Measures the adequacy of a firm’s cash resources to meet its near-term cash obligations.  Efficiency or Activity Analysis — Evaluate revenues and output generated by the firm’s assets.  Leverage or Solvency Analysis — Examines the firm’s capital structure in terms of the mix of its debt financing sources and the ability of the firm to satisfy its longer-term debt and investment obligations.  Profitability Analysis — Measures the income of the firm relative to its revenues and invested capital.  Market Ratio — Relate a firm’s market value, as measured by it’s current market share price to certain accounting values. Analyzing Financial Performance through Ratio
  • 6.
    Liquidity Ratio to judgea firm’s ability to meet short-term (recurring) financial obligations. • Current Ratio • Quick Ratio or Acid Test Ratio • Cash Ratio
  • 7.
    Efficiency or ActivityRatio to measure how efficiently the firm uses its resources (assets) to generate sales. • Accounts Receivables Turnover • Average Collection Period • Inventory Turnover • Inventory Processing Period
  • 8.
    Efficiency or ActivityRatio to measure how efficiently the firm uses its resources (assets) to generate sales. • Accounts Payable Turnover • Payables Payment Period Operating Cycle= Avg. Collection Period+ Inventory Processing Period Cash Conversion Period: Operating Cycle- Payables Payment Period
  • 9.
    Efficiency or ActivityRatio to measure how efficiently the firm uses its resources (assets) to generate sales. • Total Asset Turnover • Current Asset Turnover • Fixed Asset Turnover • Equity Turnover
  • 10.
    Solvency or LeverageRatio to judge a firm’s ability to meet long-term debt obligations. • Debt Ratio • Debt-equity Ratio • Time Interest Earned or Interest Coverage Ratio • Fixed Cost Coverage Ratio ExpensesInterest (EBIT)TaxesandInterestBeforeEarning TIE  PaymentLeaseExpensesInterest PaymentLease(EBIT)TaxesandInterestBeforeEarning FCCR   
  • 11.
    Profitability Ratio to judgethe degree to which a firm is profitable in relation to some variable. • Gross Profit Margin • Operating Profit Margin • Net Profit Margin Sales EBIT or Sales ProfitOperating MarginProfitOperating  Sales ProfitGross MarginProfitGross  Sales ProfitNet MarginProfitNet 
  • 12.
    • Return onAssets: • Return on Equity AssetsTotal IncomeNet AssetsonReturn  AssetsTotal EBIT AssetsonReturnGross  EquityCommon IncomeNet EquityonReturn  Profitability Ratio to judge the degree to which a firm is profitable in relation to some variable.
  • 13.
    Market Ratio Relate afirm’s market value, as measured by it’s current market share price to certain accounting values. • Price to Earnings Ratio • Price to Sales Ratio • Price to Cash Flows Ratio • Price to Book Value Ratio
  • 14.
    Ratio Analysis: CautionaryNotes Ratio computations and comparisons are confounded by the lack or inappropriate use of benchmarks, the timing of transactions, negative numbers, and differences in reporting methods. Bechmarks I. Ratio analysis often lacks appropriate benchmarks to indicate optimum levels. II. Using an industry average as the benchmark may be useful for comparisons within industry, but not for comparisons between companies in different industries. III. Even for intraindustry analysis, the benchmark may have limited usefulness if the whole industry or major firms in that industry are doing poorly.
  • 15.
    Return on Equity= Net Income / Equity Company Income Equity ROE A Tk 10,000 Tk 100,000 10% B (10,000) (100,000) 10% Negative Numbers Accounting Methods  Ratios are not comparable between firms with differing accounting methods or for the same firm over time when it changes accounting methods.
  • 16.
    1. For annualreports, the fiscal year-end may correspond to the low point of a firm’s operating cycle, when reported levels of assets and libilities may not reflect the levels typical of normal operations. As a result, especially in the case of seasonal businesses, ratios may not reflect normal operating relationships. 2. Transaction at year-end lead to manipulation of the ratios to show the firm in more favorable light, often called window dressing. Accounting Methods
  • 17.
    DuPont Analysis DuPont analysisis an extended analysis of a company's return on equity. It concludes that a company can earn a high return on equity if: 1. It earns a high net profit margin; 2. It uses its assets effectively to generate more sales; and/or 3. It has a high financial leverage It also shows the basic strength and weakness of the company and which factor(s) influence ROE severely. 1. Growth Analysis 2. Profitability Analysis 3. Sustainability of Earnings Analysis
  • 18.
    ROE Decomposition 3 FactorsROE Decomposition : NPM Ability to cut cost and maximize profit Ability to utilize TA to generate sales Ability of utilize financial leverage or debt TAT EM
  • 19.
    ROE = EBITMargin × Interest Burden × Tax Burden × Asset Turnover × Financial Leverage ROE Decomposition 5 Factors ROE Decomposition : DuPont equation provides a broader picture of the return the company is earning on its equity. It tells where a company's strength lies and where there is a room for improvement. DuPont equation could be further extended by breaking up net profit margin into EBIT margin, tax burden and interest burden. This five-factor analysis provides an even deeper insight.
  • 20.
    A common-size financialstatement is simply one that is created to display line items on a statement as a percentage of one selected or common figure. Creating common-size financial statements makes it easier to analyze a company over time and compare it with peers. Using common-size financial statements helps investors spot trends that a raw financial statement may not uncover. All three of the primary financial statements can be put into a Common-size format. Common-Size Analysis Of Financial Statements Advantages of Common Size statement: 1. It reveals Sources and Application of Funds in a nutshell which help in taking decision. 2. If common size statements of 2 or more years are compared it indicate the changing proportion of various components of Assets, Liabilities, Cost, Net Sale & Profit. 3. When Inter Firm Comparison is made with the help of Common size statement it helps in doing corporate evaluation and Ranking.
  • 21.
    Linde Bangladesh Ltd. Statementof Comprehensive Income For the year ended December 2011, 2012 & 2013 Particulars 2011 % 2012 % Revenue 3,199.38 100% 3,729.75 100% Cost of sales -1,857.53 -58% -2,279.81 -61% Gross profit 1,341.84 42% 1,449.95 39% Operating expenses -520.19 -16% -582.42 -16% Profit from operations 821.66 26% 867.53 23% Gain on sale of lease land - - Gain on disposal of PPE 17.6 1% 2.03 0% Interest income, net 63.95 2% 70.58 2% Profit before taxation 903.21 28% 940.14 25% Taxation -235.19 -7% -258.62 -7% Net profit for the year 668.02 21% 681.52 18% Common-Size Income Statement of Linde BD
  • 22.
    Common-Size Financial Positionof Linde BD Linde Bangladesh Ltd. Statement of Financial Position As at December 2011, 2012 & 2013 Particulars 2011 % Assets Non-current assets: Property, plant and equipment 1,044 37.3% Intangible assets 5 0.2% Investment in subsidiary 0 0.0% Total non-current/ Fixed assets 1,048 37.4% Current assets: Inventories 361 12.9% Trade debtors 200 7.1% Advances, deposits and prepayments 118 4.2% Cash and cash equivalents 1,074 38.3% Total current assets 1,754 62.6% Total assets 2,802 100% Equity and Liabilities Shareholders’ equity: Share capital 152 7.6% Revaluation reserve 20 1.0% General reserve 1,823 91.4% Total equity 1,995 100% Non-current liabilities: Finance lease 0 0.0% Employee benefits 114 4.1% Deferred tax liabilities 65 2.3% Other non-current liabilities 166 5.9% Total non-current liabilities 345 12.3% Current liabilities: Current portion of Finance Lease 0 0.0% Trade creditors 59 2.1% Expense creditors and accruals 207 7.4% Sundry creditors 55 2.0% Provision for taxation (net of advance tax payment) 140 5.0% Total current liabilities 461 16.5% Total liabilities 806 28.8% Total equity and liabilities 2,802 100%