Download to read offline
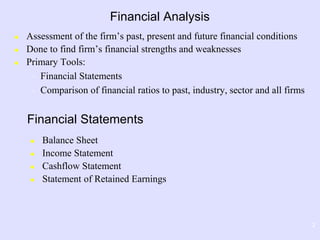
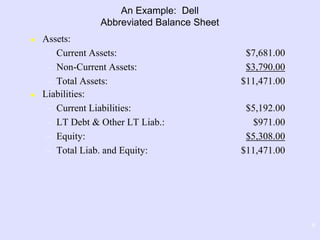
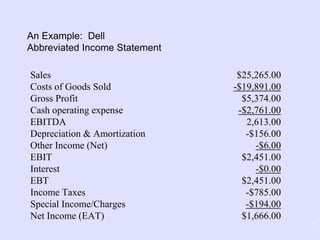
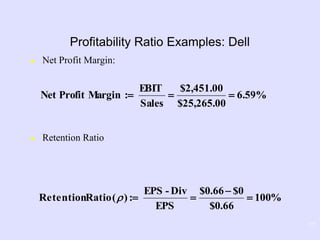
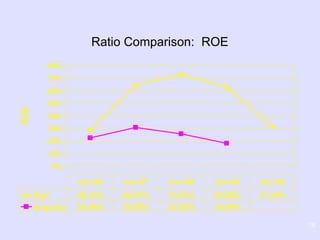
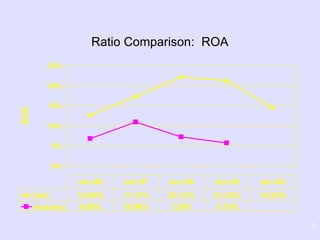
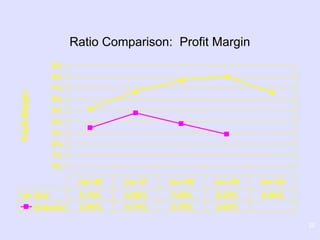
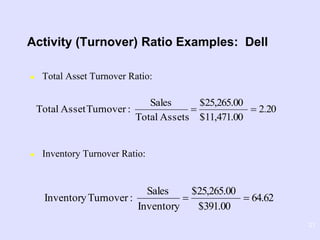


This document provides an overview of financial analysis and ratio analysis. It defines key financial statements, ratios, and financial analysis tools. It also provides examples of calculating ratios for Dell and comparing them to industry averages. The document aims to explain how ratios can be used to evaluate a firm's financial performance, strengths, and weaknesses over time and relative to peers.


