Download to read offline
![BUILDING SCIENCE 2 [ BLD 61303 / ARC 3413 ]
PROJECT 2: INTEGRATION PROJECT
SENTUL COMMUNITY LIBRARY
REPORT & CALCULATION
PRESTON LIEW RU PING
0313822
TUTOR: MR. SIVA](https://image.slidesharecdn.com/prestonbsciproj2-160716153422/85/Preston-bsci-proj-2-1-320.jpg)
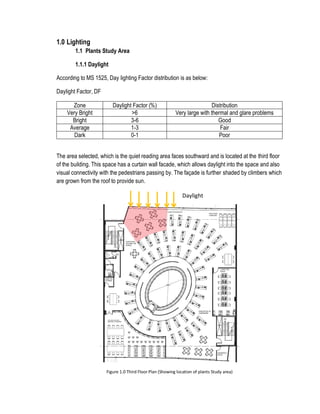
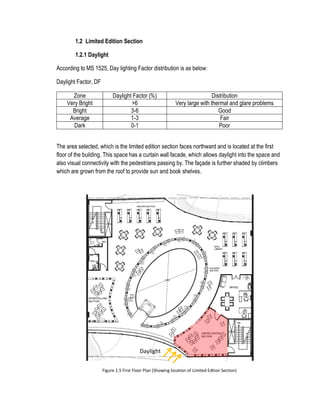
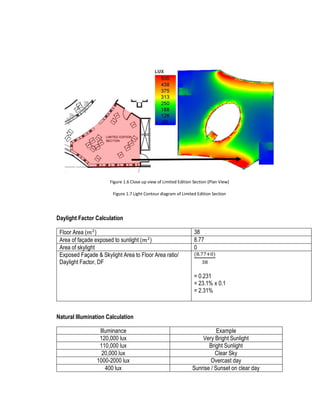
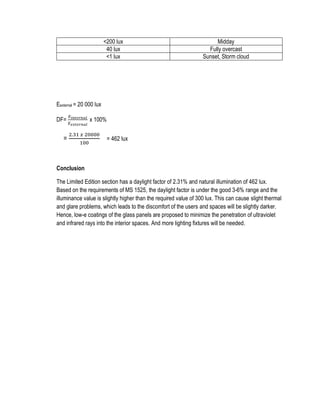
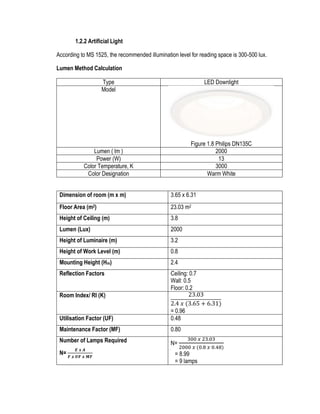
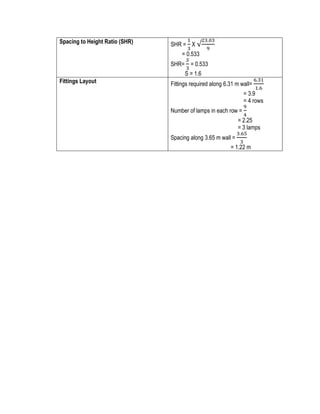
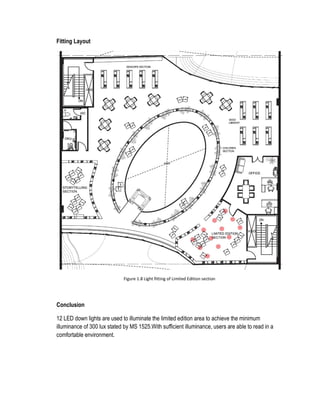
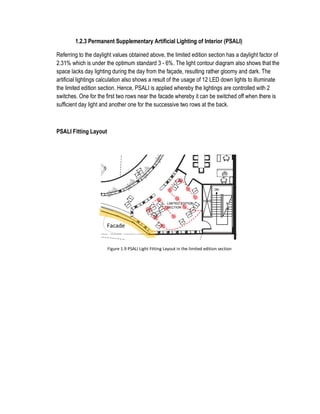
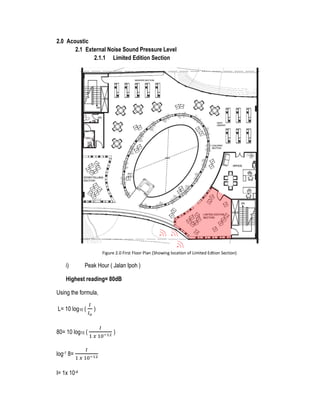

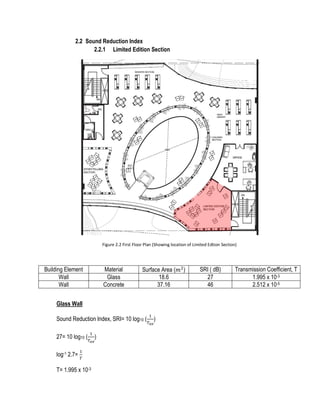
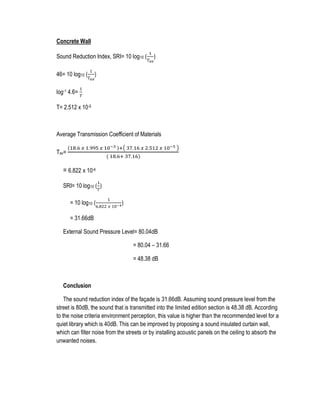
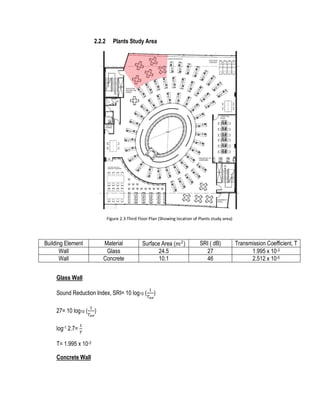
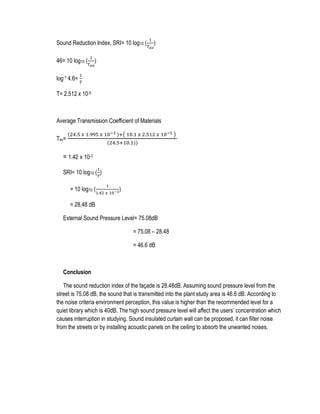

The document provides calculations to analyze lighting and acoustic conditions for two areas - the plants study area and limited edition section - of the Sentul Community Library. For lighting, it calculates daylight factor and artificial lighting requirements for both spaces based on Malaysian standards. It determines that the plants study area has good natural light but may experience glare, while the limited edition section lacks sufficient daylight. For acoustics, it measures external noise levels for the limited edition section during peak and non-peak hours.


