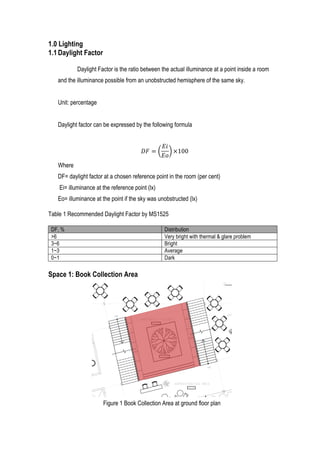
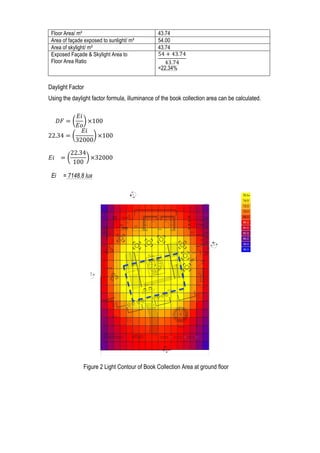
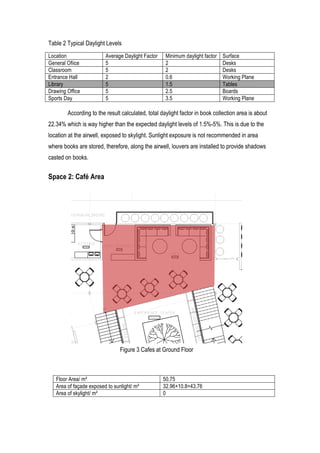
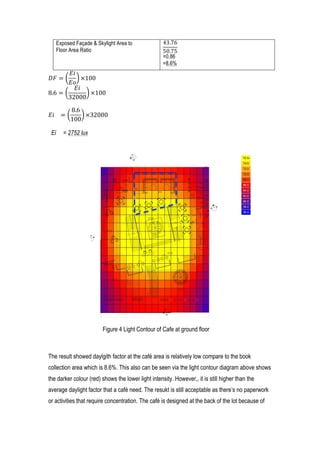
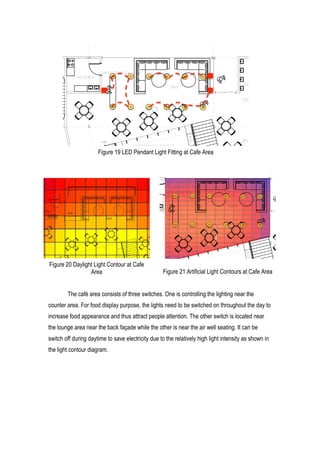
1) The document discusses daylight factor calculations for two spaces - a book collection area and cafe area. For the book collection area, the daylight factor is 22.34% which is higher than recommended due to its location near a skylight. For the cafe, the daylight factor is 8.6%.
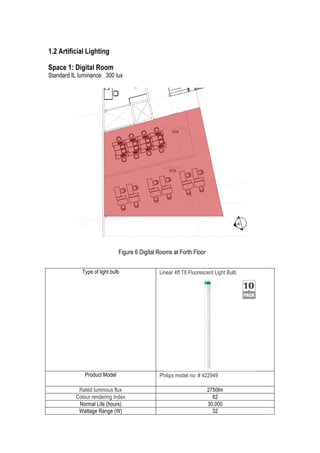
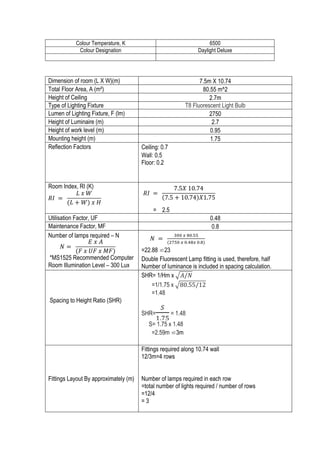
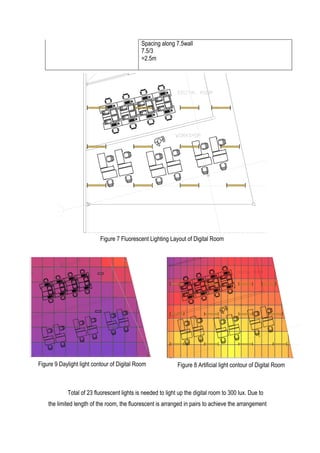
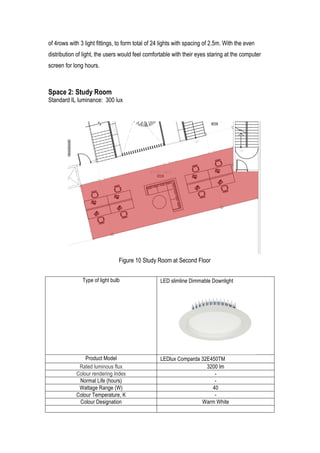
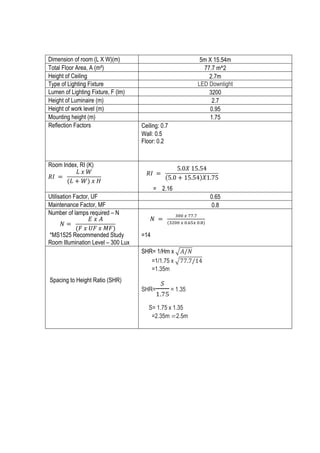
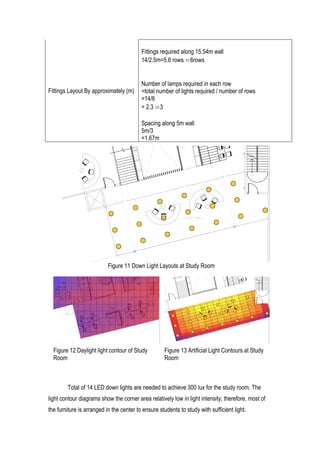
2) Artificial lighting calculations are provided for two spaces - a digital room and study room. For the digital room, 23 fluorescent lights are needed in a 3x4 layout. For the study room, 14 LED downlights are needed in a 6 row layout.
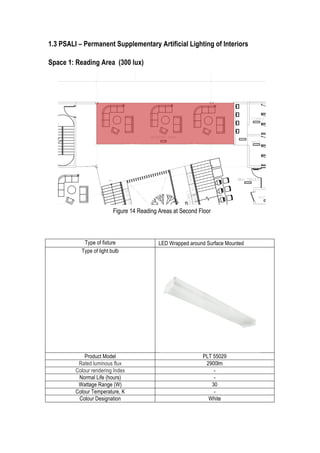
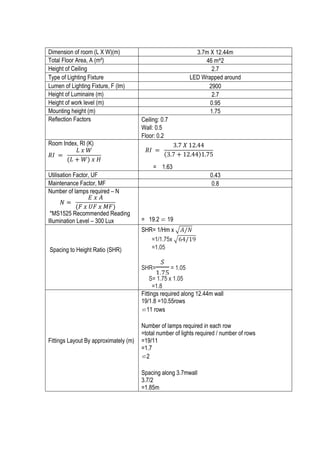
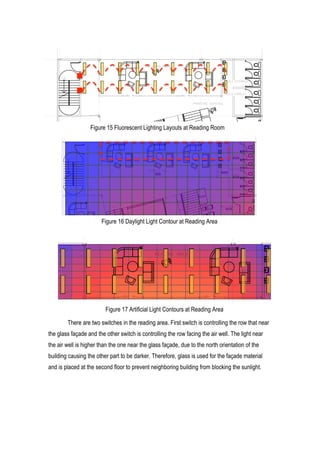
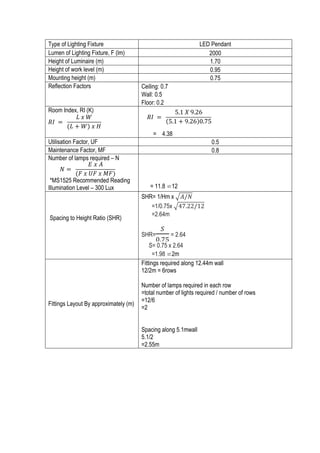
3) Permanent supplementary lighting calculations are shown for a reading area and cafe. The reading area needs 19 LED wraparound lights in an