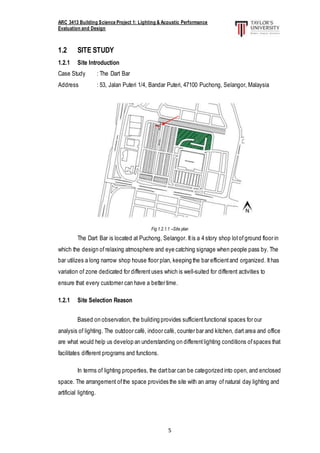
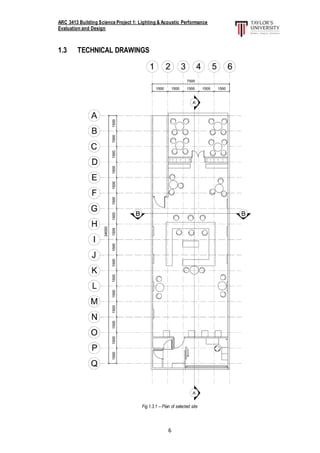
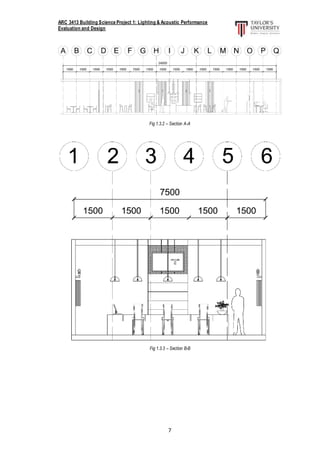
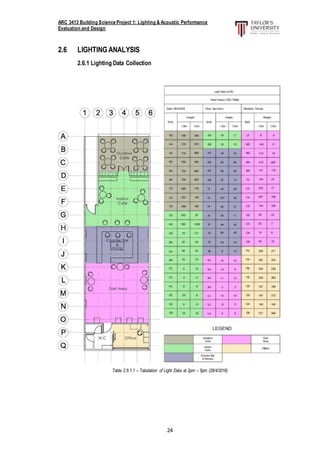
ARC 3413 Building Science Project 1: Lighting & Acoustic Performance
Evaluation and Design
2
TABLE OF CONTENT
1.0 Abstract
1.1 Aim & Objectives
1.2 Site Study
1.2.1 Site Introduction
1.2.2 Site Selection Reason
1.3 Technical Drawing
2.0 Lighting Performance Evaluation
2.1 Literature Review
2.1.1 Light in Architecture
2.1.2 Natural Day Lighting & Artificial Electrical Lighting
2.1.3 Daylight Factor
2.1.4 Lumen Method
2.2 Lighting Precedent Studies
2.3 Research Methodology
2.3.1 Lighting Measuring Equipment
2.3.2 Methodology
2.3.3 Data Collection Method
2.4 Case Study
2.4.1 Building Orientation
2.4.2 Neighbourhood Context
2.4.3 Surrounding Issue
2.5 Existing Lighting Condition
2.5.1 Daylight Factor
2.5.2 Existing Light Fixture
2.6 Lighting Analysis
2.6.1 Lighting Data Collection
2.6.2 Lighting Contour Diagram
2.6.3 Material Tabulation
2.7 Lighting Calculation Analysis
2.7.1 Zone A Calculation
2.7.2 Zone B Calculation
2.7.3 Zone C Calculation
2.7.4 Zone D Calculation
2.7.5 Zone E Calculation
2.8 Evaluation and Conclusion
ARC 3413 Building Science Project 1: Lighting & Acoustic Performance
Evaluation and Design
3
1.0 ABSTRACT
This report contains the details of the study conducted at The Dart Bar in regards of
lighting performances. This report contains the lighting performance evaluation and design. In
architecture, lighting design play significantroles in creating the most optimum environment for
its users. The qualities of a space can only truly be appreciated when it is imaginatively lit. The
excellentunification of the lighting of buildings and the lighting ofits activities is what unifies the
building and makes itinterpretable to its users to its bestcapabilities.Lightning play the important
roles in the making of the atmosphere of a space, it is very important to take into account the
many considerations required. Thus, through studies based on standards and requirements for
lighting should be included in the design process.
This project is intended to be completed in a group of 7 students to evaluate the
environment of choosing in terms of lighting performance. A case study was selected as well.
Included are the technical data such as formulas, equations and calculations that estimate
luminance levels forlight. Allorthographic drawings and diagrams were made with data collected
from measurements done on site. The analysis diagrams were made with Autodesk Revit®, a
BIM software. A list of figures and tables used as well as references are provided atthe end of
the reportto ease with navigation.
ARC 3413 Building Science Project 1: Lighting & Acoustic Performance
Evaluation and Design
4
1.1 AIM & OBJECTIVES
This reportcontains the details ofthe study conducted atThe Dart Bar in regards oflighting
performances. This reportcontains the lighting analysis which aims to:
 To understand the day-lighting, lighting characteristics.
 To understand the lighting requirementin a suggested place.
 To determine the characteristics and function ofday-lighting, artificial lighting, within the
intended space.
 To critically reportand analyse the space and suggestremedies to improvisethe lighting
qualities within the space.
This projectalso aims to provide abetter understanding on the relationship betweenthe type
of materials that are employed in terms of building materials as well as internal furnishings and
finishes as well as their impacts on lighting conditions in the building based on the building’s
functions. Understanding the volume and area ofeach functional space also helps indetermining
the lighting requirements based on lighting inadequacy that is reflected in the data collection.
In terms of lighting, specifications of luminaries, height of each type of light as well as the
existence of fenestrations will help to understand the lighting conditions within each space.
Backed up with precedentstudies,drawing comparisonwith our site study,our precedentstudies
will aid in determining the different types oflighting.
Backed up with precedentstudies, drawing comparison with our site study, our precedent
studies will aid in determining the different types of lighting.
ARC 3413 Building Science Project 1: Lighting & Acoustic Performance
Evaluation and Design
5
1.2 SITE STUDY
1.2.1 Site Introduction
Case Study : The Dart Bar
Address : 53, Jalan Puteri 1/4, Bandar Puteri, 47100 Puchong, Selangor, Malaysia
Fig 1.2.1.1 –Site plan
The Dart Bar is located at Puchong, Selangor. Itis a 4 story shop lotof ground floor in
which the design of relaxing atmosphere and eye catching signage when people pass by. The
bar utilizes a long narrow shop house floor plan, keeping the bar efficientand organized. Ithas
variation of zone dedicated for different uses which is well-suited for different activities to
ensure that every customer can have a better time.
1.2.1 Site Selection Reason
Based on observation, the building provides sufficientfunctional spaces for our
analysis of lighting. The outdoor café, indoor café, counter bar and kitchen, dart area and office
are what would help us develop an understanding on differentlighting conditions ofspaces that
facilitates different programs and functions.
In terms of lighting properties, the dartbar can be categorized into open, and enclosed
space. The arrangement ofthe space provides the site with an array of natural day lighting and
artificial lighting.
ARC 3413 Building Science Project 1: Lighting & Acoustic Performance
Evaluation and Design
6
1.3 TECHNICAL DRAWINGS
Fig 1.3.1 – Plan of selected site
ARC 3413 Building Science Project 1: Lighting & Acoustic Performance
Evaluation and Design
7
Fig 1.3.2 – Section A-A
Fig 1.3.3 – Section B-B
ARC 3413 Building Science Project 1: Lighting & Acoustic Performance
Evaluation and Design
8
2.0 LIGHTING PERFORMANCE EVALUATION
2.1 LIGHTINGLITERATURE REVIEW
2.1.1 Light in Architecture
Light is an important aspect that affects architecture. Light controls people’s behaviour and
emotions. The origin of light is natural light, which is also known as daylight. Light helps us
redefine the relationships ofpeople with the environmentand with themselves. Itis divided into
natural light and artificial light. The dynamic daylightand the controlled artificial lighting are able
to affect not only distinct physical measurable conditions in a space, but also to instigate and
provoke differentvisual experiences and moods
2.1.2 Natural Day lighting & Artificial Electrical Lighting
Natural light is one of the mostimportant elements in architecture, helping to transform spaces
and save energy. Natural light has always been important for architects. In a way, architects
sculptbuildings in order thatthe light can play off their different surfaces. If done well, space and
light can evoke positive emotional responses in people. However, itis almost impossible to go
on without electrical lighting taking into consideration that a building should function in both day
and night. Day lighting alone is not enough for some certain building typologies and functions
such as museums and galleries. It is important to understand how to balance in designing with
natural lighting and artificial lighting to achieve the bestperforming building.
2.1.3 Daylight Factor
Daylight Factor is a ratio that represents the amount of illumination available indoors
relative to the illumination presentoutdoors at the same time under overcastskies. It is used in
architecture to assess the internal natural lighting levels as perceived on the working plane or
surface, in order to determine if there is sufficient natural lighting for the occupants ofthe space
to carry out their normal duties. It is the ratio ofinternal light level to external lightlevel.
ARC 3413 Building Science Project 1: Lighting & Acoustic Performance
Evaluation and Design
9
Daylight Factor is defined as follows:
Where, Ei = illuminance due to daylightat a pointon the indoors working plane,
Eo = simultaneous outdoor illuminance on a horizontal plane from an unobstructed hemisphere
of overcastsky.
Table 2.1.3 - Daylight factors and distribution (Department of standards Malaysia, 2007)
2.1.4 Lumen Method
The Lumen Method is used to determine the number of lamps that should be installed
for a given area or room, which in this case, we already have the number of fixtures, therefore
we calculate the total illuminance of the space based on the number of fixtures and determine
whether or not that particular space has enough lighting fixture.
ARC 3413 Building Science Project 1: Lighting & Acoustic Performance
Evaluation and Design
10
The number of lamps is given by the formula:
Where, N = number oflamps required. E = illuminance level required (lux)
A = area at working plane height(m2)
F = average luminous flux from each lamp (lm)
UF = utilisation factor, an allowance for the light distribution of the luminaire and the room
surfaces.
MF = maintenance factor, an allowance for reduced lightoutputbecause of deteriorationand dirt.
Room Index, RI, is the ratio of room plan area to half the wall area between the working and
luminaire planes:
Where, L = length ofroom
W = width ofroom
Hm = mounting height, i.e. the vertical distance between the working plane and the luminaire
ARC 3413 Building Science Project 1: Lighting & Acoustic Performance
Evaluation and Design
11
2.2 LIGHTINGPRECEDENT STUDIES
Case Study: Offices of a Finish Research Unit
Place: Finland (Helsinki)
Building Type: Office Building
Contact: Eino Tetri (Helsinki University ofTechnology, Lightning Unit)
Photos of the Place:
A B C
D E F
G H
Fig 2.2.1 – Visuals of the office
ARC 3413 Building Science Project 1: Lighting & Acoustic Performance
Evaluation and Design
12
Fig 2.2.2 – Office plan
Average installed lighting power density is 13.86 W/m2. Ceiling height in each space varies
between 2.26m and 2.94m where the height of the luminares is 2.26m and height of the work
plane is 0.72m. Daylight are available in each office room. Exceptfor weekend, the rooms are
occupied between 7am and 5:30pm where cleaning is made in the afternoon.
ARC 3413 Building Science Project 1: Lighting & Acoustic Performance
Evaluation and Design
13
Luminaries Description & Geometry
Luminaire Type 1:
Figure 2.2.3 Photometry of the luminaire, Geometry of the luminaire, Luminaire ON, Luminaire OFF
Luminaire Type 2:
Figure 2.2.4 Photometry of Luminaire, Geometry of Luminaire, Luminaire ON, Luminaire OFF
Luminaire Type 3:
Figure 2.2.5 Photometry of Luminaire, Geometry of Luminaire, Luminaire ON, Luminaire OFF
ARC 3413 Building Science Project 1: Lighting & Acoustic Performance
Evaluation and Design
14
Measurements:
Calculation ofaverage illuminances on work planes at full power.
D E A C H G F
Eaverage(lx) 588 671 610 728 723 716 806
Uniformity 0.71 0.78 0.64 0.71 0.80 0.69 0.65
Illuminances on the work planes ofthe three rooms lowered by the use ofdimming control.
Room E:
Eaverage = 545 lx (80%), Uniformity = 0.7
Room A:
Eaverage = 448 lx (73%), Uniformity = 0.57
Room G:
Eaverage = 586 lx (80%), Uniformity = 0.77
Ratio ofaverage luminances ofwork planes,walls,ceiling and floorto desktop screenluminance
are given in Table 1.1
Room Work Plane Walls Ceiling Floor
E 0.4 0.9 1.5 0.35
E 1.3 1.84 3.3 0.77
A 0.54 0.65 1.52 0.36
A 1.1 1.6 3 0.72
Table 2.2.1 - Ratio of the average luminance to desktop screen luminance.
ARC 3413 Building Science Project 1: Lighting & Acoustic Performance
Evaluation and Design
15
Power Consumption in the Offices during One Day
Figure 2.2.6 - Profile of total power consumption of the locales during 7 days
Figure 2.2.7 - Sample of power consumption in the offices during the day
ARC 3413 Building Science Project 1: Lighting & Acoustic Performance
Evaluation and Design
16
2.3 RESEARCH METHODOLOGY
Illumination in the bar has been evaluated in 2 different times of the day (14:00 and 22:00).
Significant changes in the values can be observed atthe outside seats due to daylighting. In the
interior spaces, the amount of illumination on each down light, which is approximately 170cm
high from the ground,dartmachine has external L.E.Dand monitor affect the lighting ofthe space.
Figure 2.3.1 – Collecting data using Lux Meter
2.3.1 Lighting Measuring Equipment
Digital Lux Meter
Manufacturer LUTRONDigital LuxMeter
Model LX-101
Dimension 108x 73 x 23mm
SensorProbe : 82x 55x 7 mm
Lux MeterRanges 0 – 50,000Lux, 3 Ranges
SamplingTime 0.4 Second
OperatingTemp. 0 – 50 degreeCelsius
ARC 3413 Building Science Project 1: Lighting & Acoustic Performance
Evaluation and Design
17
2.3.2 Methodology
a) Preliminary study on the types ofspaces to choose a suitable enclosed area for the study of
acoustics.
b) Measure and produce the technical drawings such as floor plans, sections and elevation
digitally based on on-site measurements.
c) After standardizing the drawings, determine the grid line of1.5m x 1.5m
d) Delegate tasks among group members and clarify on the method oftaking readings and using
the tools and equipmentbefore data collection begins.
e) Collectdata based on the proper procedures.
f) Observe and record the existing external and internal light sources.
h) Compile and tabulate the data or reading.
h) Carry out calculation and analysis. Draw a conclusion or recommendations at the end of the
analysis.
It is used to capture the source ofnoise
such as mechanical devices,speakers,
and existing activities and also to record
the existing materials in the
environment.
It is used to determine the positions of
the sound level meter from the ground
level and also used to determine the
1.5m x 1.5m grid on the studying area.
ARC 3413 Building Science Project 1: Lighting & Acoustic Performance
Evaluation and Design
18
Figure 2.3.2.1 – Plan of site with zoning
ARC 3413 Building Science Project 1: Lighting & Acoustic Performance
Evaluation and Design
19
2.3.3 Data Collection Procedures
a) Draw grid lines of1.5m x 1.5m on the site floor plan to identify the position ofdata collecting.
b) Stand at the intersection pointofthe grid and hold the measuring device athip level and eye
level.
c) Stand firm and preventtalking while taking readings.
d) Specify the light source that might affect the readings, such as people shadow.
e) Repeatthe steps above for the restof the intersection points.
f) Conduct the study for peak hour (12pm) and non-peak hour (9pm) to analyze different
acoustics condition atdifferent hour.
Figure 2.3.3.1 – Using measuring tape as a guideline for 1.5m measuring tape.
ARC 3413 Building Science Project 1: Lighting & Acoustic Performance
Evaluation and Design
20
2.4 CASE STUDY
2.4.1 Building Orientation
Figure 2.4.1.1 –Site Location
Figure 2.4.1.2 –Entrance of the Dart Bar
The main entrance ofthe building situated facing to east. The building entrance receives
the highest amount of morning sunlight. The dart bar at the ground floor, opposite shop lots
blocking mostofthe directsunlightexpose into indoor café.
ARC 3413 Building Science Project 1: Lighting & Acoustic Performance
Evaluation and Design
21
2.4.2 Neighbouring Context
Figure 2.4.2.1 –Entrance of the Dart Bar
The dart bar located at commercial block area, surrounding with 4 story shops. The
building located atJalan Puteri 1.Infornt ofthe building is typical commercial public car park lots.
2.4.3 Surrounding Issue
I. Good strategic direction
Since the Dart Bar is facing toward east, it is likely to receive high amountofstrong morning
light. However with the Dart Bar located at the ground floor and footway with shaded reduce
the directsun light penetration, influence light quality become dimmer.
In the evening, high rise building atthe west blocking all the sunlight, rear door ofthe Dart Bar
is enclosed,no sunlightable exposed into bar.
II. Loud Noise and Sound
The heavy traffic in the morning on LDP during working hours 8-10am contributes sound and
noise pollution to the building, while the traffic remains as source ofthe sound pollution, the
beeping sound ofthe traffic jam also disturb to the site. In the evening, the routine repeats as
the heavy traffic starts to build up from 6-8pm.
ARC 3413 Building Science Project 1: Lighting & Acoustic Performance
Evaluation and Design
22
2.5 EXISTING LIGHTINGCONDITIONS
2.5.1 Daylight Factor
2.5.2 Existing Light Fixtures
Type ofartificial lighting source
Outdoor Café Zone
Product Brand Antique PLT Edison Bulb
Luminous Flux 350
Colour Temperature 3000K (yellow light)
Colour Rendering Index 30
Beam Angle 35
Power 60W
Placement
Indoor Café Zone
Product Brand Philips Rox LED FL000/70/30
Luminous Flux 1100
Colour Temperature 3000K (warm white light)
Colour Rendering Index 80
Beam Angle 90
Power 15W
Placement Down light
Product Brand Philips Mesh Downlight
Luminous Flux 200
Colour Temperature 3000K (warm yellow light)
Colour Rendering Index 50
Beam Angle 90
Power 4.8W
Placement Bar table Down light
Product Brand OSRAM T8 26 mm Lamp
Luminous Flux 3350
Colour Temperature 2700K (warm yellow light)
Colour Rendering Index 80
Beam Angle 50
Power 36W
Placement Display Box Lighting
ARC 3413 Building Science Project 1: Lighting & Acoustic Performance
Evaluation and Design
23
Office Zone
Product Brand Philips Slim Downlight LED
Luminous Flux 1000
Colour Temperature 2700K (warm white light)
Colour Rendering Index 80
Beam Angle 90
Power 10W
Placement Ceiling Down light
ARC 3413 Building Science Project 1: Lighting & Acoustic Performance
Evaluation and Design
24
2.6 LIGHTINGANALYSIS
2.6.1 Lighting Data Collection
Table 2.6.1.1 – Tabulation of Light Data at 2pm – 5pm (28/4/2016)
ARC 3413 Building Science Project 1: Lighting & Acoustic Performance
Evaluation and Design
25
ARC 3413 Building Science Project 1: Lighting & Acoustic Performance
Evaluation and Design
26
Table 2.6.1.2 – Tabulation of Light Data at 10pm – 12pm (7/5/2016)
ARC 3413 Building Science Project 1: Lighting & Acoustic Performance
Evaluation and Design
27
Figure 2.6.1.1 – Grid line of the Dart Bar
ARC 3413 Building Science Project 1: Lighting & Acoustic Performance
Evaluation and Design
28
Figure 2.6.1.2 – Grid line of the Dart Bar
As in shown figure 2.6.1.1 illustrates the grid points of The Dart Bar, Puchong.
As shown offigure 2.6.1.2 above is showing the division ofzoning for The Dart Bar.
ARC 3413 Building Science Project 1: Lighting & Acoustic Performance
Evaluation and Design
29
Figure 2.6.1.3 – Cross section showing the artificial lighting of the Dart
The figure 2.6.1.3 above illustrates the type of lighting applied in the interior spaces. As
shown the lights is located in Zone 3, Counter Bar & Kitchen. The selection oflight fixture was
based on its method of light distribution to accommodate the functions of spaces. Down light
gives the directlighting to the working level and provide clear view for the workspaces.
Figure 2.6.1.4 – Longitudinal Section shows the daylighting of TheDartBar
Figure 2.6.1.4 above indicates the sources ofdaylighting to illuminate the interior spaces.
Daylight intensity is higher in the one site of TheDartBar compared to the internal spaces. This
is due to the openness and window openings ofTheDartbar at the left site of the section. While
also the daylightprovides an alternative light source for certain space ofthe interior inside.
ARC 3413 Building Science Project 1: Lighting & Acoustic Performance
Evaluation and Design
30
Tabulation and Interpretation of data
There will be 2 set of readings for light tabulation data. The data were measured and
recorded atthe level of 1.0m (stomach level) and 1.5m (eye level) respectively.This applies to
both data collection which were collected throughoutday and night. Hence the colours indicate
zoning ofthe spaces as show in the legend below accordingly.
Table 2.6.1.3 – Light data (2pm-5pm)
The light data above shows the data collected during tea time hours of the day in The
Dart Bar, Puchong.
ARC 3413 Building Science Project 1: Lighting & Acoustic Performance
Evaluation and Design
31
Table 2.6.1.4 –Light data (10pm-12pm)
The light data table 2.6.1.4 shows the data during night time, 10pm to 12am is mostly
moderate-peak hour for customers to come in for activities around. Hence the customers like to
hang around the indoor café and the dart areas. As the lights were dim enough to create a
warm atmospheres to suitthe customers’ needs to hang around the indoor café and dart area.
ARC 3413 Building Science Project 1: Lighting & Acoustic Performance
Evaluation and Design
32
2.5.2 Lighting Contour Diagram
Figure 2.5.2.1 – Position of lights in the Dart Bar
ARC 3413 Building Science Project 1: Lighting & Acoustic Performance
Evaluation and Design
33
Figure 2.5.2.2 – Night time light contour (10pm-12pm)
ARC 3413 Building Science Project 1: Lighting & Acoustic Performance
Evaluation and Design
34
Figure 2.5.2.3 – Day time light contour (2pm-5pm)
ARC 3413 Building Science Project 1: Lighting & Acoustic Performance
Evaluation and Design
35
2.5.3 Lighting Data Analysis
CATEGORIES MATERIALS COLOUR REFLECTANCE
(%)
SURFACE
TEXTURE
Wall Brick Cladding Brown 60 Rough
Wood Cladding Brown 60 Smooth
Concrete Black 10 Matte
Glass Transparent 8 Glossy
Ceiling Concrete Black 10 Matte
ARC 3413 Building Science Project 1: Lighting & Acoustic Performance
Evaluation and Design
36
Plaster White 80 Smooth
CATEGORIES MATERIALS COLOUR REFLECTANCE
(%)
SURFACE
TEXTURE
Floor Timber Flooring Brown 60 Smooth
Porcelain Tiles Grey 60 Glossy
Carpet Black with
white strip
10 Smooth
ARC 3413 Building Science Project 1: Lighting & Acoustic Performance
Evaluation and Design
37
CATEGORIES MATERIALS COLOUR REFLECTANCE
(%)
SURFACE
TEXTURE
Furniture
(Sofa)
Leather Black 10 Smooth
Furniture
(Bar table top)
Granite Black 10 Glossy
ARC 3413 Building Science Project 1: Lighting & Acoustic Performance
Evaluation and Design
38
2.7 LIGHTINGCALCULATIONANALYSIS
2.7.1 Zone A Calculation
Dimension ofroom
(L x W) (m)
5.8 x 4
Total Floor Area /
A (m2)
23.2
Type ofLighting
Fixture
Antique PLT Edison Bulb
Number of Lightings
Fixtures / N
10
Lumen ofLighting
Fixture / F (lm)
350
Height ofLuminaire
(m)
2
Height ofwork level
(m)
0.8
Mounting height
H (hm)
1.2
Reflection Factors Ceiling: Concrete (1.0)
Wall: Wood Cladding (0.6)
Floor: Timber Flooring (0.6)
Room Index / RI (K) (5.8 x 4) / (5.8 + 4) x 1.2
=23.2 / 11.76
=1.97
Utilization Factor / UF
Based on given
utilization factor table.
0.65
Maintenance Factor /
MF
0.7
ARC 3413 Building Science Project 1: Lighting & Acoustic Performance
Evaluation and Design
39
Standard illuminance
(Lux)
200
Illmuninance Level - E
(Lux)
(10 x 350 x 0.65 x 0.7) / 23.2
=1592.5 / 23.2
=68.64
Total illuminance level
/ E (Lux)
68.64
Discussion:
According to MS1525 standard illuminance for cafeteria is 200 lux. Illuminance of our site which
is 68.64 lux doesn’tmeetthe requirement.
Therefore, to meetthe requirements, additional number ofAntique PLT Edison Bulb is required
to make up the insufficient illuminance. Due to ceiling is make ofconcrete and there is only fan
attached. Calculation is as below:
= (68.64 x 23.2) / (350 x 0.65 x 0.7)
=1592.448 / 159.25
=9.99
=10
Hence, an additional ten (10) number of Antique PLT Edison Bulb are required to meetthe
standard illuminance for the zone.
ARC 3413 Building Science Project 1: Lighting & Acoustic Performance
Evaluation and Design
40
2.7.2 Zone B Calculation
Dimensionofroom
(L x W) (m)
6.3 x 7.3
TotalFloorArea /
A (m2)
45.99
Typeof Lighting
Fixture
Philips Rox LED
FL000/70/30
PhilipsMesh
Downlight
Numberof LightingsFixtures
/ N
1 6
Lumenof Lighting
Fixture/ F (lm)
1100 200
Heightof Luminaire
(m)
2.4 2.25
Heightof worklevel
(m)
0.8
Mountingheight
H (hm)
1.6 1.45
ReflectionFactors Ceiling: Concrete(1.0)
Wall: BrickCladding(0.6)
Floor: TimberFlooring(0.6)
Room Index/ RI (K) (6.3 x 7.3) / (6.3
+ 7.3) x 1.6
=45.99/ 21.76
= 2.11
(6.3 x 7.3) /
(6.3 + 7.3) x
1.45
=45.99/
19.72
=2.33
Utilization Factor/ UF
Basedon given utilization
factortable.
0.58 0.65
MaintenanceFactor/MF 0.7
Standardilluminance
(Lux)
200
IllmuninanceLevel -E (Lux) (1 x 1100 x 0.58
x 0.7) / 45.99
=446.6/ 45.99
=9.7
(6 x 200 x
0.65 x 0.7) /
45.99
=546/ 45.99
=11.87
Totalilluminancelevel/E
(Lux)
9.7 + 11.87
=21.57
ARC 3413 Building Science Project 1: Lighting & Acoustic Performance
Evaluation and Design
41
Discussion:
According to MS1525 standard illuminance for cafeteria is 200 lux. Illuminance of our site which
is 21.57 lux doesn’t meetthe requirement.
Therefore, to meetthe requirements, additional number ofPhilips Rox LED FL000/70/30
is required to make up the insufficient illuminance. Due to ceiling is make ofconcrete and there
is only fan attached. Calculation is as below:
= (21.57 x 45.99) / (1100 x 0.58 x 0.7)
=992 / 446.6
=2.22
=2
Hence, an additional two (2) number of Philips Rox LED FL000/70/30 are required to meetthe
standard illuminance for the zone.
ARC 3413 Building Science Project 1: Lighting & Acoustic Performance
Evaluation and Design
42
2.7.3 Zone C Calculation
Dimensionofroom
(L x W) (m)
4.2 x 7.3
TotalFloorArea /
A (m2)
30.66
Typeof Lighting
Fixture
Philips Rox LED
FL000/70/30
Philips Mesh
Downlight
Numberof LightingsFixtures
/ N
4 6
Lumenof Lighting
Fixture/ F (lm)
1100 200
Heightof Luminaire
(m)
2.4 2.25
Heightof worklevel
(m)
0.8
Mountingheight
H (hm)
1.6 1.45
ReflectionFactors Ceiling: Concrete(1.0)
Wall: BrickCladding(0.6)
Floor: TimberFlooring(0.6)
Room Index/ RI (K) (6.3 x 7.3) / (6.3
+ 7.3) x 1.6
=45.99/ 21.76
= 2.11
(6.3 x 7.3) /
(6.3 + 7.3) x
1.45
=45.99/
19.72
=2.33
Utilization Factor/ UF
Basedon given utilization
factortable.
0.58 0.65
MaintenanceFactor/MF 0.7
Standardilluminance
(Lux)
200
IllmuninanceLevel -E (Lux) (1 x 1100 x 0.58
x 0.7) / 45.99
=446.6/ 45.99
=9.7
(6 x 200 x
0.65 x 0.7) /
45.99
=546/ 45.99
=11.87
Totalilluminancelevel/E
(Lux)
9.7 + 11.87
=21.57
ARC 3413 Building Science Project 1: Lighting & Acoustic Performance
Evaluation and Design
43
Discussion:
According to MS1525 standard illuminance for cafeteria is 200 lux. Illuminance of our site which
is 21.57 lux doesn’tmeetthe requirement.
Therefore, to meetthe requirements, additional number ofPhilips Rox LED FL000/70/30
is required to make up the insufficient illuminance. Due to ceiling is make ofconcrete and there
is only fan attached. Calculation is as below:
= (200-21.57) x 45.99 / (1100 x 0.58 x 0.7)
= 8206 / 446.6
= 18.4
= 18
Hence,an additional eighteen(18) numberof Philips Rox LED FL000/70/30 are required to meet
the standard illuminance for the zone.
ARC 3413 Building Science Project 1: Lighting & Acoustic Performance
Evaluation and Design
44
2.7.4 Zone D Calculation
Dimensionofroom
(L x W) (m)
6.9 x 7.3
TotalFloorArea /
A (m2)
50.37
Typeof Lighting
Fixture
Philips Rox LED
FL000/70/30
OSRAM T8
26 mm Lamp
Numberof LightingsFixtures/
N
5 4
Lumenof Lighting
Fixture/ F (lm)
1100 3350
Heightof Luminaire
(m)
2.4 1.8
Heightof worklevel
(m)
0.8
Mountingheight
H (hm)
1.6 1.0
ReflectionFactors Ceiling: Concrete(1.0)
Wall: BrickCladding(0.6)
Floor: TimberFlooring(0.6)
Room Index/ RI (K) (6.9 x 7.3) / (6.9
+ 7.3) x 1.6
= 50.37 / 22.72
= 2.22
(6.9 x 7.3) /
(6.9 + 7.3) x
1.0
= 50.37 / 14.2
= 3.55
Utilization Factor/ UF
Basedon given utilization
factortable.
0.58 0.49
MaintenanceFactor/MF 0.7
Standardilluminance
(Lux)
200
IllmuninanceLevel -E (Lux) 5 x 1100 x 0.58 x
0.7 / 50.37
= 2233/ 50.37
= 44.33
4 x 3350 x
0.49 x 0.7 /
50.37
= 4596.2 /
50.37
= 91.25
Totalilluminancelevel/E
(Lux)
44.33 + 91.25
= 135.58
Discussion:
According to MS1525, standard illuminance for dart area (lounge) is 150 lux. Illuminance for our
site is 135.58 meetthe standard requirements.
ARC 3413 Building Science Project 1: Lighting & Acoustic Performance
Evaluation and Design
45
2.7.5 Zone E Calculation
Dimensionofroom
(L x W) (m)
2.9 x 4.1
TotalFloorArea /
A (m2)
11.89
Typeof Lighting
Fixture
Philips Slim
Downlight LED
Philips Mesh
Downlight
Numberof LightingsFixtures/ N 4 1
Lumenof Lighting
Fixture/ F (lm)
1000 200
Heightof Luminaire
(m)
2.5 2.25
Heightof worklevel
(m)
0.8
Mountingheight
H (hm)
1.7 1.45
ReflectionFactors Ceiling: Plaster (0.8)
Wall: Concrete(1.0)
Floor: Carpet(1.0)
Room Index/ RI (K) (2.9 x 4.1) / (2.9
+ 4.1) x 1.7
= 11.89 / 11.9
= 0.99
(2.9 x 4.1) /
(2.9 + 4.1) x
1.45
= 11.89 /
10.15
= 1.17
Utilization Factor/ UF
Basedon given utilization factor
table.
0.52 0.52
MaintenanceFactor/MF 0.7
Standardilluminance
(Lux)
300
IllmuninanceLevel -E (Lux) (4 x 1000 x 0.52
x 0.7) / 11.89
= 1456/ 11.89
= 122.46
(1 x 200 x
0.52 x 0.7 ) /
11.89
= 72.8 / 11.89
= 6.12
Totalilluminancelevel/E (Lux) 122.46+ 6.12
= 128.58
ARC 3413 Building Science Project 1: Lighting & Acoustic Performance
Evaluation and Design
46
Discussion:
According to MS1525 standard illuminance for office is 300 lux. Illuminance of our site which is
128.58 lux doesn’tmeetthe requirement.
Therefore,to meetthe requirements,additionalnumberofPhilips SlimDownlight LED is required
to make up the insufficient illuminance. Due to the ceiling is made up ofplaster. Calculation is as
below:
= (300-128.58) x 11.89 / (1000 x 0.52 x 0.7)
= 2038.18 / 364
= 5.6
= 6
Hence, an additional six (6) number ofPhilips Slim Downlight LEDare required to meetthe
standard illuminance for the zone.
ARC 3413 Building Science Project 1: Lighting & Acoustic Performance
Evaluation and Design
47
2.8 EVALUATION AND CONCLUSION
2.8.1 Improvement for Lighting
As the light analysislux data collected&analysed,thereare 4 specific insufficientzonesthat didn’tmeet
the requirementforMS1525 standard illuminance for specific zones as proven in our lightanalysis
calculation & discussion. Those zones are zone A, zone B, zone C and Zone E. Based on
discussion made in each ofthe calculation that zone A is lacking of131.36 lux while zone B and
C is lacking of178.43 lux and lastly zone E is lacking of171.42 lux. These 4 specific zones could
have make some possible changes in order for them to have some improvementto adjustits lux
values to meetstandard MS 1525 standard illuminance requirement.
Hence, the material design ofthe surrounding could made some possible changes.The suitable
material are mostly shiny surfaces. As mention those shiny surfaces could be tiles, marble,
polished oak & possibility oftimber polished as the shop is already furnished with timber floor.
These materials could reflect the lighting well for the surroundings and also directly increases
the lux of the specific spaces.
2.8.2 Limitations with Lighting
In zone C, It is a kitchenand counter bar which also didn’tmeetits MS 1525 standard illuminance
but the current ambience suits it working space as for serving customers as example. The
working space mighthave lower luminance butit seems fits the designtheme and italso function
well enough for the workers to serve their individual customers. Even though zone C is having
low luminance but the workers hence to use table lamp lights for energy saving purposes.
2.8.3 General Discussion for Lighting
In general, there are needs and desires to control different light levels in accordance with our
daily activities and specific spacerequirementto create a certain desire effect.The careful control
of illuminance is an essential to provide visibility, safety and emotional satisfaction for the cafe.
As a designer we must take into consideration the surfaces finishes and texture of the space to
achieve the desire ambience environment.
ARC 3413 Building Science Project 1: Lighting & Acoustic Performance
Evaluation and Design
48
3.0 REFERENCES
1. US-DOE, EnergyPlus V6.0. From US Department of Energy, Building Technologies
Program, http://appsl.eere.energy.gov/buildingslenergyplusi, 2010.
2. A. Marsh, Autodesk e Ecotect, http://usa.autoclesk.comiecotect-analysis/, Autodesk
3. H. Wan, Y, Li, W. Yang, Analysis on the state, composition, and characteristics of
industrial building energy consumption in Dongguan, Building Energy Efficiency,
33(1)(2007) 230-231.
4. Y.Y.N. Edward, K.P Lam, W Wu, N. Takehiko, Advanced lighting simulation in
architectural design in the tropics, Automation in Construction 10(2001)365-379.
5. C.F Reinhart, S. Herkel, The simulation of annual daylightilluminance distributions e a
state-of-the-art comparison ofsix RADIANCE based methods,Energy and Buildings 32
(2000) 167-187.
6. Neufert, Ernst and Peter. Neufert Architects' Data. Oxford: Wiley-Blackwell, 2012
7. ElectricalLighting and Cable Selection.(2011,April4). Retrieved October13, 2015, from
http://www.slideshare.net/Denuka/electrical-lighting-cable-selection
8. Altomonte, S. (n.d.). Daylight Factor Retrieved October 12, 2015, from https://
www.eclucate-sustainability.euiportaliit/print/2255
9. Recommended average illuminance levels. (2007). In Code of practice on energy
efficiency and use of renewable energy for non-residential buildings (first revision).
Putrajaya: Department of Standard Malaysia.

Light report compiled

  • 2.
    ARC 3413 BuildingScience Project 1: Lighting & Acoustic Performance Evaluation and Design 2 TABLE OF CONTENT 1.0 Abstract 1.1 Aim & Objectives 1.2 Site Study 1.2.1 Site Introduction 1.2.2 Site Selection Reason 1.3 Technical Drawing 2.0 Lighting Performance Evaluation 2.1 Literature Review 2.1.1 Light in Architecture 2.1.2 Natural Day Lighting & Artificial Electrical Lighting 2.1.3 Daylight Factor 2.1.4 Lumen Method 2.2 Lighting Precedent Studies 2.3 Research Methodology 2.3.1 Lighting Measuring Equipment 2.3.2 Methodology 2.3.3 Data Collection Method 2.4 Case Study 2.4.1 Building Orientation 2.4.2 Neighbourhood Context 2.4.3 Surrounding Issue 2.5 Existing Lighting Condition 2.5.1 Daylight Factor 2.5.2 Existing Light Fixture 2.6 Lighting Analysis 2.6.1 Lighting Data Collection 2.6.2 Lighting Contour Diagram 2.6.3 Material Tabulation 2.7 Lighting Calculation Analysis 2.7.1 Zone A Calculation 2.7.2 Zone B Calculation 2.7.3 Zone C Calculation 2.7.4 Zone D Calculation 2.7.5 Zone E Calculation 2.8 Evaluation and Conclusion
  • 3.
    ARC 3413 BuildingScience Project 1: Lighting & Acoustic Performance Evaluation and Design 3 1.0 ABSTRACT This report contains the details of the study conducted at The Dart Bar in regards of lighting performances. This report contains the lighting performance evaluation and design. In architecture, lighting design play significantroles in creating the most optimum environment for its users. The qualities of a space can only truly be appreciated when it is imaginatively lit. The excellentunification of the lighting of buildings and the lighting ofits activities is what unifies the building and makes itinterpretable to its users to its bestcapabilities.Lightning play the important roles in the making of the atmosphere of a space, it is very important to take into account the many considerations required. Thus, through studies based on standards and requirements for lighting should be included in the design process. This project is intended to be completed in a group of 7 students to evaluate the environment of choosing in terms of lighting performance. A case study was selected as well. Included are the technical data such as formulas, equations and calculations that estimate luminance levels forlight. Allorthographic drawings and diagrams were made with data collected from measurements done on site. The analysis diagrams were made with Autodesk Revit®, a BIM software. A list of figures and tables used as well as references are provided atthe end of the reportto ease with navigation.
  • 4.
    ARC 3413 BuildingScience Project 1: Lighting & Acoustic Performance Evaluation and Design 4 1.1 AIM & OBJECTIVES This reportcontains the details ofthe study conducted atThe Dart Bar in regards oflighting performances. This reportcontains the lighting analysis which aims to:  To understand the day-lighting, lighting characteristics.  To understand the lighting requirementin a suggested place.  To determine the characteristics and function ofday-lighting, artificial lighting, within the intended space.  To critically reportand analyse the space and suggestremedies to improvisethe lighting qualities within the space. This projectalso aims to provide abetter understanding on the relationship betweenthe type of materials that are employed in terms of building materials as well as internal furnishings and finishes as well as their impacts on lighting conditions in the building based on the building’s functions. Understanding the volume and area ofeach functional space also helps indetermining the lighting requirements based on lighting inadequacy that is reflected in the data collection. In terms of lighting, specifications of luminaries, height of each type of light as well as the existence of fenestrations will help to understand the lighting conditions within each space. Backed up with precedentstudies,drawing comparisonwith our site study,our precedentstudies will aid in determining the different types oflighting. Backed up with precedentstudies, drawing comparison with our site study, our precedent studies will aid in determining the different types of lighting.
  • 5.
    ARC 3413 BuildingScience Project 1: Lighting & Acoustic Performance Evaluation and Design 5 1.2 SITE STUDY 1.2.1 Site Introduction Case Study : The Dart Bar Address : 53, Jalan Puteri 1/4, Bandar Puteri, 47100 Puchong, Selangor, Malaysia Fig 1.2.1.1 –Site plan The Dart Bar is located at Puchong, Selangor. Itis a 4 story shop lotof ground floor in which the design of relaxing atmosphere and eye catching signage when people pass by. The bar utilizes a long narrow shop house floor plan, keeping the bar efficientand organized. Ithas variation of zone dedicated for different uses which is well-suited for different activities to ensure that every customer can have a better time. 1.2.1 Site Selection Reason Based on observation, the building provides sufficientfunctional spaces for our analysis of lighting. The outdoor café, indoor café, counter bar and kitchen, dart area and office are what would help us develop an understanding on differentlighting conditions ofspaces that facilitates different programs and functions. In terms of lighting properties, the dartbar can be categorized into open, and enclosed space. The arrangement ofthe space provides the site with an array of natural day lighting and artificial lighting.
  • 6.
    ARC 3413 BuildingScience Project 1: Lighting & Acoustic Performance Evaluation and Design 6 1.3 TECHNICAL DRAWINGS Fig 1.3.1 – Plan of selected site
  • 7.
    ARC 3413 BuildingScience Project 1: Lighting & Acoustic Performance Evaluation and Design 7 Fig 1.3.2 – Section A-A Fig 1.3.3 – Section B-B
  • 8.
    ARC 3413 BuildingScience Project 1: Lighting & Acoustic Performance Evaluation and Design 8 2.0 LIGHTING PERFORMANCE EVALUATION 2.1 LIGHTINGLITERATURE REVIEW 2.1.1 Light in Architecture Light is an important aspect that affects architecture. Light controls people’s behaviour and emotions. The origin of light is natural light, which is also known as daylight. Light helps us redefine the relationships ofpeople with the environmentand with themselves. Itis divided into natural light and artificial light. The dynamic daylightand the controlled artificial lighting are able to affect not only distinct physical measurable conditions in a space, but also to instigate and provoke differentvisual experiences and moods 2.1.2 Natural Day lighting & Artificial Electrical Lighting Natural light is one of the mostimportant elements in architecture, helping to transform spaces and save energy. Natural light has always been important for architects. In a way, architects sculptbuildings in order thatthe light can play off their different surfaces. If done well, space and light can evoke positive emotional responses in people. However, itis almost impossible to go on without electrical lighting taking into consideration that a building should function in both day and night. Day lighting alone is not enough for some certain building typologies and functions such as museums and galleries. It is important to understand how to balance in designing with natural lighting and artificial lighting to achieve the bestperforming building. 2.1.3 Daylight Factor Daylight Factor is a ratio that represents the amount of illumination available indoors relative to the illumination presentoutdoors at the same time under overcastskies. It is used in architecture to assess the internal natural lighting levels as perceived on the working plane or surface, in order to determine if there is sufficient natural lighting for the occupants ofthe space to carry out their normal duties. It is the ratio ofinternal light level to external lightlevel.
  • 9.
    ARC 3413 BuildingScience Project 1: Lighting & Acoustic Performance Evaluation and Design 9 Daylight Factor is defined as follows: Where, Ei = illuminance due to daylightat a pointon the indoors working plane, Eo = simultaneous outdoor illuminance on a horizontal plane from an unobstructed hemisphere of overcastsky. Table 2.1.3 - Daylight factors and distribution (Department of standards Malaysia, 2007) 2.1.4 Lumen Method The Lumen Method is used to determine the number of lamps that should be installed for a given area or room, which in this case, we already have the number of fixtures, therefore we calculate the total illuminance of the space based on the number of fixtures and determine whether or not that particular space has enough lighting fixture.
  • 10.
    ARC 3413 BuildingScience Project 1: Lighting & Acoustic Performance Evaluation and Design 10 The number of lamps is given by the formula: Where, N = number oflamps required. E = illuminance level required (lux) A = area at working plane height(m2) F = average luminous flux from each lamp (lm) UF = utilisation factor, an allowance for the light distribution of the luminaire and the room surfaces. MF = maintenance factor, an allowance for reduced lightoutputbecause of deteriorationand dirt. Room Index, RI, is the ratio of room plan area to half the wall area between the working and luminaire planes: Where, L = length ofroom W = width ofroom Hm = mounting height, i.e. the vertical distance between the working plane and the luminaire
  • 11.
    ARC 3413 BuildingScience Project 1: Lighting & Acoustic Performance Evaluation and Design 11 2.2 LIGHTINGPRECEDENT STUDIES Case Study: Offices of a Finish Research Unit Place: Finland (Helsinki) Building Type: Office Building Contact: Eino Tetri (Helsinki University ofTechnology, Lightning Unit) Photos of the Place: A B C D E F G H Fig 2.2.1 – Visuals of the office
  • 12.
    ARC 3413 BuildingScience Project 1: Lighting & Acoustic Performance Evaluation and Design 12 Fig 2.2.2 – Office plan Average installed lighting power density is 13.86 W/m2. Ceiling height in each space varies between 2.26m and 2.94m where the height of the luminares is 2.26m and height of the work plane is 0.72m. Daylight are available in each office room. Exceptfor weekend, the rooms are occupied between 7am and 5:30pm where cleaning is made in the afternoon.
  • 13.
    ARC 3413 BuildingScience Project 1: Lighting & Acoustic Performance Evaluation and Design 13 Luminaries Description & Geometry Luminaire Type 1: Figure 2.2.3 Photometry of the luminaire, Geometry of the luminaire, Luminaire ON, Luminaire OFF Luminaire Type 2: Figure 2.2.4 Photometry of Luminaire, Geometry of Luminaire, Luminaire ON, Luminaire OFF Luminaire Type 3: Figure 2.2.5 Photometry of Luminaire, Geometry of Luminaire, Luminaire ON, Luminaire OFF
  • 14.
    ARC 3413 BuildingScience Project 1: Lighting & Acoustic Performance Evaluation and Design 14 Measurements: Calculation ofaverage illuminances on work planes at full power. D E A C H G F Eaverage(lx) 588 671 610 728 723 716 806 Uniformity 0.71 0.78 0.64 0.71 0.80 0.69 0.65 Illuminances on the work planes ofthe three rooms lowered by the use ofdimming control. Room E: Eaverage = 545 lx (80%), Uniformity = 0.7 Room A: Eaverage = 448 lx (73%), Uniformity = 0.57 Room G: Eaverage = 586 lx (80%), Uniformity = 0.77 Ratio ofaverage luminances ofwork planes,walls,ceiling and floorto desktop screenluminance are given in Table 1.1 Room Work Plane Walls Ceiling Floor E 0.4 0.9 1.5 0.35 E 1.3 1.84 3.3 0.77 A 0.54 0.65 1.52 0.36 A 1.1 1.6 3 0.72 Table 2.2.1 - Ratio of the average luminance to desktop screen luminance.
  • 15.
    ARC 3413 BuildingScience Project 1: Lighting & Acoustic Performance Evaluation and Design 15 Power Consumption in the Offices during One Day Figure 2.2.6 - Profile of total power consumption of the locales during 7 days Figure 2.2.7 - Sample of power consumption in the offices during the day
  • 16.
    ARC 3413 BuildingScience Project 1: Lighting & Acoustic Performance Evaluation and Design 16 2.3 RESEARCH METHODOLOGY Illumination in the bar has been evaluated in 2 different times of the day (14:00 and 22:00). Significant changes in the values can be observed atthe outside seats due to daylighting. In the interior spaces, the amount of illumination on each down light, which is approximately 170cm high from the ground,dartmachine has external L.E.Dand monitor affect the lighting ofthe space. Figure 2.3.1 – Collecting data using Lux Meter 2.3.1 Lighting Measuring Equipment Digital Lux Meter Manufacturer LUTRONDigital LuxMeter Model LX-101 Dimension 108x 73 x 23mm SensorProbe : 82x 55x 7 mm Lux MeterRanges 0 – 50,000Lux, 3 Ranges SamplingTime 0.4 Second OperatingTemp. 0 – 50 degreeCelsius
  • 17.
    ARC 3413 BuildingScience Project 1: Lighting & Acoustic Performance Evaluation and Design 17 2.3.2 Methodology a) Preliminary study on the types ofspaces to choose a suitable enclosed area for the study of acoustics. b) Measure and produce the technical drawings such as floor plans, sections and elevation digitally based on on-site measurements. c) After standardizing the drawings, determine the grid line of1.5m x 1.5m d) Delegate tasks among group members and clarify on the method oftaking readings and using the tools and equipmentbefore data collection begins. e) Collectdata based on the proper procedures. f) Observe and record the existing external and internal light sources. h) Compile and tabulate the data or reading. h) Carry out calculation and analysis. Draw a conclusion or recommendations at the end of the analysis. It is used to capture the source ofnoise such as mechanical devices,speakers, and existing activities and also to record the existing materials in the environment. It is used to determine the positions of the sound level meter from the ground level and also used to determine the 1.5m x 1.5m grid on the studying area.
  • 18.
    ARC 3413 BuildingScience Project 1: Lighting & Acoustic Performance Evaluation and Design 18 Figure 2.3.2.1 – Plan of site with zoning
  • 19.
    ARC 3413 BuildingScience Project 1: Lighting & Acoustic Performance Evaluation and Design 19 2.3.3 Data Collection Procedures a) Draw grid lines of1.5m x 1.5m on the site floor plan to identify the position ofdata collecting. b) Stand at the intersection pointofthe grid and hold the measuring device athip level and eye level. c) Stand firm and preventtalking while taking readings. d) Specify the light source that might affect the readings, such as people shadow. e) Repeatthe steps above for the restof the intersection points. f) Conduct the study for peak hour (12pm) and non-peak hour (9pm) to analyze different acoustics condition atdifferent hour. Figure 2.3.3.1 – Using measuring tape as a guideline for 1.5m measuring tape.
  • 20.
    ARC 3413 BuildingScience Project 1: Lighting & Acoustic Performance Evaluation and Design 20 2.4 CASE STUDY 2.4.1 Building Orientation Figure 2.4.1.1 –Site Location Figure 2.4.1.2 –Entrance of the Dart Bar The main entrance ofthe building situated facing to east. The building entrance receives the highest amount of morning sunlight. The dart bar at the ground floor, opposite shop lots blocking mostofthe directsunlightexpose into indoor café.
  • 21.
    ARC 3413 BuildingScience Project 1: Lighting & Acoustic Performance Evaluation and Design 21 2.4.2 Neighbouring Context Figure 2.4.2.1 –Entrance of the Dart Bar The dart bar located at commercial block area, surrounding with 4 story shops. The building located atJalan Puteri 1.Infornt ofthe building is typical commercial public car park lots. 2.4.3 Surrounding Issue I. Good strategic direction Since the Dart Bar is facing toward east, it is likely to receive high amountofstrong morning light. However with the Dart Bar located at the ground floor and footway with shaded reduce the directsun light penetration, influence light quality become dimmer. In the evening, high rise building atthe west blocking all the sunlight, rear door ofthe Dart Bar is enclosed,no sunlightable exposed into bar. II. Loud Noise and Sound The heavy traffic in the morning on LDP during working hours 8-10am contributes sound and noise pollution to the building, while the traffic remains as source ofthe sound pollution, the beeping sound ofthe traffic jam also disturb to the site. In the evening, the routine repeats as the heavy traffic starts to build up from 6-8pm.
  • 22.
    ARC 3413 BuildingScience Project 1: Lighting & Acoustic Performance Evaluation and Design 22 2.5 EXISTING LIGHTINGCONDITIONS 2.5.1 Daylight Factor 2.5.2 Existing Light Fixtures Type ofartificial lighting source Outdoor Café Zone Product Brand Antique PLT Edison Bulb Luminous Flux 350 Colour Temperature 3000K (yellow light) Colour Rendering Index 30 Beam Angle 35 Power 60W Placement Indoor Café Zone Product Brand Philips Rox LED FL000/70/30 Luminous Flux 1100 Colour Temperature 3000K (warm white light) Colour Rendering Index 80 Beam Angle 90 Power 15W Placement Down light Product Brand Philips Mesh Downlight Luminous Flux 200 Colour Temperature 3000K (warm yellow light) Colour Rendering Index 50 Beam Angle 90 Power 4.8W Placement Bar table Down light Product Brand OSRAM T8 26 mm Lamp Luminous Flux 3350 Colour Temperature 2700K (warm yellow light) Colour Rendering Index 80 Beam Angle 50 Power 36W Placement Display Box Lighting
  • 23.
    ARC 3413 BuildingScience Project 1: Lighting & Acoustic Performance Evaluation and Design 23 Office Zone Product Brand Philips Slim Downlight LED Luminous Flux 1000 Colour Temperature 2700K (warm white light) Colour Rendering Index 80 Beam Angle 90 Power 10W Placement Ceiling Down light
  • 24.
    ARC 3413 BuildingScience Project 1: Lighting & Acoustic Performance Evaluation and Design 24 2.6 LIGHTINGANALYSIS 2.6.1 Lighting Data Collection Table 2.6.1.1 – Tabulation of Light Data at 2pm – 5pm (28/4/2016)
  • 25.
    ARC 3413 BuildingScience Project 1: Lighting & Acoustic Performance Evaluation and Design 25
  • 26.
    ARC 3413 BuildingScience Project 1: Lighting & Acoustic Performance Evaluation and Design 26 Table 2.6.1.2 – Tabulation of Light Data at 10pm – 12pm (7/5/2016)
  • 27.
    ARC 3413 BuildingScience Project 1: Lighting & Acoustic Performance Evaluation and Design 27 Figure 2.6.1.1 – Grid line of the Dart Bar
  • 28.
    ARC 3413 BuildingScience Project 1: Lighting & Acoustic Performance Evaluation and Design 28 Figure 2.6.1.2 – Grid line of the Dart Bar As in shown figure 2.6.1.1 illustrates the grid points of The Dart Bar, Puchong. As shown offigure 2.6.1.2 above is showing the division ofzoning for The Dart Bar.
  • 29.
    ARC 3413 BuildingScience Project 1: Lighting & Acoustic Performance Evaluation and Design 29 Figure 2.6.1.3 – Cross section showing the artificial lighting of the Dart The figure 2.6.1.3 above illustrates the type of lighting applied in the interior spaces. As shown the lights is located in Zone 3, Counter Bar & Kitchen. The selection oflight fixture was based on its method of light distribution to accommodate the functions of spaces. Down light gives the directlighting to the working level and provide clear view for the workspaces. Figure 2.6.1.4 – Longitudinal Section shows the daylighting of TheDartBar Figure 2.6.1.4 above indicates the sources ofdaylighting to illuminate the interior spaces. Daylight intensity is higher in the one site of TheDartBar compared to the internal spaces. This is due to the openness and window openings ofTheDartbar at the left site of the section. While also the daylightprovides an alternative light source for certain space ofthe interior inside.
  • 30.
    ARC 3413 BuildingScience Project 1: Lighting & Acoustic Performance Evaluation and Design 30 Tabulation and Interpretation of data There will be 2 set of readings for light tabulation data. The data were measured and recorded atthe level of 1.0m (stomach level) and 1.5m (eye level) respectively.This applies to both data collection which were collected throughoutday and night. Hence the colours indicate zoning ofthe spaces as show in the legend below accordingly. Table 2.6.1.3 – Light data (2pm-5pm) The light data above shows the data collected during tea time hours of the day in The Dart Bar, Puchong.
  • 31.
    ARC 3413 BuildingScience Project 1: Lighting & Acoustic Performance Evaluation and Design 31 Table 2.6.1.4 –Light data (10pm-12pm) The light data table 2.6.1.4 shows the data during night time, 10pm to 12am is mostly moderate-peak hour for customers to come in for activities around. Hence the customers like to hang around the indoor café and the dart areas. As the lights were dim enough to create a warm atmospheres to suitthe customers’ needs to hang around the indoor café and dart area.
  • 32.
    ARC 3413 BuildingScience Project 1: Lighting & Acoustic Performance Evaluation and Design 32 2.5.2 Lighting Contour Diagram Figure 2.5.2.1 – Position of lights in the Dart Bar
  • 33.
    ARC 3413 BuildingScience Project 1: Lighting & Acoustic Performance Evaluation and Design 33 Figure 2.5.2.2 – Night time light contour (10pm-12pm)
  • 34.
    ARC 3413 BuildingScience Project 1: Lighting & Acoustic Performance Evaluation and Design 34 Figure 2.5.2.3 – Day time light contour (2pm-5pm)
  • 35.
    ARC 3413 BuildingScience Project 1: Lighting & Acoustic Performance Evaluation and Design 35 2.5.3 Lighting Data Analysis CATEGORIES MATERIALS COLOUR REFLECTANCE (%) SURFACE TEXTURE Wall Brick Cladding Brown 60 Rough Wood Cladding Brown 60 Smooth Concrete Black 10 Matte Glass Transparent 8 Glossy Ceiling Concrete Black 10 Matte
  • 36.
    ARC 3413 BuildingScience Project 1: Lighting & Acoustic Performance Evaluation and Design 36 Plaster White 80 Smooth CATEGORIES MATERIALS COLOUR REFLECTANCE (%) SURFACE TEXTURE Floor Timber Flooring Brown 60 Smooth Porcelain Tiles Grey 60 Glossy Carpet Black with white strip 10 Smooth
  • 37.
    ARC 3413 BuildingScience Project 1: Lighting & Acoustic Performance Evaluation and Design 37 CATEGORIES MATERIALS COLOUR REFLECTANCE (%) SURFACE TEXTURE Furniture (Sofa) Leather Black 10 Smooth Furniture (Bar table top) Granite Black 10 Glossy
  • 38.
    ARC 3413 BuildingScience Project 1: Lighting & Acoustic Performance Evaluation and Design 38 2.7 LIGHTINGCALCULATIONANALYSIS 2.7.1 Zone A Calculation Dimension ofroom (L x W) (m) 5.8 x 4 Total Floor Area / A (m2) 23.2 Type ofLighting Fixture Antique PLT Edison Bulb Number of Lightings Fixtures / N 10 Lumen ofLighting Fixture / F (lm) 350 Height ofLuminaire (m) 2 Height ofwork level (m) 0.8 Mounting height H (hm) 1.2 Reflection Factors Ceiling: Concrete (1.0) Wall: Wood Cladding (0.6) Floor: Timber Flooring (0.6) Room Index / RI (K) (5.8 x 4) / (5.8 + 4) x 1.2 =23.2 / 11.76 =1.97 Utilization Factor / UF Based on given utilization factor table. 0.65 Maintenance Factor / MF 0.7
  • 39.
    ARC 3413 BuildingScience Project 1: Lighting & Acoustic Performance Evaluation and Design 39 Standard illuminance (Lux) 200 Illmuninance Level - E (Lux) (10 x 350 x 0.65 x 0.7) / 23.2 =1592.5 / 23.2 =68.64 Total illuminance level / E (Lux) 68.64 Discussion: According to MS1525 standard illuminance for cafeteria is 200 lux. Illuminance of our site which is 68.64 lux doesn’tmeetthe requirement. Therefore, to meetthe requirements, additional number ofAntique PLT Edison Bulb is required to make up the insufficient illuminance. Due to ceiling is make ofconcrete and there is only fan attached. Calculation is as below: = (68.64 x 23.2) / (350 x 0.65 x 0.7) =1592.448 / 159.25 =9.99 =10 Hence, an additional ten (10) number of Antique PLT Edison Bulb are required to meetthe standard illuminance for the zone.
  • 40.
    ARC 3413 BuildingScience Project 1: Lighting & Acoustic Performance Evaluation and Design 40 2.7.2 Zone B Calculation Dimensionofroom (L x W) (m) 6.3 x 7.3 TotalFloorArea / A (m2) 45.99 Typeof Lighting Fixture Philips Rox LED FL000/70/30 PhilipsMesh Downlight Numberof LightingsFixtures / N 1 6 Lumenof Lighting Fixture/ F (lm) 1100 200 Heightof Luminaire (m) 2.4 2.25 Heightof worklevel (m) 0.8 Mountingheight H (hm) 1.6 1.45 ReflectionFactors Ceiling: Concrete(1.0) Wall: BrickCladding(0.6) Floor: TimberFlooring(0.6) Room Index/ RI (K) (6.3 x 7.3) / (6.3 + 7.3) x 1.6 =45.99/ 21.76 = 2.11 (6.3 x 7.3) / (6.3 + 7.3) x 1.45 =45.99/ 19.72 =2.33 Utilization Factor/ UF Basedon given utilization factortable. 0.58 0.65 MaintenanceFactor/MF 0.7 Standardilluminance (Lux) 200 IllmuninanceLevel -E (Lux) (1 x 1100 x 0.58 x 0.7) / 45.99 =446.6/ 45.99 =9.7 (6 x 200 x 0.65 x 0.7) / 45.99 =546/ 45.99 =11.87 Totalilluminancelevel/E (Lux) 9.7 + 11.87 =21.57
  • 41.
    ARC 3413 BuildingScience Project 1: Lighting & Acoustic Performance Evaluation and Design 41 Discussion: According to MS1525 standard illuminance for cafeteria is 200 lux. Illuminance of our site which is 21.57 lux doesn’t meetthe requirement. Therefore, to meetthe requirements, additional number ofPhilips Rox LED FL000/70/30 is required to make up the insufficient illuminance. Due to ceiling is make ofconcrete and there is only fan attached. Calculation is as below: = (21.57 x 45.99) / (1100 x 0.58 x 0.7) =992 / 446.6 =2.22 =2 Hence, an additional two (2) number of Philips Rox LED FL000/70/30 are required to meetthe standard illuminance for the zone.
  • 42.
    ARC 3413 BuildingScience Project 1: Lighting & Acoustic Performance Evaluation and Design 42 2.7.3 Zone C Calculation Dimensionofroom (L x W) (m) 4.2 x 7.3 TotalFloorArea / A (m2) 30.66 Typeof Lighting Fixture Philips Rox LED FL000/70/30 Philips Mesh Downlight Numberof LightingsFixtures / N 4 6 Lumenof Lighting Fixture/ F (lm) 1100 200 Heightof Luminaire (m) 2.4 2.25 Heightof worklevel (m) 0.8 Mountingheight H (hm) 1.6 1.45 ReflectionFactors Ceiling: Concrete(1.0) Wall: BrickCladding(0.6) Floor: TimberFlooring(0.6) Room Index/ RI (K) (6.3 x 7.3) / (6.3 + 7.3) x 1.6 =45.99/ 21.76 = 2.11 (6.3 x 7.3) / (6.3 + 7.3) x 1.45 =45.99/ 19.72 =2.33 Utilization Factor/ UF Basedon given utilization factortable. 0.58 0.65 MaintenanceFactor/MF 0.7 Standardilluminance (Lux) 200 IllmuninanceLevel -E (Lux) (1 x 1100 x 0.58 x 0.7) / 45.99 =446.6/ 45.99 =9.7 (6 x 200 x 0.65 x 0.7) / 45.99 =546/ 45.99 =11.87 Totalilluminancelevel/E (Lux) 9.7 + 11.87 =21.57
  • 43.
    ARC 3413 BuildingScience Project 1: Lighting & Acoustic Performance Evaluation and Design 43 Discussion: According to MS1525 standard illuminance for cafeteria is 200 lux. Illuminance of our site which is 21.57 lux doesn’tmeetthe requirement. Therefore, to meetthe requirements, additional number ofPhilips Rox LED FL000/70/30 is required to make up the insufficient illuminance. Due to ceiling is make ofconcrete and there is only fan attached. Calculation is as below: = (200-21.57) x 45.99 / (1100 x 0.58 x 0.7) = 8206 / 446.6 = 18.4 = 18 Hence,an additional eighteen(18) numberof Philips Rox LED FL000/70/30 are required to meet the standard illuminance for the zone.
  • 44.
    ARC 3413 BuildingScience Project 1: Lighting & Acoustic Performance Evaluation and Design 44 2.7.4 Zone D Calculation Dimensionofroom (L x W) (m) 6.9 x 7.3 TotalFloorArea / A (m2) 50.37 Typeof Lighting Fixture Philips Rox LED FL000/70/30 OSRAM T8 26 mm Lamp Numberof LightingsFixtures/ N 5 4 Lumenof Lighting Fixture/ F (lm) 1100 3350 Heightof Luminaire (m) 2.4 1.8 Heightof worklevel (m) 0.8 Mountingheight H (hm) 1.6 1.0 ReflectionFactors Ceiling: Concrete(1.0) Wall: BrickCladding(0.6) Floor: TimberFlooring(0.6) Room Index/ RI (K) (6.9 x 7.3) / (6.9 + 7.3) x 1.6 = 50.37 / 22.72 = 2.22 (6.9 x 7.3) / (6.9 + 7.3) x 1.0 = 50.37 / 14.2 = 3.55 Utilization Factor/ UF Basedon given utilization factortable. 0.58 0.49 MaintenanceFactor/MF 0.7 Standardilluminance (Lux) 200 IllmuninanceLevel -E (Lux) 5 x 1100 x 0.58 x 0.7 / 50.37 = 2233/ 50.37 = 44.33 4 x 3350 x 0.49 x 0.7 / 50.37 = 4596.2 / 50.37 = 91.25 Totalilluminancelevel/E (Lux) 44.33 + 91.25 = 135.58 Discussion: According to MS1525, standard illuminance for dart area (lounge) is 150 lux. Illuminance for our site is 135.58 meetthe standard requirements.
  • 45.
    ARC 3413 BuildingScience Project 1: Lighting & Acoustic Performance Evaluation and Design 45 2.7.5 Zone E Calculation Dimensionofroom (L x W) (m) 2.9 x 4.1 TotalFloorArea / A (m2) 11.89 Typeof Lighting Fixture Philips Slim Downlight LED Philips Mesh Downlight Numberof LightingsFixtures/ N 4 1 Lumenof Lighting Fixture/ F (lm) 1000 200 Heightof Luminaire (m) 2.5 2.25 Heightof worklevel (m) 0.8 Mountingheight H (hm) 1.7 1.45 ReflectionFactors Ceiling: Plaster (0.8) Wall: Concrete(1.0) Floor: Carpet(1.0) Room Index/ RI (K) (2.9 x 4.1) / (2.9 + 4.1) x 1.7 = 11.89 / 11.9 = 0.99 (2.9 x 4.1) / (2.9 + 4.1) x 1.45 = 11.89 / 10.15 = 1.17 Utilization Factor/ UF Basedon given utilization factor table. 0.52 0.52 MaintenanceFactor/MF 0.7 Standardilluminance (Lux) 300 IllmuninanceLevel -E (Lux) (4 x 1000 x 0.52 x 0.7) / 11.89 = 1456/ 11.89 = 122.46 (1 x 200 x 0.52 x 0.7 ) / 11.89 = 72.8 / 11.89 = 6.12 Totalilluminancelevel/E (Lux) 122.46+ 6.12 = 128.58
  • 46.
    ARC 3413 BuildingScience Project 1: Lighting & Acoustic Performance Evaluation and Design 46 Discussion: According to MS1525 standard illuminance for office is 300 lux. Illuminance of our site which is 128.58 lux doesn’tmeetthe requirement. Therefore,to meetthe requirements,additionalnumberofPhilips SlimDownlight LED is required to make up the insufficient illuminance. Due to the ceiling is made up ofplaster. Calculation is as below: = (300-128.58) x 11.89 / (1000 x 0.52 x 0.7) = 2038.18 / 364 = 5.6 = 6 Hence, an additional six (6) number ofPhilips Slim Downlight LEDare required to meetthe standard illuminance for the zone.
  • 47.
    ARC 3413 BuildingScience Project 1: Lighting & Acoustic Performance Evaluation and Design 47 2.8 EVALUATION AND CONCLUSION 2.8.1 Improvement for Lighting As the light analysislux data collected&analysed,thereare 4 specific insufficientzonesthat didn’tmeet the requirementforMS1525 standard illuminance for specific zones as proven in our lightanalysis calculation & discussion. Those zones are zone A, zone B, zone C and Zone E. Based on discussion made in each ofthe calculation that zone A is lacking of131.36 lux while zone B and C is lacking of178.43 lux and lastly zone E is lacking of171.42 lux. These 4 specific zones could have make some possible changes in order for them to have some improvementto adjustits lux values to meetstandard MS 1525 standard illuminance requirement. Hence, the material design ofthe surrounding could made some possible changes.The suitable material are mostly shiny surfaces. As mention those shiny surfaces could be tiles, marble, polished oak & possibility oftimber polished as the shop is already furnished with timber floor. These materials could reflect the lighting well for the surroundings and also directly increases the lux of the specific spaces. 2.8.2 Limitations with Lighting In zone C, It is a kitchenand counter bar which also didn’tmeetits MS 1525 standard illuminance but the current ambience suits it working space as for serving customers as example. The working space mighthave lower luminance butit seems fits the designtheme and italso function well enough for the workers to serve their individual customers. Even though zone C is having low luminance but the workers hence to use table lamp lights for energy saving purposes. 2.8.3 General Discussion for Lighting In general, there are needs and desires to control different light levels in accordance with our daily activities and specific spacerequirementto create a certain desire effect.The careful control of illuminance is an essential to provide visibility, safety and emotional satisfaction for the cafe. As a designer we must take into consideration the surfaces finishes and texture of the space to achieve the desire ambience environment.
  • 48.
    ARC 3413 BuildingScience Project 1: Lighting & Acoustic Performance Evaluation and Design 48 3.0 REFERENCES 1. US-DOE, EnergyPlus V6.0. From US Department of Energy, Building Technologies Program, http://appsl.eere.energy.gov/buildingslenergyplusi, 2010. 2. A. Marsh, Autodesk e Ecotect, http://usa.autoclesk.comiecotect-analysis/, Autodesk 3. H. Wan, Y, Li, W. Yang, Analysis on the state, composition, and characteristics of industrial building energy consumption in Dongguan, Building Energy Efficiency, 33(1)(2007) 230-231. 4. Y.Y.N. Edward, K.P Lam, W Wu, N. Takehiko, Advanced lighting simulation in architectural design in the tropics, Automation in Construction 10(2001)365-379. 5. C.F Reinhart, S. Herkel, The simulation of annual daylightilluminance distributions e a state-of-the-art comparison ofsix RADIANCE based methods,Energy and Buildings 32 (2000) 167-187. 6. Neufert, Ernst and Peter. Neufert Architects' Data. Oxford: Wiley-Blackwell, 2012 7. ElectricalLighting and Cable Selection.(2011,April4). Retrieved October13, 2015, from http://www.slideshare.net/Denuka/electrical-lighting-cable-selection 8. Altomonte, S. (n.d.). Daylight Factor Retrieved October 12, 2015, from https:// www.eclucate-sustainability.euiportaliit/print/2255 9. Recommended average illuminance levels. (2007). In Code of practice on energy efficiency and use of renewable energy for non-residential buildings (first revision). Putrajaya: Department of Standard Malaysia.