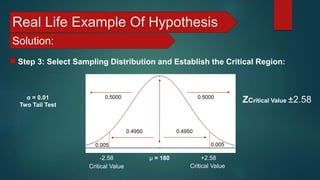
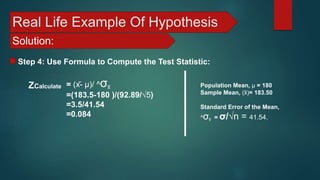
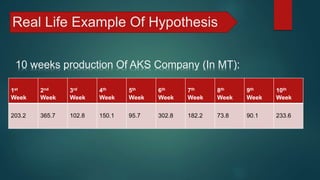
The document presents a hypothesis test involving the weekly production of the model 6la steel by Abul Khayer Steel Company. It details the calculation of population and sample means, standard deviations, and the statistical analysis performed to determine if the mean production differs from 180 at a 0.01 significance level. The conclusion indicates that the null hypothesis cannot be rejected, validating the claim that the mean production remains 180.


![Real Life Example Of Hypothesis
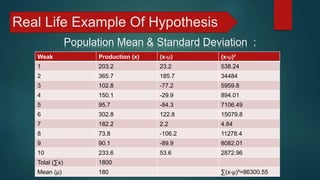
σ = √[∑(x-μ)²/N]
= √(86300.55/10)
=92.89
[Where N=10]
Standard Deviation (Population):](https://image.slidesharecdn.com/presentationonhypothesistestbyashikaminprem-181213173252/85/Presentation-on-Hypothesis-Test-by-Ashik-Amin-Prem-5-320.jpg)
![Real Life Example Of Hypothesis
Question:
Abul Khayer Steel Company, Chittagong manufactures an assembles
steels equipment at several plant in Chittagong. The weekly production of
the model 6LA steel follows a normal probability distribution with mean of
180 and a standard deviation of 92.89. Recently, because of market
expansion, new production methods have been introduced and new
employees hired. The executive of manufacturing would like to
investigate whether there has been a change in the weekly production of
the model 6LA steel. Is the mean number of steels produced different
from 180 at the 0.01 significance level?
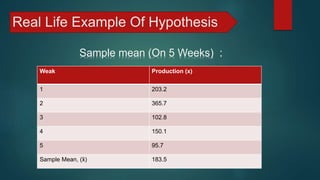
[The mean number of steels produced is 183.5 (5 weaks)]](https://image.slidesharecdn.com/presentationonhypothesistestbyashikaminprem-181213173252/85/Presentation-on-Hypothesis-Test-by-Ashik-Amin-Prem-7-320.jpg)