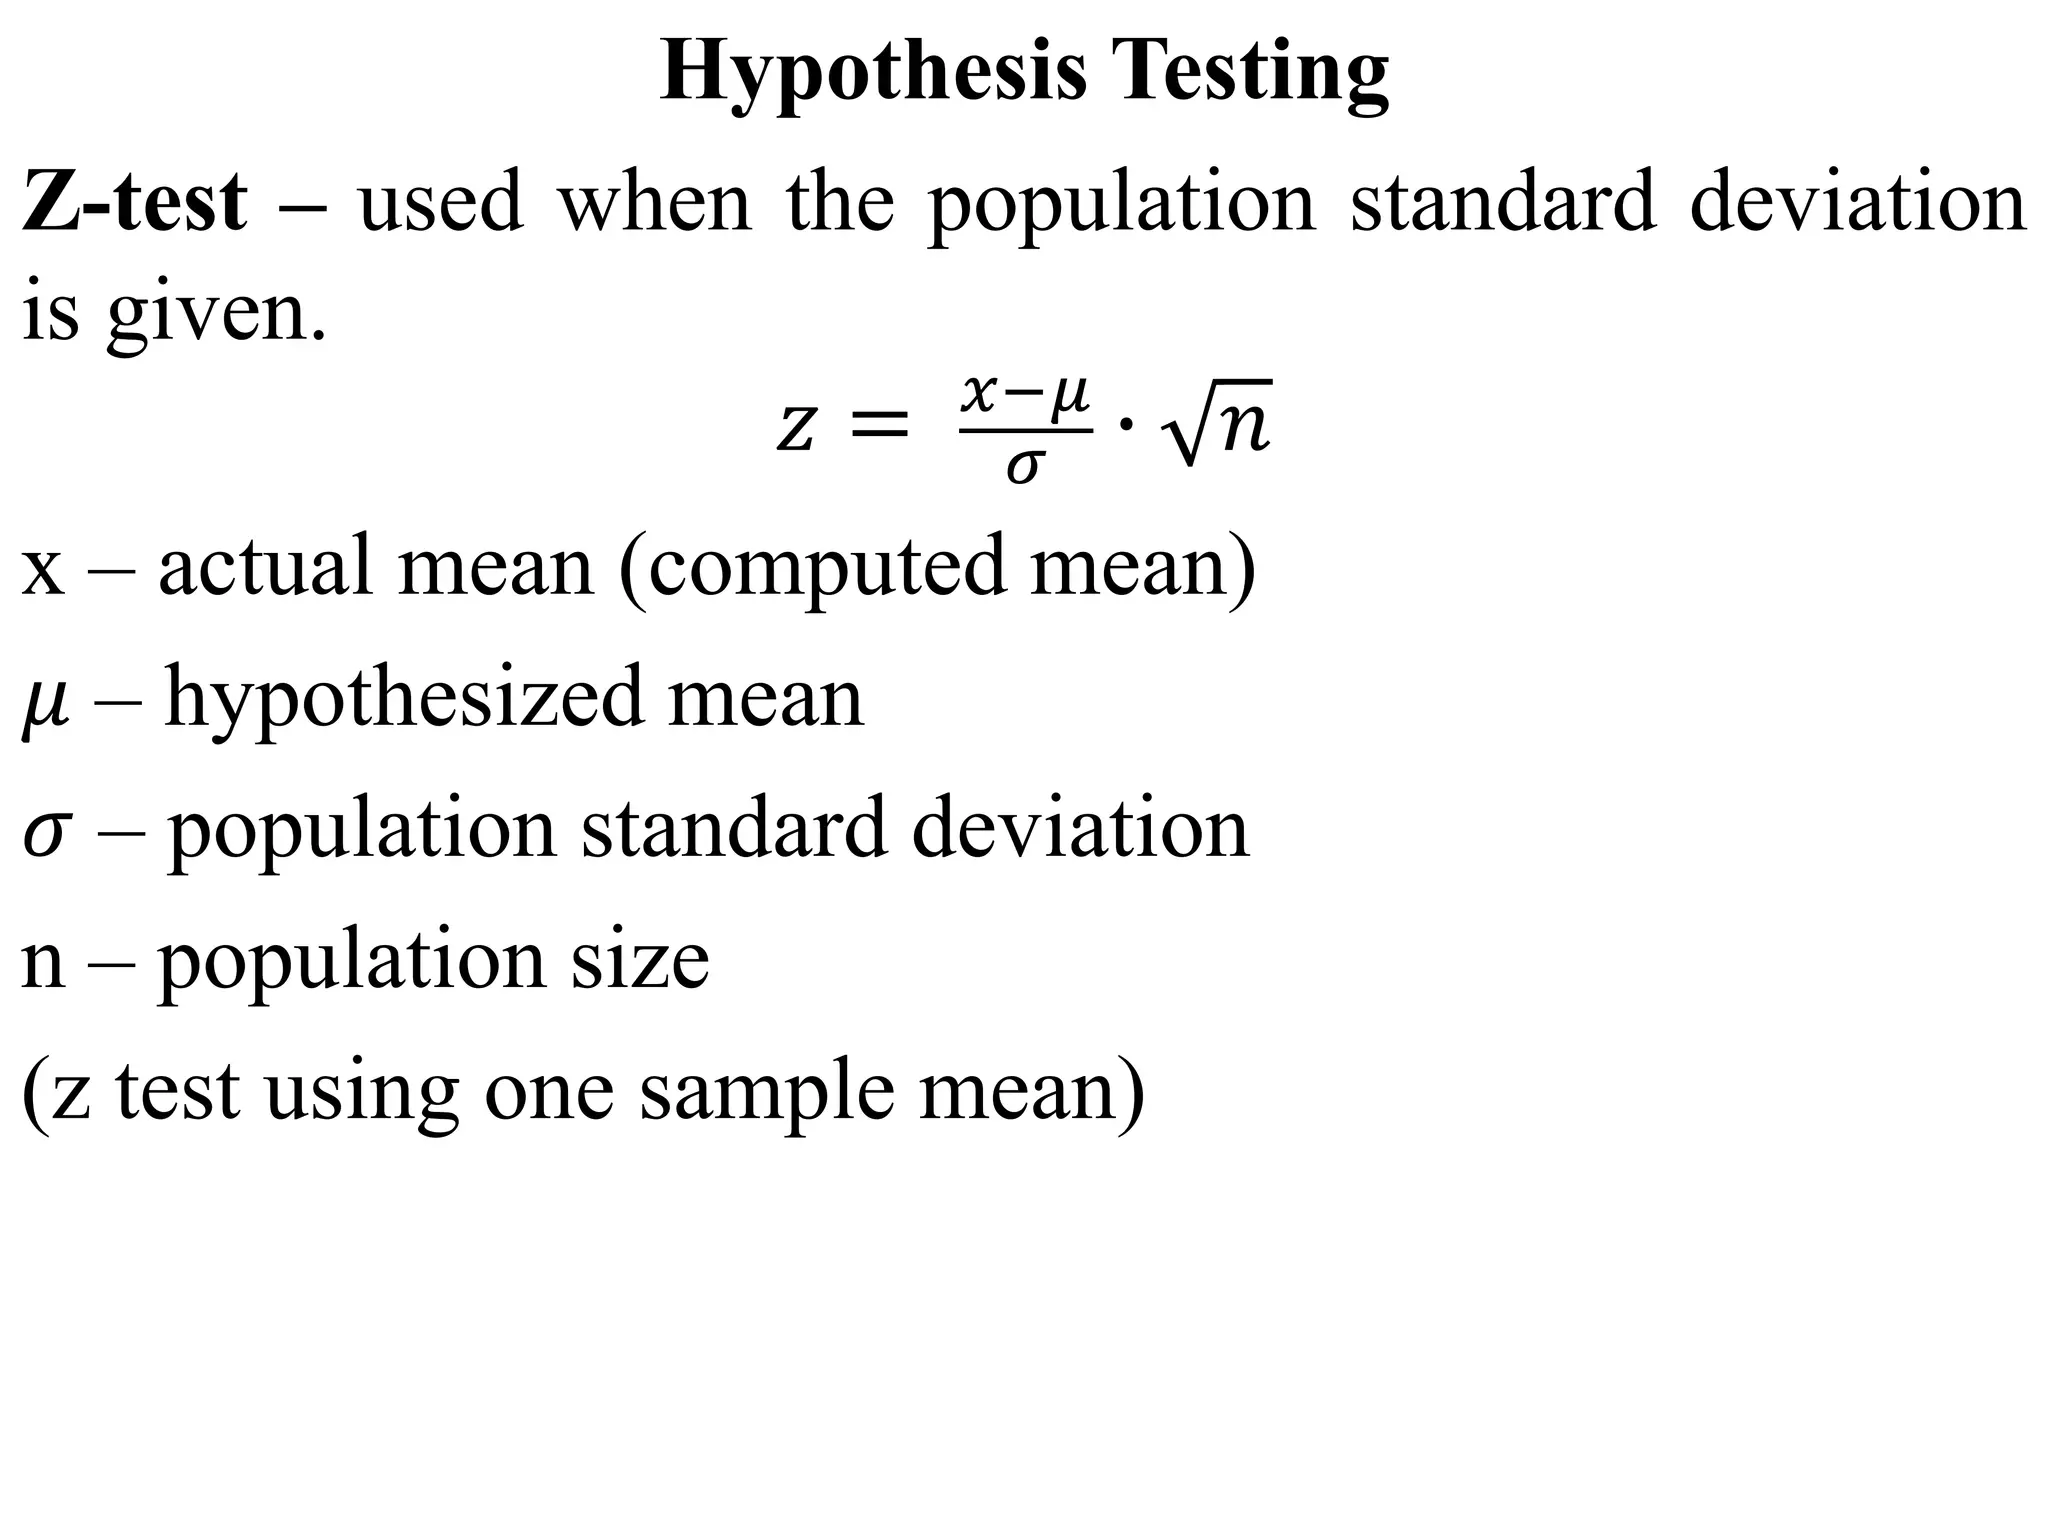
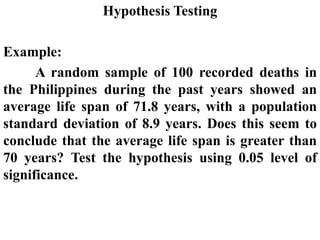
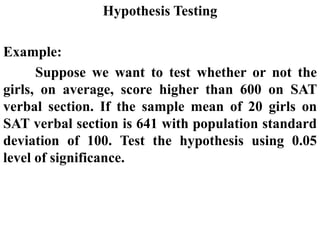
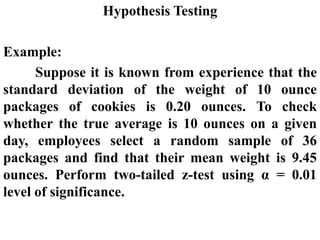
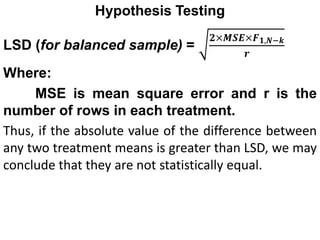
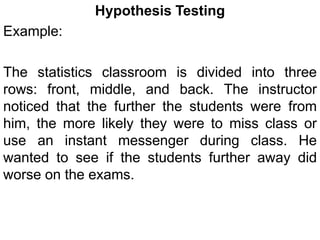
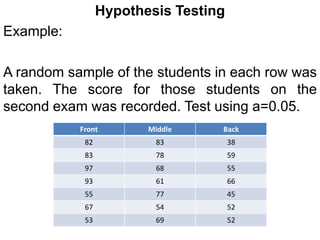
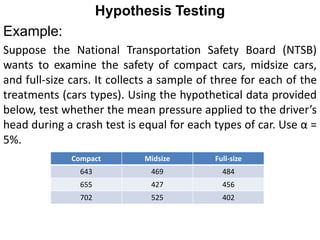
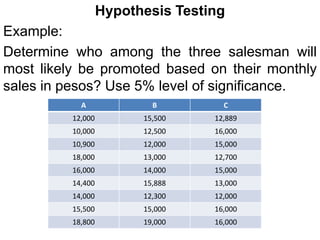
Hypothesis Testing
Z-test – used when the population standard deviation
is given.
𝑧 = 𝑥−𝜇
𝜎
∙ 𝑛
x – actual mean (computed mean)
𝜇 – hypothesized mean
𝜎 – population standard deviation
n – population size
(z test using one sample mean)
Hypothesis Testing
Example:
A random sample of 100 recorded deaths in
the Philippines during the past years showed an
average life span of 71.8 years, with a population
standard deviation of 8.9 years. Does this seem to
conclude that the average life span is greater than
70 years? Test the hypothesis using 0.05 level of
significance.
Hypothesis Testing
Example:
Suppose we want to test whether or not the
girls, on average, score higher than 600 on SAT
verbal section. If the sample mean of 20 girls on
SAT verbal section is 641 with population standard
deviation of 100. Test the hypothesis using 0.05
level of significance.
Hypothesis Testing
Example:
Suppose it is known from experience that the
standard deviation of the weight of 10 ounce
packages of cookies is 0.20 ounces. To check
whether the true average is 10 ounces on a given
day, employees select a random sample of 36
packages and find that their mean weight is 9.45
ounces. Perform two-tailed z-test using α = 0.01
level of significance.
Hypothesis Testing
Example:
According to the website
philbasiceducation.com, the Philippine high
school’s mean percentage score (MPS) in National
Achievement test for mathematics is 46.37% for the
school year 2011-2012 with standard deviation of
10.3%. Aware of this figure, the principal of Isulan
National High School prepared a new mathematics
program for the school year 2012-2013, for grade
10 students to cater improvement in mathematics
education.
Hypothesis Testing
Example:
To validate the principal’s claim that her
program will substantially improve mathematics
teaching, she selected 80 students at random from
grade 10 consisting of 10 sections. The students
undergone the said mathematics program for the
whole year. Now, after the 2012-2013 NAT results,
it was known that the MPS of these 80 students is
50.1%. Based on the data, can the principal
conclude at 0.05 level of significance that the new
program improves the mathematics proficiency of
grade 10 students in INHS?
Hypothesis Testing
Z test using two sample means
𝒛 =
𝒙𝟏 − 𝒙𝟐
(𝒔𝟏)𝟐
𝒏𝟏
+
(𝒔𝟐)𝟐
𝒏𝟐
𝒙𝟏-sample mean for group 1
𝒙𝟐- sample mean for group 2
(𝒔𝟏)𝟐
- sample variance for group 1
(𝒔𝟐)𝟐
- sample variance for group 2
𝒏𝟏 - sample size for group 1
𝒏𝟐 - sample size for group 2
Hypothesis Testing
Example:
A bank is opening a new branch in one of two
town neighborhoods. One of the factors considered
by the bank is whether the average monthly income
(in thousand pesos) in the two neighborhoods
differ. From census records, the bank drew two
random samples of 100 families each and obtained
the following information:
Hypothesis Testing
Example:
Neighborhoods
The bank wishes to test the null hypothesis that the
two neighborhoods have equal mean income. What
should the bank conclude? Test the hypothesis using a
= 0.05.
Sample A Sample B
𝒙𝟏 = 𝟏𝟎, 𝟖𝟎𝟎 𝒙𝟐 = 𝟏𝟎, 𝟑𝟎𝟎
𝒔𝟏 = 𝟑𝟎𝟎 𝒔𝟐 = 𝟒𝟎𝟎
𝒏𝟏 = 𝟏𝟎𝟎 𝒏𝟐 = 𝟏𝟎𝟎
Hypothesis Testing
Example:
The average lifetime of 125 Brand X Alkaline
AA batteries and 130 Brand Y Alkaline AA
batteries were found to be 9.5 hours and 9.2 hours
respectively. Suppose the population standard
deviations of lifetimes are 1.2 hours for brand X
and 1.8 hours for brand Y batteries, test the
hypothesis using 0.05 level of significance.
Hypothesis Testing
F-test Analysis of Variance (ANOVA) for one-
way classification or one-way ANOVA
-The one-way analysis of variance is used to test
the claim that three or more population means
are equal.
-This is an extension of the two independent
samples t-test
-The one-way is because each value is classified
in exactly one way
Examples include comparisons by gender, race,
political party, color, etc.
Hypothesis Testing
The null hypothesis is that the means are all
equal
The alternative hypothesis is that at least one of
the means is different
Think about the Sesame Street® game where
three of these things are kind of the same,
but one of these things is not like the other.
They don’t all have to be different, just one of
them.
Hypothesis Testing
The ANOVA doesn’t test that one mean is less
than another, only whether they’re all equal or at
least one is different.
Hypothesis Testing
𝑑𝑓𝑏 = 𝑘 − 1 Where: N = number of samples
𝑑𝑓𝑤 = 𝑁 − 𝑘 k= number of columns
𝑑𝑓𝑡 = 𝑁 − 1
Hypothesis Testing
Where:
SSB = ( 𝑋𝐴𝑖)2
𝑛𝐴𝑖
−
(𝑋𝑖)2
𝑁
TSS = 𝑋𝑖
2
− ( 𝑋𝑖)2
𝑁
SSW = TSS-SSB
N=sample size
X=observed value
n = number of rows
A=given factor or category
i = individual observation of cell
Hypothesis Testing
Determining Which Mean(s) Is/Are Different
If you fail to reject the null hypothesis in an ANOVA
then you are done. You know, with some level of
confidence, that the treatment means are statistically
equal. However, if you reject the null then you must
conduct a separate test to determine which mean(s)
is/are different.
There are several techniques for testing the
differences between means, but the most common
test is the Least Significant Difference Test.
Hypothesis Testing
LSD (for balanced sample) =
𝟐×𝑴𝑺𝑬×𝑭𝟏,𝑵−𝒌
𝒓
Where:
MSE is mean square error and r is the
number of rows in each treatment.
Thus, if the absolute value of the difference between
any two treatment means is greater than LSD, we may
conclude that they are not statistically equal.
Hypothesis Testing
Example:
The statistics classroom is divided into three
rows: front, middle, and back. The instructor
noticed that the further the students were from
him, the more likely they were to miss class or
use an instant messenger during class. He
wanted to see if the students further away did
worse on the exams.
Hypothesis Testing
Example:
A random sample of the students in each row was
taken. The score for those students on the
second exam was recorded. Test using a=0.05.
Front Middle Back
82 83 38
83 78 59
97 68 55
93 61 66
55 77 45
67 54 52
53 69 52
Hypothesis Testing
Example:
Suppose the National Transportation Safety Board (NTSB)
wants to examine the safety of compact cars, midsize cars,
and full-size cars. It collects a sample of three for each of the
treatments (cars types). Using the hypothetical data provided
below, test whether the mean pressure applied to the driver’s
head during a crash test is equal for each types of car. Use α =
5%.
Compact Midsize Full-size
643 469 484
655 427 456
702 525 402
Hypothesis Testing
Example:
A psychologist was interested in whether different
TV shows lead to a more positive outlook on life.
People were split into 4 groups and then taken to
a room to view a program. The four groups saw:
The Muppet show, Futurama, The News, and No
Program. After the program a blood sample was
taken and serotonin levels measured (remember
more serotonin more happy!)
Hypothesis Testing
Example:
The Muppet show Futurama BBC News No Program
11 4 4 7
7 8 3 7
8 6 2 5
14 11 2 4
11 9 3 3
10 8 6 4
5 4
4
Hypothesis Testing
Example:
Determine who among the three salesman will
most likely be promoted based on their monthly
sales in pesos? Use 5% level of significance.
A B C
12,000 15,500 12,889
10,000 12,500 16,000
10,900 12,000 15,000
18,000 13,000 12,700
16,000 14,000 15,000
14,400 15,888 13,000
14,000 12,300 12,000
15,500 15,000 16,000
18,800 19,000 16,000

hypothesis testing.pptx

  • 1.
    Hypothesis Testing Z-test –used when the population standard deviation is given. 𝑧 = 𝑥−𝜇 𝜎 ∙ 𝑛 x – actual mean (computed mean) 𝜇 – hypothesized mean 𝜎 – population standard deviation n – population size (z test using one sample mean)
  • 2.
    Hypothesis Testing Example: A randomsample of 100 recorded deaths in the Philippines during the past years showed an average life span of 71.8 years, with a population standard deviation of 8.9 years. Does this seem to conclude that the average life span is greater than 70 years? Test the hypothesis using 0.05 level of significance.
  • 3.
    Hypothesis Testing Example: Suppose wewant to test whether or not the girls, on average, score higher than 600 on SAT verbal section. If the sample mean of 20 girls on SAT verbal section is 641 with population standard deviation of 100. Test the hypothesis using 0.05 level of significance.
  • 4.
    Hypothesis Testing Example: Suppose itis known from experience that the standard deviation of the weight of 10 ounce packages of cookies is 0.20 ounces. To check whether the true average is 10 ounces on a given day, employees select a random sample of 36 packages and find that their mean weight is 9.45 ounces. Perform two-tailed z-test using α = 0.01 level of significance.
  • 5.
    Hypothesis Testing Example: According tothe website philbasiceducation.com, the Philippine high school’s mean percentage score (MPS) in National Achievement test for mathematics is 46.37% for the school year 2011-2012 with standard deviation of 10.3%. Aware of this figure, the principal of Isulan National High School prepared a new mathematics program for the school year 2012-2013, for grade 10 students to cater improvement in mathematics education.
  • 6.
    Hypothesis Testing Example: To validatethe principal’s claim that her program will substantially improve mathematics teaching, she selected 80 students at random from grade 10 consisting of 10 sections. The students undergone the said mathematics program for the whole year. Now, after the 2012-2013 NAT results, it was known that the MPS of these 80 students is 50.1%. Based on the data, can the principal conclude at 0.05 level of significance that the new program improves the mathematics proficiency of grade 10 students in INHS?
  • 7.
    Hypothesis Testing Z testusing two sample means 𝒛 = 𝒙𝟏 − 𝒙𝟐 (𝒔𝟏)𝟐 𝒏𝟏 + (𝒔𝟐)𝟐 𝒏𝟐 𝒙𝟏-sample mean for group 1 𝒙𝟐- sample mean for group 2 (𝒔𝟏)𝟐 - sample variance for group 1 (𝒔𝟐)𝟐 - sample variance for group 2 𝒏𝟏 - sample size for group 1 𝒏𝟐 - sample size for group 2
  • 8.
    Hypothesis Testing Example: A bankis opening a new branch in one of two town neighborhoods. One of the factors considered by the bank is whether the average monthly income (in thousand pesos) in the two neighborhoods differ. From census records, the bank drew two random samples of 100 families each and obtained the following information:
  • 9.
    Hypothesis Testing Example: Neighborhoods The bankwishes to test the null hypothesis that the two neighborhoods have equal mean income. What should the bank conclude? Test the hypothesis using a = 0.05. Sample A Sample B 𝒙𝟏 = 𝟏𝟎, 𝟖𝟎𝟎 𝒙𝟐 = 𝟏𝟎, 𝟑𝟎𝟎 𝒔𝟏 = 𝟑𝟎𝟎 𝒔𝟐 = 𝟒𝟎𝟎 𝒏𝟏 = 𝟏𝟎𝟎 𝒏𝟐 = 𝟏𝟎𝟎
  • 10.
    Hypothesis Testing Example: The averagelifetime of 125 Brand X Alkaline AA batteries and 130 Brand Y Alkaline AA batteries were found to be 9.5 hours and 9.2 hours respectively. Suppose the population standard deviations of lifetimes are 1.2 hours for brand X and 1.8 hours for brand Y batteries, test the hypothesis using 0.05 level of significance.
  • 11.
    Hypothesis Testing F-test Analysisof Variance (ANOVA) for one- way classification or one-way ANOVA -The one-way analysis of variance is used to test the claim that three or more population means are equal. -This is an extension of the two independent samples t-test -The one-way is because each value is classified in exactly one way Examples include comparisons by gender, race, political party, color, etc.
  • 12.
    Hypothesis Testing The nullhypothesis is that the means are all equal The alternative hypothesis is that at least one of the means is different Think about the Sesame Street® game where three of these things are kind of the same, but one of these things is not like the other. They don’t all have to be different, just one of them.
  • 13.
    Hypothesis Testing The ANOVAdoesn’t test that one mean is less than another, only whether they’re all equal or at least one is different.
  • 14.
    Hypothesis Testing 𝑑𝑓𝑏 =𝑘 − 1 Where: N = number of samples 𝑑𝑓𝑤 = 𝑁 − 𝑘 k= number of columns 𝑑𝑓𝑡 = 𝑁 − 1
  • 15.
    Hypothesis Testing Where: SSB =( 𝑋𝐴𝑖)2 𝑛𝐴𝑖 − (𝑋𝑖)2 𝑁 TSS = 𝑋𝑖 2 − ( 𝑋𝑖)2 𝑁 SSW = TSS-SSB N=sample size X=observed value n = number of rows A=given factor or category i = individual observation of cell
  • 16.
    Hypothesis Testing Determining WhichMean(s) Is/Are Different If you fail to reject the null hypothesis in an ANOVA then you are done. You know, with some level of confidence, that the treatment means are statistically equal. However, if you reject the null then you must conduct a separate test to determine which mean(s) is/are different. There are several techniques for testing the differences between means, but the most common test is the Least Significant Difference Test.
  • 17.
    Hypothesis Testing LSD (forbalanced sample) = 𝟐×𝑴𝑺𝑬×𝑭𝟏,𝑵−𝒌 𝒓 Where: MSE is mean square error and r is the number of rows in each treatment. Thus, if the absolute value of the difference between any two treatment means is greater than LSD, we may conclude that they are not statistically equal.
  • 18.
    Hypothesis Testing Example: The statisticsclassroom is divided into three rows: front, middle, and back. The instructor noticed that the further the students were from him, the more likely they were to miss class or use an instant messenger during class. He wanted to see if the students further away did worse on the exams.
  • 19.
    Hypothesis Testing Example: A randomsample of the students in each row was taken. The score for those students on the second exam was recorded. Test using a=0.05. Front Middle Back 82 83 38 83 78 59 97 68 55 93 61 66 55 77 45 67 54 52 53 69 52
  • 20.
    Hypothesis Testing Example: Suppose theNational Transportation Safety Board (NTSB) wants to examine the safety of compact cars, midsize cars, and full-size cars. It collects a sample of three for each of the treatments (cars types). Using the hypothetical data provided below, test whether the mean pressure applied to the driver’s head during a crash test is equal for each types of car. Use α = 5%. Compact Midsize Full-size 643 469 484 655 427 456 702 525 402
  • 21.
    Hypothesis Testing Example: A psychologistwas interested in whether different TV shows lead to a more positive outlook on life. People were split into 4 groups and then taken to a room to view a program. The four groups saw: The Muppet show, Futurama, The News, and No Program. After the program a blood sample was taken and serotonin levels measured (remember more serotonin more happy!)
  • 22.
    Hypothesis Testing Example: The Muppetshow Futurama BBC News No Program 11 4 4 7 7 8 3 7 8 6 2 5 14 11 2 4 11 9 3 3 10 8 6 4 5 4 4
  • 23.
    Hypothesis Testing Example: Determine whoamong the three salesman will most likely be promoted based on their monthly sales in pesos? Use 5% level of significance. A B C 12,000 15,500 12,889 10,000 12,500 16,000 10,900 12,000 15,000 18,000 13,000 12,700 16,000 14,000 15,000 14,400 15,888 13,000 14,000 12,300 12,000 15,500 15,000 16,000 18,800 19,000 16,000