Download to read offline


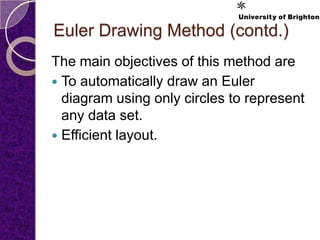
![Euler Drawing Method
The circle based drawing method for
producing Euler diagram was recently
devised by Stapleton et al. [1].
The three different colors are described
as different zones in the abstract
description.
Figure: Euler diagram generated](https://image.slidesharecdn.com/presentation-mithileyshsathiyanarayananan-130712125117-phpapp02/85/Automatic-Visualization-of-Grouped-Networks-9-320.jpg)
![Graph Drawing Method
One of the old and traditional graph
drawing method is Force-Directed
Layouts method [2].
The force-directed algorithm is based
on the physical model of attraction and
repulsion.
Figure: Left handed diagram has edge-crossings in graph and
right handed diagram has avoided edge-crossings in graph.](https://image.slidesharecdn.com/presentation-mithileyshsathiyanarayananan-130712125117-phpapp02/85/Automatic-Visualization-of-Grouped-Networks-11-320.jpg)


This document summarizes a research presentation on automatically visualizing grouped networks. The presentation discusses combining Euler diagram and graph drawing methods. Specifically, it aims to improve analysis of grouped network data like Facebook by automatically generating visualizations. The researcher plans to develop a novel layout method and open source software to efficiently draw graphs and Euler diagrams together. This combined approach could have wide applications in social network analysis, communication networks, and medical analysis. An example visualization of Facebook connections is provided to illustrate the expected results.