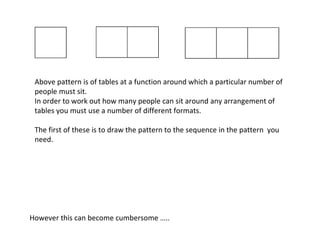
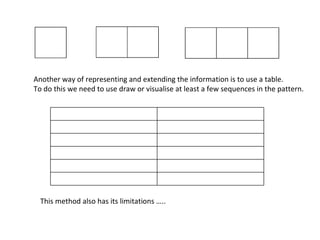
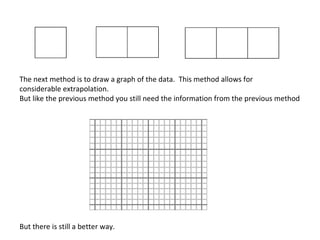
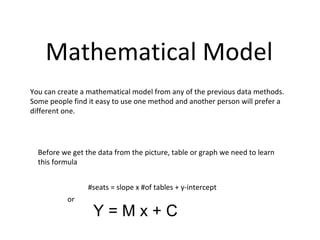
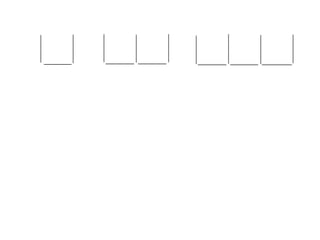
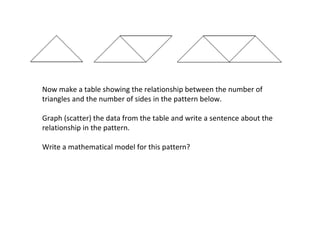
This document discusses different methods for representing patterns of tables and seating arrangements mathematically, including drawing the pattern, using a table, using a graph, and developing a mathematical model. It explains that a mathematical model can be created from any of these previous representation methods using the formula for a linear relationship, Y = Mx + C, where M is the slope and C is the y-intercept. An example of using this process to model a pattern of increasing numbers of tables and seats is provided.