This document provides guidance on laying out presentation boards for architectural projects. It discusses organizing content with a grid, using visual hierarchy through scale and proportion, establishing rhythm, choosing fonts, aligning related drawings, leaving white space, and includes examples of competition boards. Key recommendations include using a basic grid, arranging elements by importance, limiting fonts and sizes, and aligning plans and sections at the same scale.
The following presentation includes the case studies of different residential buildings. It was done by students of Pulchowk campus, Nepal in 2nd year.
it includes the form and functional aspects of residential buildings and how can we develop concepts. also it includes topics like site forces and how they have effects in design process.
A very shortcut presentation, not entirely complete though, but felt like sharing it.
A small group presentation we had to make on Tropical Architecture when we where in year 4 of Architecture College.
Introduction to working drawings course for architects and interior designers.
it contains 3 main parts:
1-general introduction to the course and its objectives and importance,
2-guide lines for plan drawings for beginners,
3-introduction to NCS.
Steel Windows
Steel windows provide good quality, strength, security and elegance Steel windows are very energy efficient and have a much better thermal efficiency than aluminum.
Dhajji dewari (Persian for “patch quilt wall”) is a traditional building type found in the western
Himalayas. Such houses are found in both the Pakistan and Indian Administered Kashmir. This
form of construction is also referred to in the Indian Standard Codes as brick nogged timber
frame construction. Dhajji most commonly (but not exclusively) consists of a braced timber
frame. The spaces left between the bracing and/or frames is filled with a thin wall (single wythe)
of stone or brick masonry traditionally laid into mud mortar. Completed walls are plastered in
mud mortar. They are typically founded on shallow foundations made from stone masonry.
User Interface that works | Sergiu Puscas | CodeWeek 2015YOPESO
Polish your UI knowledge regarding:
- Elements and Principles of UI
- Functional Layout Design
- Web UI Patterns
- Mobile UI Patterns
- Real World Examples
- Q&A
Check the video here:
https://www.youtube.com/watch?v=eNvp8Vv9t5k
Blake Echols, Senior Graphic Designer
Get a briefing on design best practices for direct marketing fundraising. Blake will share pointers on design elements to keep in mind, direct mail and digital requirements to adhere to, and how to effectively convey your visual creative concepts.
This is a brief presentation detailing the functions of such characteristics within the flat plan template for my G321 magazine product as well as of course the flat plan itself.
Seven Habits of Highly Effective Designers - IAP 2014DUSPviz
Presentation and workshop on Design Fundamentals and Poster Creation, January 2014, MIT DUSP - special focus on event poster creation.
January 15, 2014
duspviz@mit.edu
Presenter: Michael Foster (@mjfoster83)
Presentation is licensed under a CC-BY-SA 3.0 license: http://creativecommons.org/licenses/by-sa/3.0/. Significant contributors to this work include Michael Foster (@mjfoster83), Chris Rhie (@chris_rhie), and Annemarie Gray (@annemariegray).
Poster Presentation· You are required to present your research.docxstilliegeorgiana
Poster Presentation
· You are required to present your research in the form of a poster to interested parties
The Poster should be:
· Visually striking
· Handmade or printed
· Approx. 1,000 words of text, tables, graphs and pictures or illustrations
· Balance of images and text
· You should include the following:
· Title of project
· Research aims/ questions
· Methodology
· Findings
· Discussion/Conclusion (Limitations/Implications)
· References (Mentioned in poster)
· FONT AND SIZE:
· The font size you should use is dependent on the size of the poster. As a rough guideline:
· A0/A1 posters use a body text size of 24+, headings should be 48+.
· A3 posters might use size 14+ for body text and 34+ for headings.
TIPS ON POSTER:
· Analyse Task – academic posters are often based upon larger bodies of work, but the task of creating a poster itself needs to be carefully considered. Questions to be asked might include:
· What is the main message you are trying to convey?
· What is the purpose of the poster?
· Who is your target audience – specialists or a more general audience?
· Research – if your poster is based on another piece of work this will already have been done to some extent, but if not you may need to locate relevant sources, read background information and make notes.
· Plan content – the purpose of your poster will influence the content and the structure of the content. A typical research poster may include some of the following sections:
· Title
· Introduction
· Methods/Methodology
· Results
· Discussion
· Conclusion
· References
TEMPLATE
Library & Information Services have produced an A3 (more sizes coming soon) poster template that can be customised to suit your needs. It can be a good starting point for creating an academic poster, but it is only a suggested layout; you are encouraged to customise it to suit your needs.
The template can be downloaded from the Resources page of the IT Training website: study.cardiffmet.ac.uk/Help/Training/
LAYOUT:
· Use headings to group text – this makes your poster easier to read and digest.
· Format your headings in a consistent way – this creates a sense of unity and helps structure your content visually.
· Structure your content in a logical way –content neatly aligned into columns creates a visual narrative for your reader; they will tend to read down then across:
· Use white space and margins – plenty of white space makes your poster easier to read and improves the signal-to-noise ratio (the signal is your message, noise is anything that prevents your message from getting through, such as an abundance of text or unnecessary graphical elements).
Margins give your text space to breath and can act as delimiters for the different sections of your poster.
· Sketch your poster before you begin to design it – a pencil and paper sketch of the poster’s layout may help you when creating the final design.
Designing Academic Posters
How-To Guide
This guide accompani ...
Let's dive deeper into the world of ODC! Ricardo Alves (OutSystems) will join us to tell all about the new Data Fabric. After that, Sezen de Bruijn (OutSystems) will get into the details on how to best design a sturdy architecture within ODC.
Builder.ai Founder Sachin Dev Duggal's Strategic Approach to Create an Innova...Ramesh Iyer
In today's fast-changing business world, Companies that adapt and embrace new ideas often need help to keep up with the competition. However, fostering a culture of innovation takes much work. It takes vision, leadership and willingness to take risks in the right proportion. Sachin Dev Duggal, co-founder of Builder.ai, has perfected the art of this balance, creating a company culture where creativity and growth are nurtured at each stage.
UiPath Test Automation using UiPath Test Suite series, part 3DianaGray10
Welcome to UiPath Test Automation using UiPath Test Suite series part 3. In this session, we will cover desktop automation along with UI automation.
Topics covered:
UI automation Introduction,
UI automation Sample
Desktop automation flow
Pradeep Chinnala, Senior Consultant Automation Developer @WonderBotz and UiPath MVP
Deepak Rai, Automation Practice Lead, Boundaryless Group and UiPath MVP
The Art of the Pitch: WordPress Relationships and SalesLaura Byrne
Clients don’t know what they don’t know. What web solutions are right for them? How does WordPress come into the picture? How do you make sure you understand scope and timeline? What do you do if sometime changes?
All these questions and more will be explored as we talk about matching clients’ needs with what your agency offers without pulling teeth or pulling your hair out. Practical tips, and strategies for successful relationship building that leads to closing the deal.
Essentials of Automations: Optimizing FME Workflows with ParametersSafe Software
Are you looking to streamline your workflows and boost your projects’ efficiency? Do you find yourself searching for ways to add flexibility and control over your FME workflows? If so, you’re in the right place.
Join us for an insightful dive into the world of FME parameters, a critical element in optimizing workflow efficiency. This webinar marks the beginning of our three-part “Essentials of Automation” series. This first webinar is designed to equip you with the knowledge and skills to utilize parameters effectively: enhancing the flexibility, maintainability, and user control of your FME projects.
Here’s what you’ll gain:
- Essentials of FME Parameters: Understand the pivotal role of parameters, including Reader/Writer, Transformer, User, and FME Flow categories. Discover how they are the key to unlocking automation and optimization within your workflows.
- Practical Applications in FME Form: Delve into key user parameter types including choice, connections, and file URLs. Allow users to control how a workflow runs, making your workflows more reusable. Learn to import values and deliver the best user experience for your workflows while enhancing accuracy.
- Optimization Strategies in FME Flow: Explore the creation and strategic deployment of parameters in FME Flow, including the use of deployment and geometry parameters, to maximize workflow efficiency.
- Pro Tips for Success: Gain insights on parameterizing connections and leveraging new features like Conditional Visibility for clarity and simplicity.
We’ll wrap up with a glimpse into future webinars, followed by a Q&A session to address your specific questions surrounding this topic.
Don’t miss this opportunity to elevate your FME expertise and drive your projects to new heights of efficiency.
Key Trends Shaping the Future of Infrastructure.pdfCheryl Hung
Keynote at DIGIT West Expo, Glasgow on 29 May 2024.
Cheryl Hung, ochery.com
Sr Director, Infrastructure Ecosystem, Arm.
The key trends across hardware, cloud and open-source; exploring how these areas are likely to mature and develop over the short and long-term, and then considering how organisations can position themselves to adapt and thrive.
Epistemic Interaction - tuning interfaces to provide information for AI supportAlan Dix
Paper presented at SYNERGY workshop at AVI 2024, Genoa, Italy. 3rd June 2024
https://alandix.com/academic/papers/synergy2024-epistemic/
As machine learning integrates deeper into human-computer interactions, the concept of epistemic interaction emerges, aiming to refine these interactions to enhance system adaptability. This approach encourages minor, intentional adjustments in user behaviour to enrich the data available for system learning. This paper introduces epistemic interaction within the context of human-system communication, illustrating how deliberate interaction design can improve system understanding and adaptation. Through concrete examples, we demonstrate the potential of epistemic interaction to significantly advance human-computer interaction by leveraging intuitive human communication strategies to inform system design and functionality, offering a novel pathway for enriching user-system engagements.
UiPath Test Automation using UiPath Test Suite series, part 4DianaGray10
Welcome to UiPath Test Automation using UiPath Test Suite series part 4. In this session, we will cover Test Manager overview along with SAP heatmap.
The UiPath Test Manager overview with SAP heatmap webinar offers a concise yet comprehensive exploration of the role of a Test Manager within SAP environments, coupled with the utilization of heatmaps for effective testing strategies.
Participants will gain insights into the responsibilities, challenges, and best practices associated with test management in SAP projects. Additionally, the webinar delves into the significance of heatmaps as a visual aid for identifying testing priorities, areas of risk, and resource allocation within SAP landscapes. Through this session, attendees can expect to enhance their understanding of test management principles while learning practical approaches to optimize testing processes in SAP environments using heatmap visualization techniques
What will you get from this session?
1. Insights into SAP testing best practices
2. Heatmap utilization for testing
3. Optimization of testing processes
4. Demo
Topics covered:
Execution from the test manager
Orchestrator execution result
Defect reporting
SAP heatmap example with demo
Speaker:
Deepak Rai, Automation Practice Lead, Boundaryless Group and UiPath MVP
Smart TV Buyer Insights Survey 2024 by 91mobiles.pdf91mobiles
91mobiles recently conducted a Smart TV Buyer Insights Survey in which we asked over 3,000 respondents about the TV they own, aspects they look at on a new TV, and their TV buying preferences.
Search and Society: Reimagining Information Access for Radical FuturesBhaskar Mitra
The field of Information retrieval (IR) is currently undergoing a transformative shift, at least partly due to the emerging applications of generative AI to information access. In this talk, we will deliberate on the sociotechnical implications of generative AI for information access. We will argue that there is both a critical necessity and an exciting opportunity for the IR community to re-center our research agendas on societal needs while dismantling the artificial separation between the work on fairness, accountability, transparency, and ethics in IR and the rest of IR research. Instead of adopting a reactionary strategy of trying to mitigate potential social harms from emerging technologies, the community should aim to proactively set the research agenda for the kinds of systems we should build inspired by diverse explicitly stated sociotechnical imaginaries. The sociotechnical imaginaries that underpin the design and development of information access technologies needs to be explicitly articulated, and we need to develop theories of change in context of these diverse perspectives. Our guiding future imaginaries must be informed by other academic fields, such as democratic theory and critical theory, and should be co-developed with social science scholars, legal scholars, civil rights and social justice activists, and artists, among others.
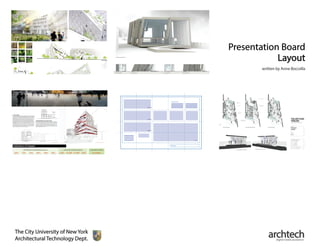
1. project info
plan 3
plan 2
plan 1
section
title bar
written by Anne Boccella
The City University of New York
Architectural Technology Dept. digital media assistance
archtech
Presentation Board
Layout
2. 1. Before You Begin...
• Organize yourself. What
is your argument or what
main idea do you want your
presentation to convey?
What drawings, images, and
information (text) best support
this argument?
Gather this information and
outline the points you will
cover. This will help guide
how your board should be
organized.
You want the content that you
select to speak for itself, so
choose your best work. This
doesn’t mean that processes
sketches aren’t important.
Just make sure everything
is neat, scanned at a good
resolution (approx. 200 dpi),
and touched up in Photoshop
if needed.
Presentation Board Layout2
3. • A grid helps you organize
visual elements on the page.
These elements may be
drawings, images, diagrams,
or text. Grids can range from
complex to very neat and
straightforward.
Decide on an appropriate
page size. Will you have one
or more pages? If more, it
might make sense to have
a repeating title bar with
your name and any other
pertinent information. This
title bar should appear in the
same place on each page
for consistency throughout
your presentation. Creating a
master page in InDesign can
help achieve such continuity. 36 in.
2 in.margin
horizontal grid line
with a 1/4 in. gutter
space in between.
Title bar - the content is up to you.
Maybe this includes your info or maybe
this describes what the board is about.
24 in.
0.5 in.
margin
vertical grid line
with 1/4 in.gutter.
YOURNAME
CLASS TITLE | PROFESSOR | DATE
This 36 x 24 page is organized with a
basic grid with 6 columns and 5 rows.
The bottom margin is larger than the
top and sides, allowing for a title bar
that repeats on each page.
Presentation Board Layout3
2. Layout Essentials.
The Grid.
4. •The concept of hierarchy
should be considered when
laying out your board. That is,
certain drawings or images
should receive more (or
less) visual attention. This
emphasis or de-emphasis
can help better communicate
your idea. When viewing
your presentation board,
there should be something
to discover from a distance,
from 6 feet away, and from up
close.
When you gather your
material, arrange your
drawings, images, and text in
order of importance.
Sketch out some possible
organizations depending
on the content that you’ve
selected.
This exercise will focus on
creating hierarchy by playing
with scale. However, we will
discuss other ways to create
hierarchy in a layout.
Think about proportion,
scale, and balance. The
same concepts that you
employ when designing
architecture are important
when laying out your
boards.
project info
plan 3
plan 2
plan 1
section
rendering
rendering
imageimage
main diagram
diagram 4
diagram 3
diagram 2
diagram 1
title bar
titlebar
Presentation Board Layout4
2. Layout Essentials
Visual Hierarchy.
5. • Just as a rhythm or pattern
can stimulate a work of art or
music, visual rhythm can also
create order or stimulation.
Grids help create the
structure for a visual rhythm.
Presentation Board Layout5
2. Layout Essentials
Rhythm
6. With so many typeface
designs, the task of choosing
the right typeface can seem a
design challenge in itself.
There are two main
classifications of typefaces:
Serifs and Sans-serif. Serif
typefaces contain semistructural
details called serifs at the end
of some of the letter strokes.
A typeface without these
details is called sans-serif.
Within these two categories
exist a range of fonts.
• Which one is right for
architecture?
Many architects gravitate
towards the simplicity and
clean lines of Sans-serif fonts.
However, selecting your font
depends on the nature of
the content being presented.
The personality of the letters
should correspond with your
presentation style, while not
overpowering the content.
Keep it simple!
sans serif
serif
serifs (in red)
S ERIF FACES
Baskerville
Garamond
Palatino
Times New Roman
S ANS SERIF FACES
Franklin Gothic
Gill Sans
Helvetica
Swis721
Presentation Board Layout6
3. The Truth about Text
7. • How many fonts?
One font is usually sufficient.
Two can be used at the most.
It is wise to select a typeface
that belongs to a larger type
family. That way, you can
consistently use the regular
version and use the bold
version when emphasis is
needed. However, if you do
select more than one font, the
font matrix to the right may
help.
• What font size is ok?
Similar to limiting the amount
of fonts you choose, you
should also limit the size of
fonts to two or three different
sizes. That is, set a size to
be used for titles, text, and
captions, for example. Titles
should be visible from a
distance. Text and captions
may require a closer view.
There is no foolproof way to
predict your font sizes except
to practice and print out in
advance. Avoid huge font
sizes that take away from
your content.
8.5 in.8.5 in.34 in.
11 in.22 in.
reduce by 50%
Quick tip: If you design your
presentation board at 34 x 22,
you can reduce it by 50% to
achieve two 8.5 x 11 pages for
your portfolio. This is also a way to
gauge your font size.
This font matrix can help when
combining two fonts. The most
important consideration is contrast:
serif with sanserif, Roman with
script, heavy with light, thick with
thin, simple with ornamental.
Presentation Board Layout7
3. Text
(contiued)
presentation board 2 facing portfolio pages
8. Presentation boards for
architectural drawings need
to clearly communicate
specific information relative to
architecture. It’s important to
keep the following in mind:
• Drawing Relationships
Architectural drawings such
as sections and plans should
be aligned and coordinated.
Plans and sections should
be aligned vertically and of
the same scale. This should
be the case regarding scale
unless you want one drawing
to receive more/less attention.
• Visual Gravity
Extending the ground of
sections at the bottom of the
page can offer visual gravity
or weight to the layout.
• Symbols
Symbols such as the North
arrow, a scale indicator, and
arrows/leaders should be
included to clarify drawings.
The Belvedere
plan and section
De8 architetti
The drawings to the left are vertically aligned and
of the same scale so that drawings are able to
reference one another accurately.
The sections are
horizontally aligned
and of the same scale.
If placed at the bottom
of the page, they are
grounded by visual
gravity.
Office for Metropolitan Architecture
Presentation Board Layout8
4. Architecture Specific
8
9. • Competition entry for the
Art Fund Pavilion by 3SixO
Architecture.
Note how the next four boards are organized as
an entire composition. The title bar on the right
hand offers a consistent space for information.
Images are of various sizes, exhibiting a level of
hierarchy to keep the viewer’s interest. Sectional
drawings, which are clearly aligned, anchor the
page at the bottom.
Note the nice use of white space - images
are sparsely arranged so that the page is not
“choked” with visual information. However, key
information is always present, such as the site
map with its corresponding North arrow.
Presentation Board Layout9
5. Examples
10. Presentation Board Layout10
• Competition entry for the
Art Fund Pavilion by 3SixO
Architecture.
5. Examples
(contiued)
11. Presentation Board Layout11
• Competition entry for the
Art Fund Pavilion by 3SixO
Architecture.
5. Examples
(contiued)
12. Presentation Board Layout12
• Competition entry for the
Art Fund Pavilion by 3SixO
Architecture.
5. Examples
(contiued)
13. • Competition board from the
9/11 memorial designs.
Presentation Board Layout13
5. Examples
(contiued)
15. •Layout Essentials: 100
Design Principles for Using
Grids by Beth Tondreau
•Making and Breaking the
Grid: A Graphic Design Layout
Workshop by Timothy Samara
Presentation Board Layout15
6. Resources