Download to read offline
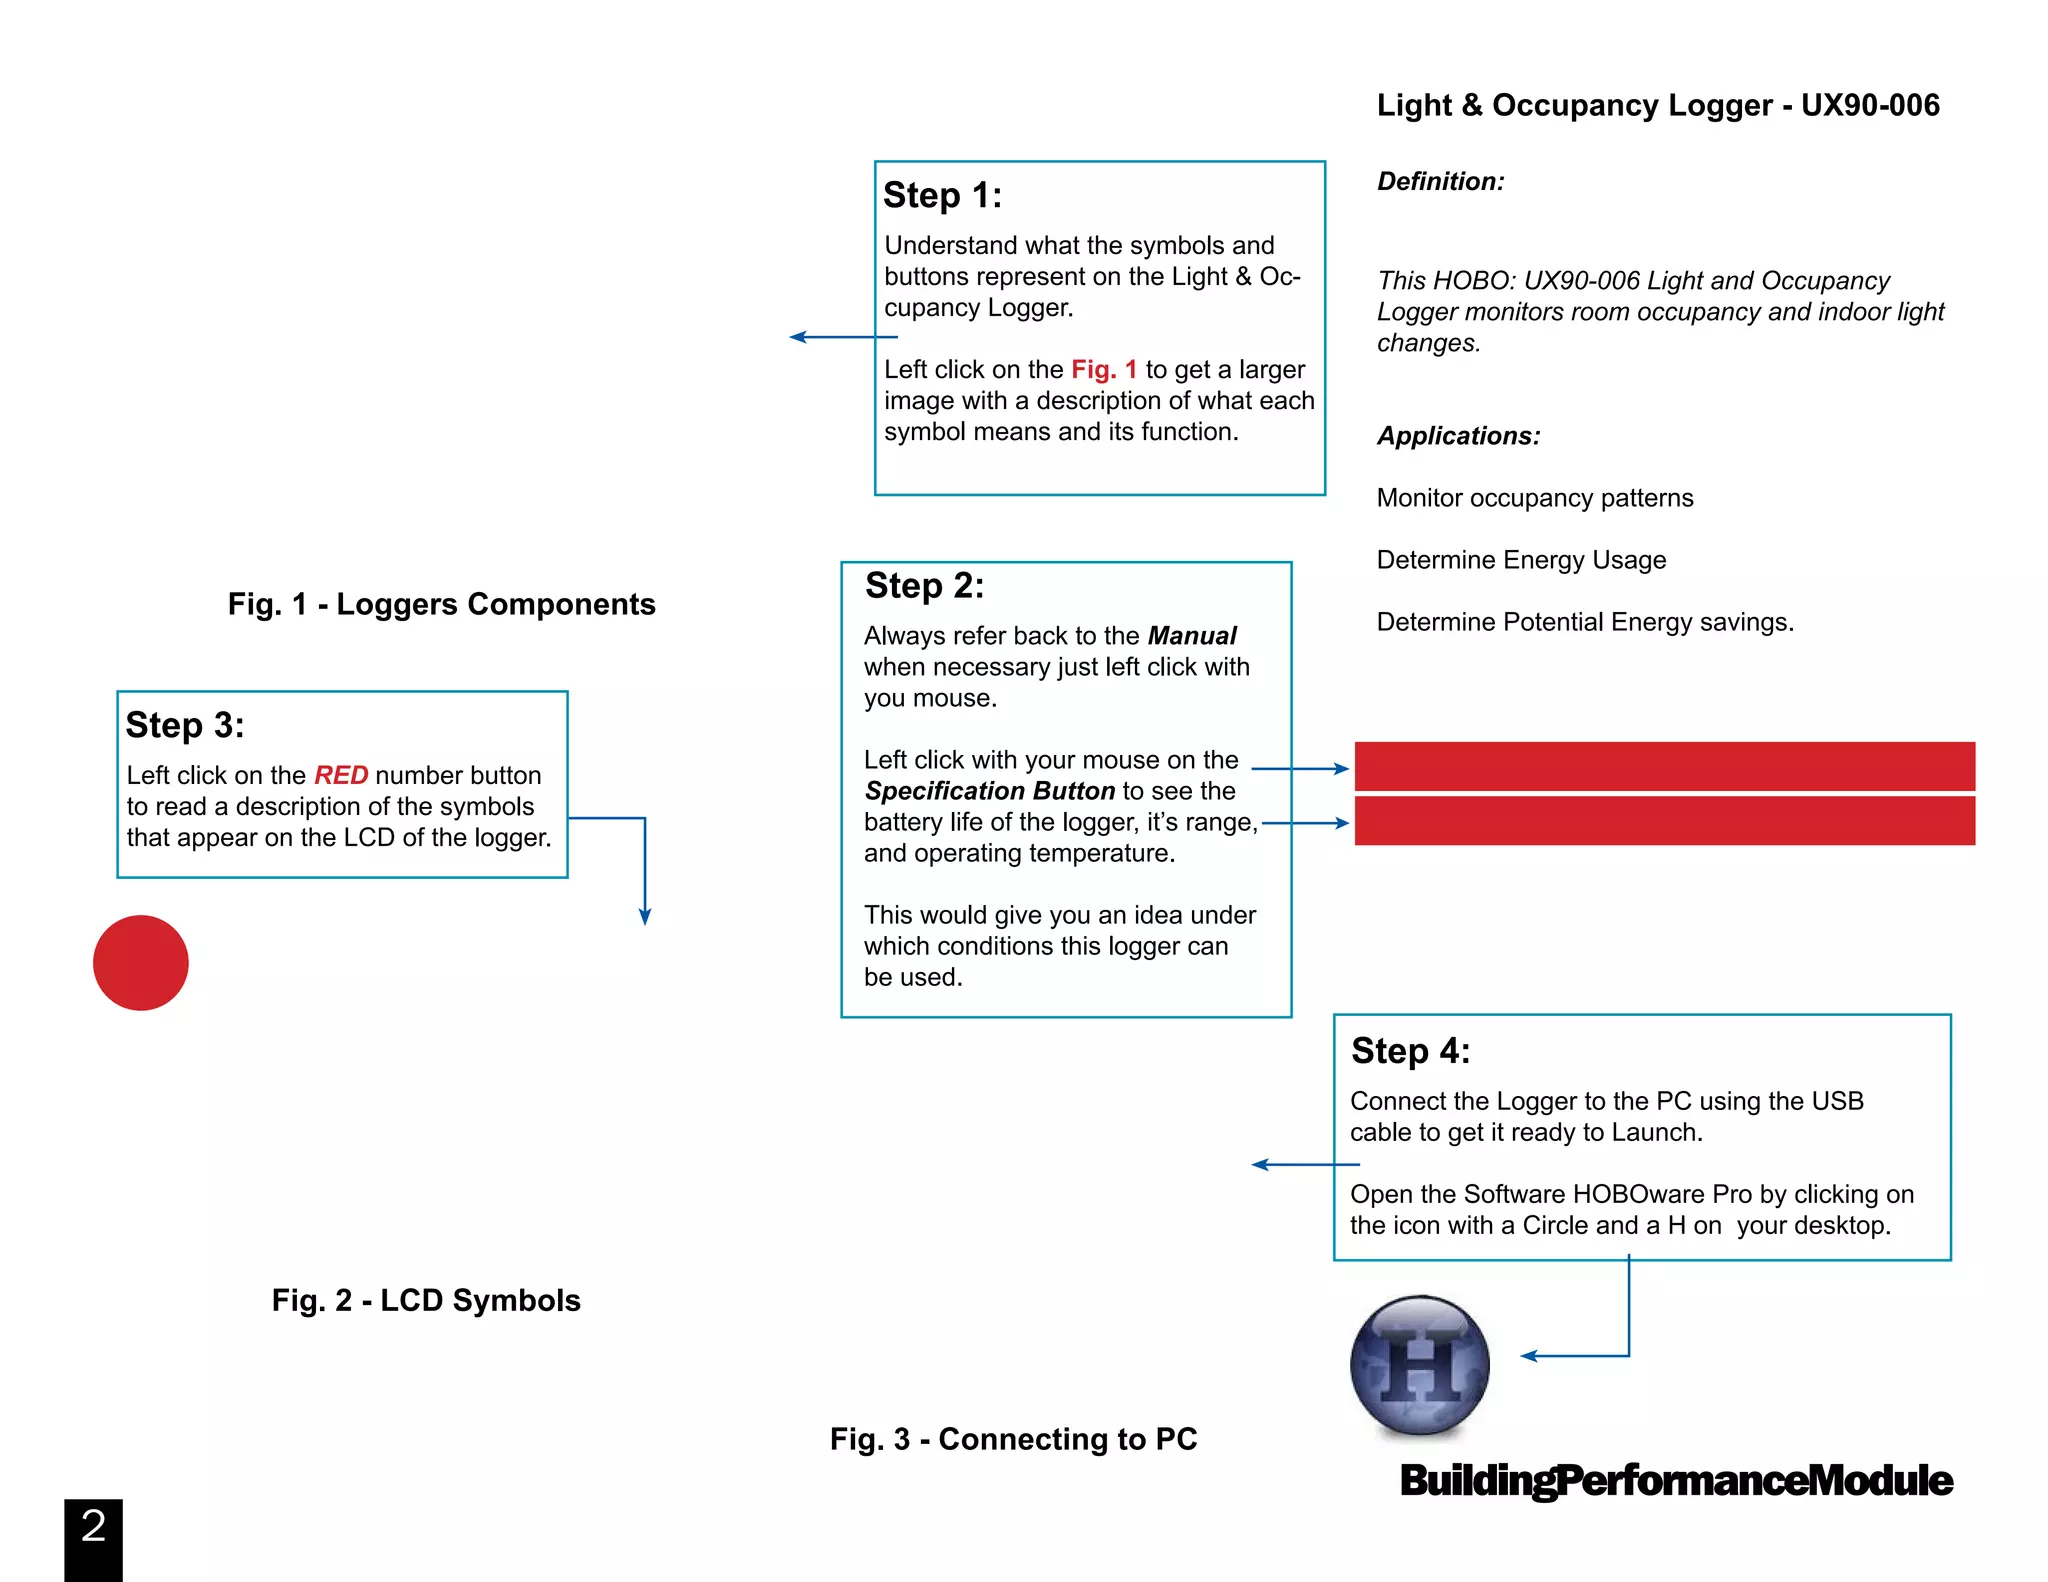

This document provides instructions for using an Onset HOBO UX90-006 Light and Occupancy Logger. It describes the logger's components, specifications, how to launch it to start collecting data, configure the logger settings, check its status, download the collected data, view the data graphs and export the data to CSV format. The logger monitors room occupancy and light levels and can be used to analyze occupancy patterns and energy usage.