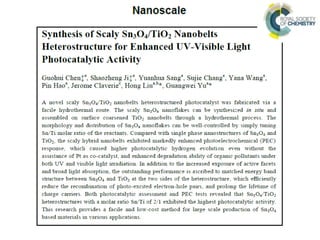
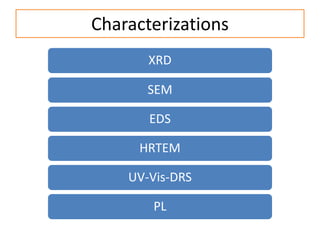
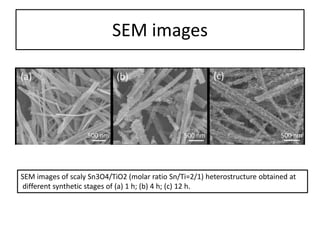
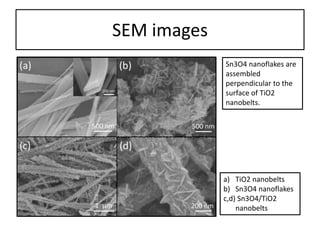
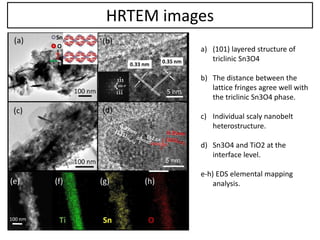
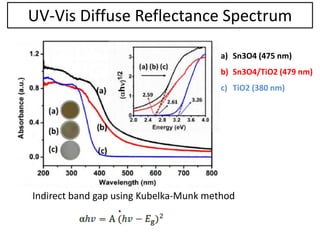
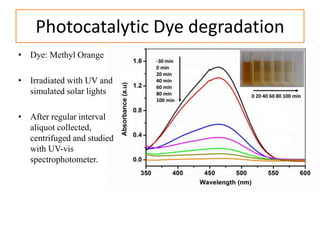
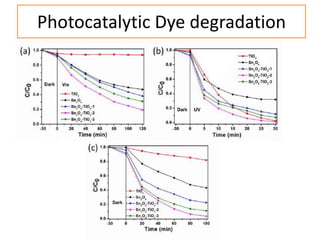
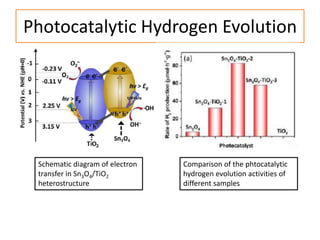
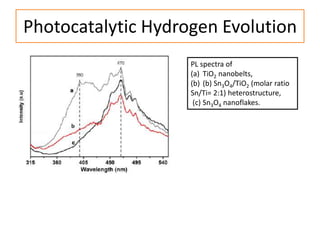
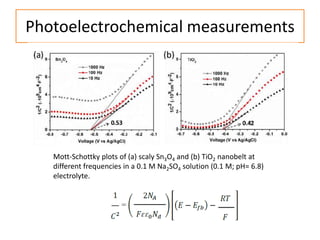
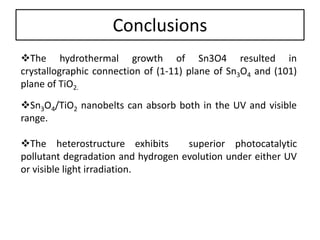
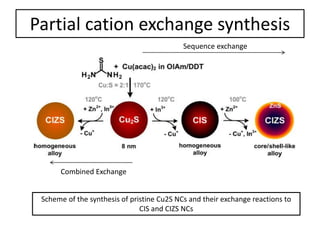
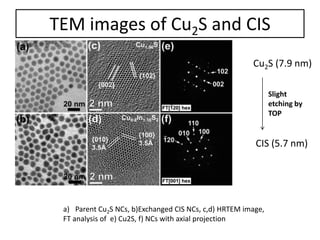
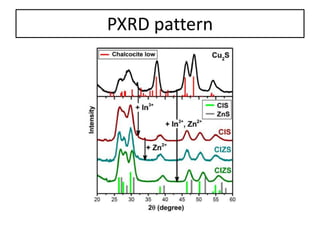
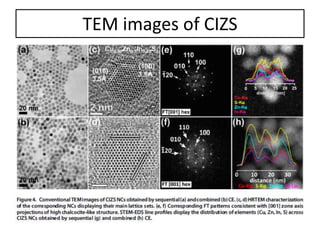
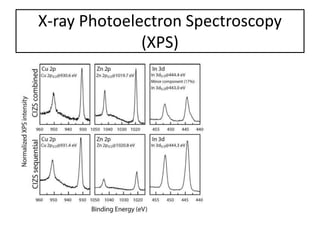
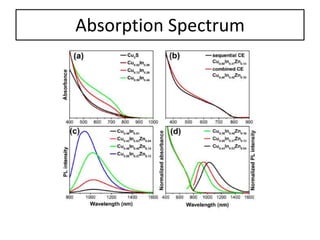
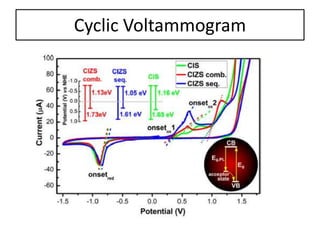
Literature Presentation
14th Jan 2015
By Saurav Chandra Sarma
Characterizations
XRD
SEM
EDS
HRTEM
UV-Vis-DRS
PL
Schematic illustration of the
synthesis process
XRD patterns of
a) Pure TiO2 nanobelt
b) Scaly Sn3O4 nanoflakes
c) Sn3O4/TiO2
•Molar ratio Sn/Ti=2/1
•TiO2 is in anatase phase
•Sn3O4 has triclinic phase
SEM images
SEM images of scaly Sn3O4/TiO2 (molar ratio Sn/Ti=2/1) heterostructure obtained at
different synthetic stages of (a) 1 h; (b) 4 h; (c) 12 h.
SEM images
a) TiO2 nanobelts
b) Sn3O4 nanoflakes
c,d) Sn3O4/TiO2
nanobelts
Sn3O4 nanoflakes are
assembled
perpendicular to the
surface of TiO2
nanobelts.
HRTEM images
a) (101) layered structure of
triclinic Sn3O4
b) The distance between the
lattice fringes agree well with
the triclinic Sn3O4 phase.
c) Individual scaly nanobelt
heterostructure.
d) Sn3O4 and TiO2 at the
interface level.
e-h) EDS elemental mapping
analysis.
UV-Vis Diffuse Reflectance Spectrum
Indirect band gap using Kubelka-Munk method
a) Sn3O4 (475 nm)
b) Sn3O4/TiO2 (479 nm)
c) TiO2 (380 nm)
Photocatalytic Dye degradation
• Dye: Methyl Orange
• Irradiated with UV and
simulated solar lights
• After regular interval
aliquot collected,
centrifuged and studied
with UV-vis
spectrophotometer.
Photocatalytic Dye degradation
Photocatalytic Hydrogen Evolution
Schematic diagram of electron
transfer in Sn3O4/TiO2
heterostructure
Comparison of the phtocatalytic
hydrogen evolution activities of
different samples
Photocatalytic Hydrogen Evolution
PL spectra of
(a) TiO2 nanobelts,
(b) (b) Sn3O4/TiO2 (molar ratio
Sn/Ti= 2:1) heterostructure,
(c) Sn3O4 nanoflakes.
Photoelectrochemical measurements
Mott-Schottky plots of (a) scaly Sn3O4 and (b) TiO2 nanobelt at
different frequencies in a 0.1 M Na2SO4 solution (0.1 M; pH= 6.8)
electrolyte.
Conclusions
The hydrothermal growth of Sn3O4 resulted in
crystallographic connection of (1-11) plane of Sn3O4 and (101)
plane of TiO2.
Sn3O4/TiO2 nanobelts can absorb both in the UV and visible
range.
The heterostructure exhibits superior photocatalytic
pollutant degradation and hydrogen evolution under either UV
or visible light irradiation.
Partial cation exchange synthesis
Scheme of the synthesis of pristine Cu2S NCs and their exchange reactions to
CIS and CIZS NCs
Sequence exchange
Combined Exchange
TEM images of Cu2S and CIS
a) Parent Cu2S NCs, b)Exchanged CIS NCs, c,d) HRTEM image,
FT analysis of e) Cu2S, f) NCs with axial projection
Cu2S (7.9 nm)
CIS (5.7 nm)
Slight
etching by
TOP
PXRD pattern
TEM images of CIZS
X-ray Photoelectron Spectroscopy
(XPS)
Absorption Spectrum
Cyclic Voltammogram
Conclusions
Sequentially synthesized CIZS form core/shell like structure whereas combining
two precursors in one pot forms homogeneously alloyed CIZS NCs.
Sequential exchange with Zn2+ leads to a sufficient increase of the PL
efficiency.
PL peak can be tuned from 850 nm to 1030 nm by carefully controlling the
Cu:In:Zn ratio in the NCs.
Combination of optical characterization with cyclic voltammetry results
provides a further insight into the electronic structure of the NCs.

Presentation 14 jan 2015

  • 1.
    Literature Presentation 14th Jan2015 By Saurav Chandra Sarma
  • 3.
  • 4.
    Schematic illustration ofthe synthesis process XRD patterns of a) Pure TiO2 nanobelt b) Scaly Sn3O4 nanoflakes c) Sn3O4/TiO2 •Molar ratio Sn/Ti=2/1 •TiO2 is in anatase phase •Sn3O4 has triclinic phase
  • 5.
    SEM images SEM imagesof scaly Sn3O4/TiO2 (molar ratio Sn/Ti=2/1) heterostructure obtained at different synthetic stages of (a) 1 h; (b) 4 h; (c) 12 h.
  • 6.
    SEM images a) TiO2nanobelts b) Sn3O4 nanoflakes c,d) Sn3O4/TiO2 nanobelts Sn3O4 nanoflakes are assembled perpendicular to the surface of TiO2 nanobelts.
  • 7.
    HRTEM images a) (101)layered structure of triclinic Sn3O4 b) The distance between the lattice fringes agree well with the triclinic Sn3O4 phase. c) Individual scaly nanobelt heterostructure. d) Sn3O4 and TiO2 at the interface level. e-h) EDS elemental mapping analysis.
  • 8.
    UV-Vis Diffuse ReflectanceSpectrum Indirect band gap using Kubelka-Munk method a) Sn3O4 (475 nm) b) Sn3O4/TiO2 (479 nm) c) TiO2 (380 nm)
  • 9.
    Photocatalytic Dye degradation •Dye: Methyl Orange • Irradiated with UV and simulated solar lights • After regular interval aliquot collected, centrifuged and studied with UV-vis spectrophotometer.
  • 10.
  • 11.
    Photocatalytic Hydrogen Evolution Schematicdiagram of electron transfer in Sn3O4/TiO2 heterostructure Comparison of the phtocatalytic hydrogen evolution activities of different samples
  • 12.
    Photocatalytic Hydrogen Evolution PLspectra of (a) TiO2 nanobelts, (b) (b) Sn3O4/TiO2 (molar ratio Sn/Ti= 2:1) heterostructure, (c) Sn3O4 nanoflakes.
  • 13.
    Photoelectrochemical measurements Mott-Schottky plotsof (a) scaly Sn3O4 and (b) TiO2 nanobelt at different frequencies in a 0.1 M Na2SO4 solution (0.1 M; pH= 6.8) electrolyte.
  • 14.
    Conclusions The hydrothermal growthof Sn3O4 resulted in crystallographic connection of (1-11) plane of Sn3O4 and (101) plane of TiO2. Sn3O4/TiO2 nanobelts can absorb both in the UV and visible range. The heterostructure exhibits superior photocatalytic pollutant degradation and hydrogen evolution under either UV or visible light irradiation.
  • 16.
    Partial cation exchangesynthesis Scheme of the synthesis of pristine Cu2S NCs and their exchange reactions to CIS and CIZS NCs Sequence exchange Combined Exchange
  • 17.
    TEM images ofCu2S and CIS a) Parent Cu2S NCs, b)Exchanged CIS NCs, c,d) HRTEM image, FT analysis of e) Cu2S, f) NCs with axial projection Cu2S (7.9 nm) CIS (5.7 nm) Slight etching by TOP
  • 18.
  • 19.
  • 20.
  • 21.
  • 22.
  • 23.
    Conclusions Sequentially synthesized CIZSform core/shell like structure whereas combining two precursors in one pot forms homogeneously alloyed CIZS NCs. Sequential exchange with Zn2+ leads to a sufficient increase of the PL efficiency. PL peak can be tuned from 850 nm to 1030 nm by carefully controlling the Cu:In:Zn ratio in the NCs. Combination of optical characterization with cyclic voltammetry results provides a further insight into the electronic structure of the NCs.