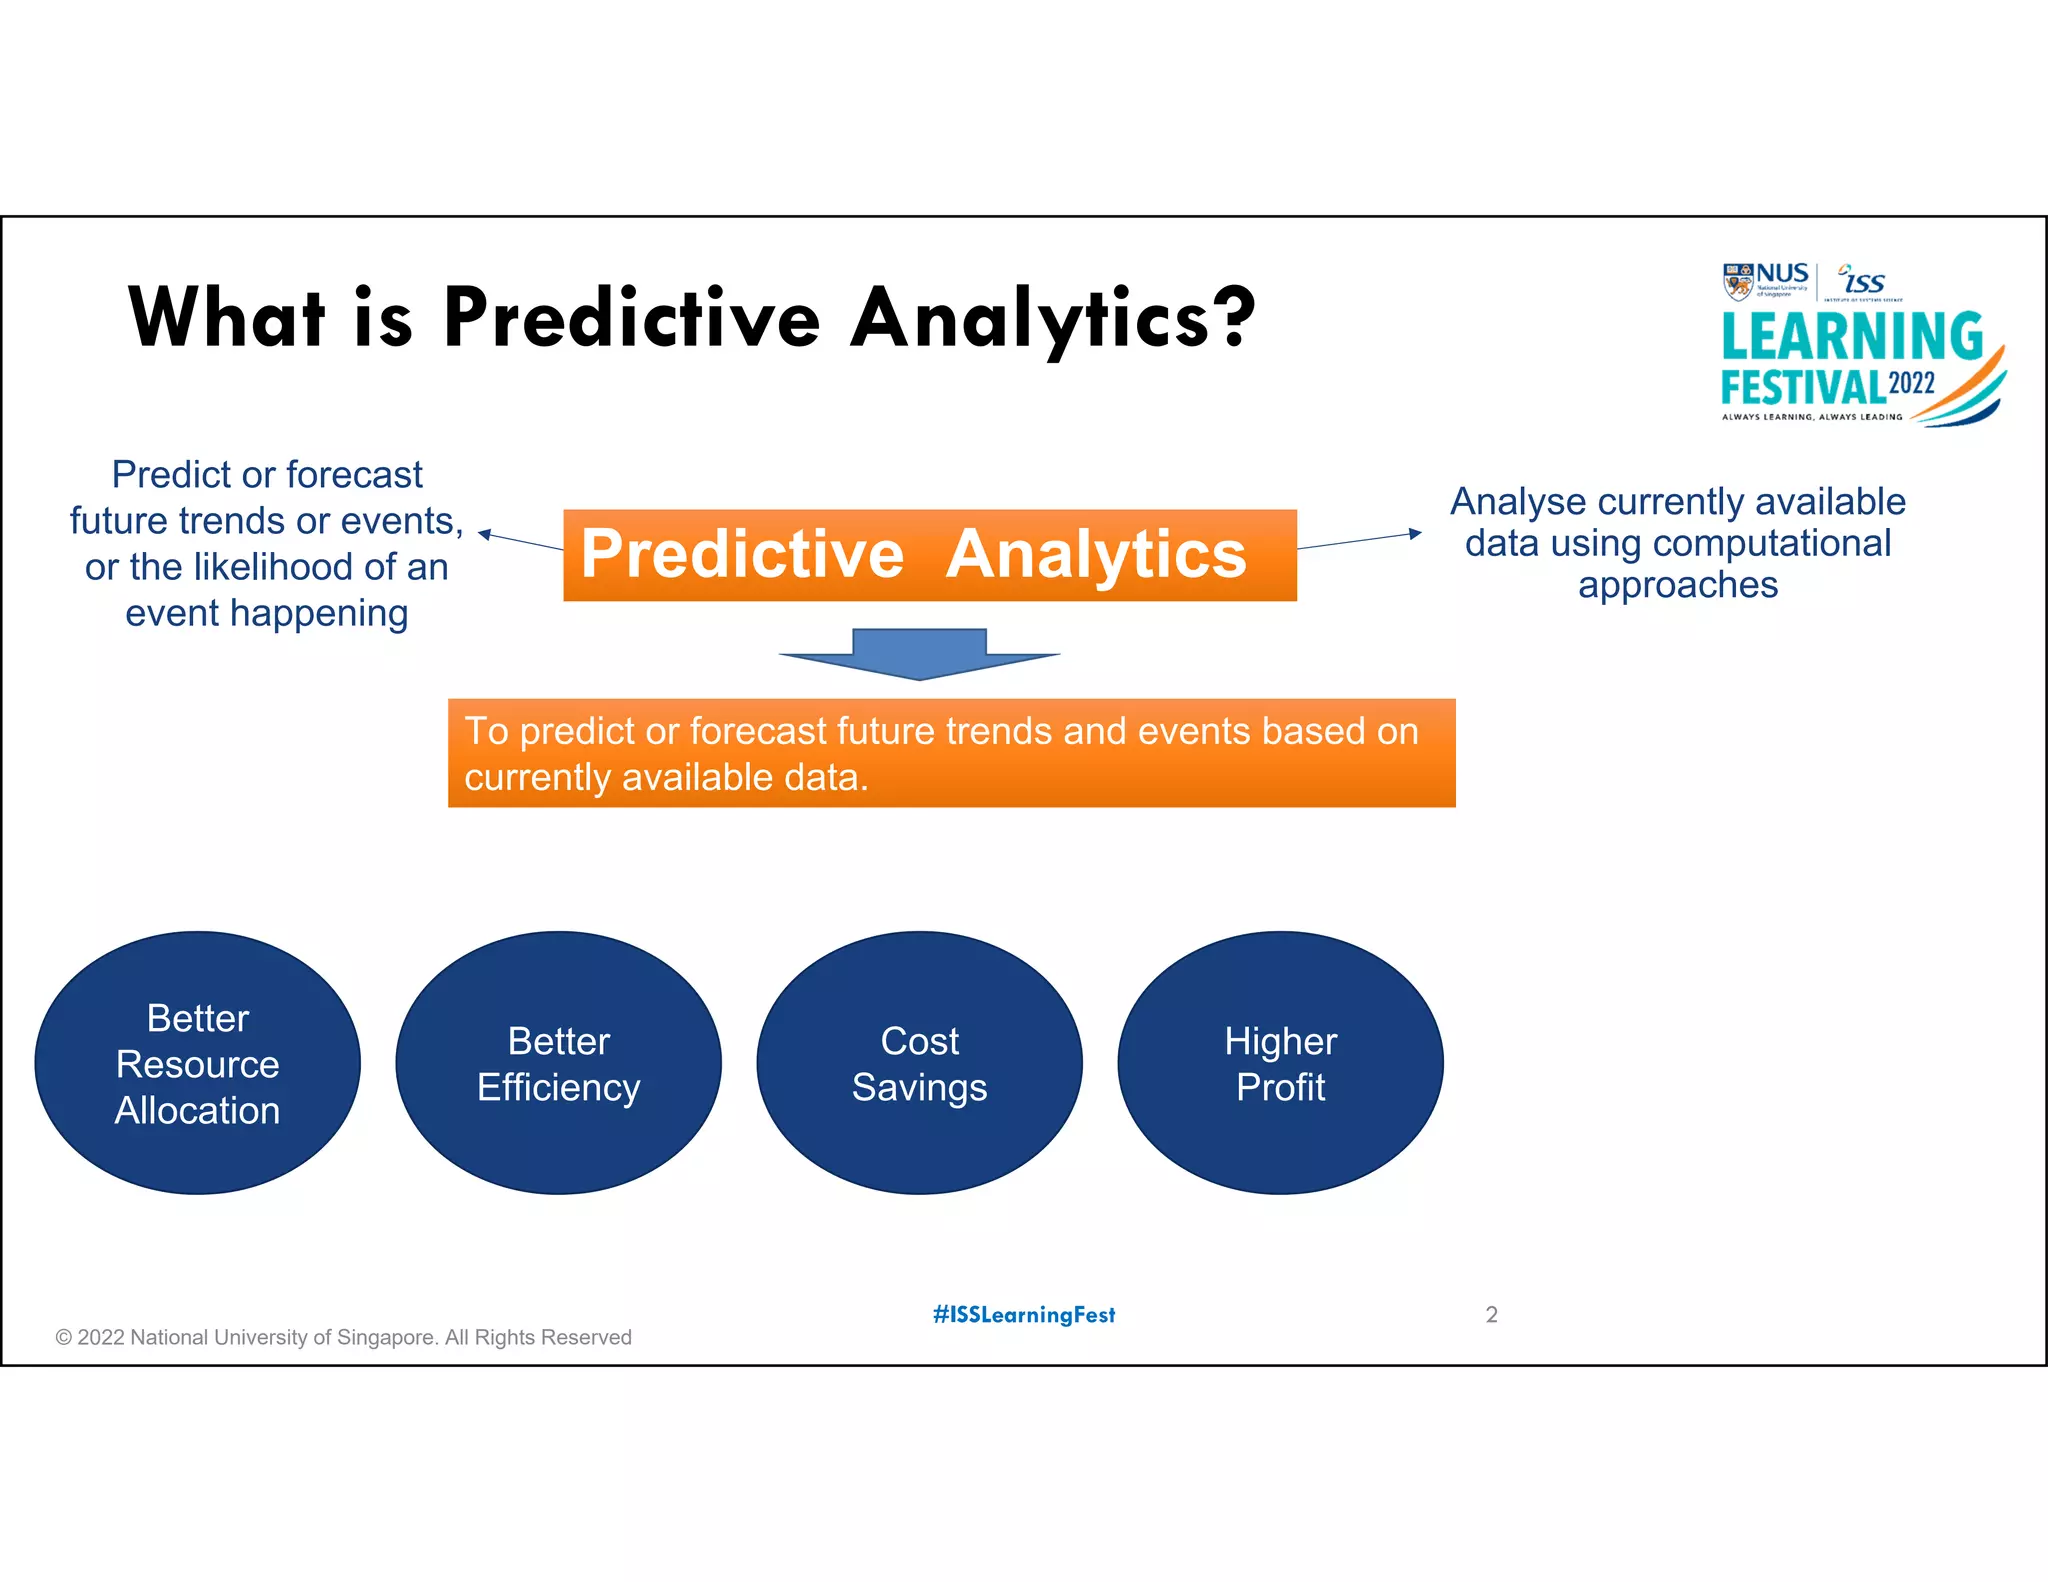
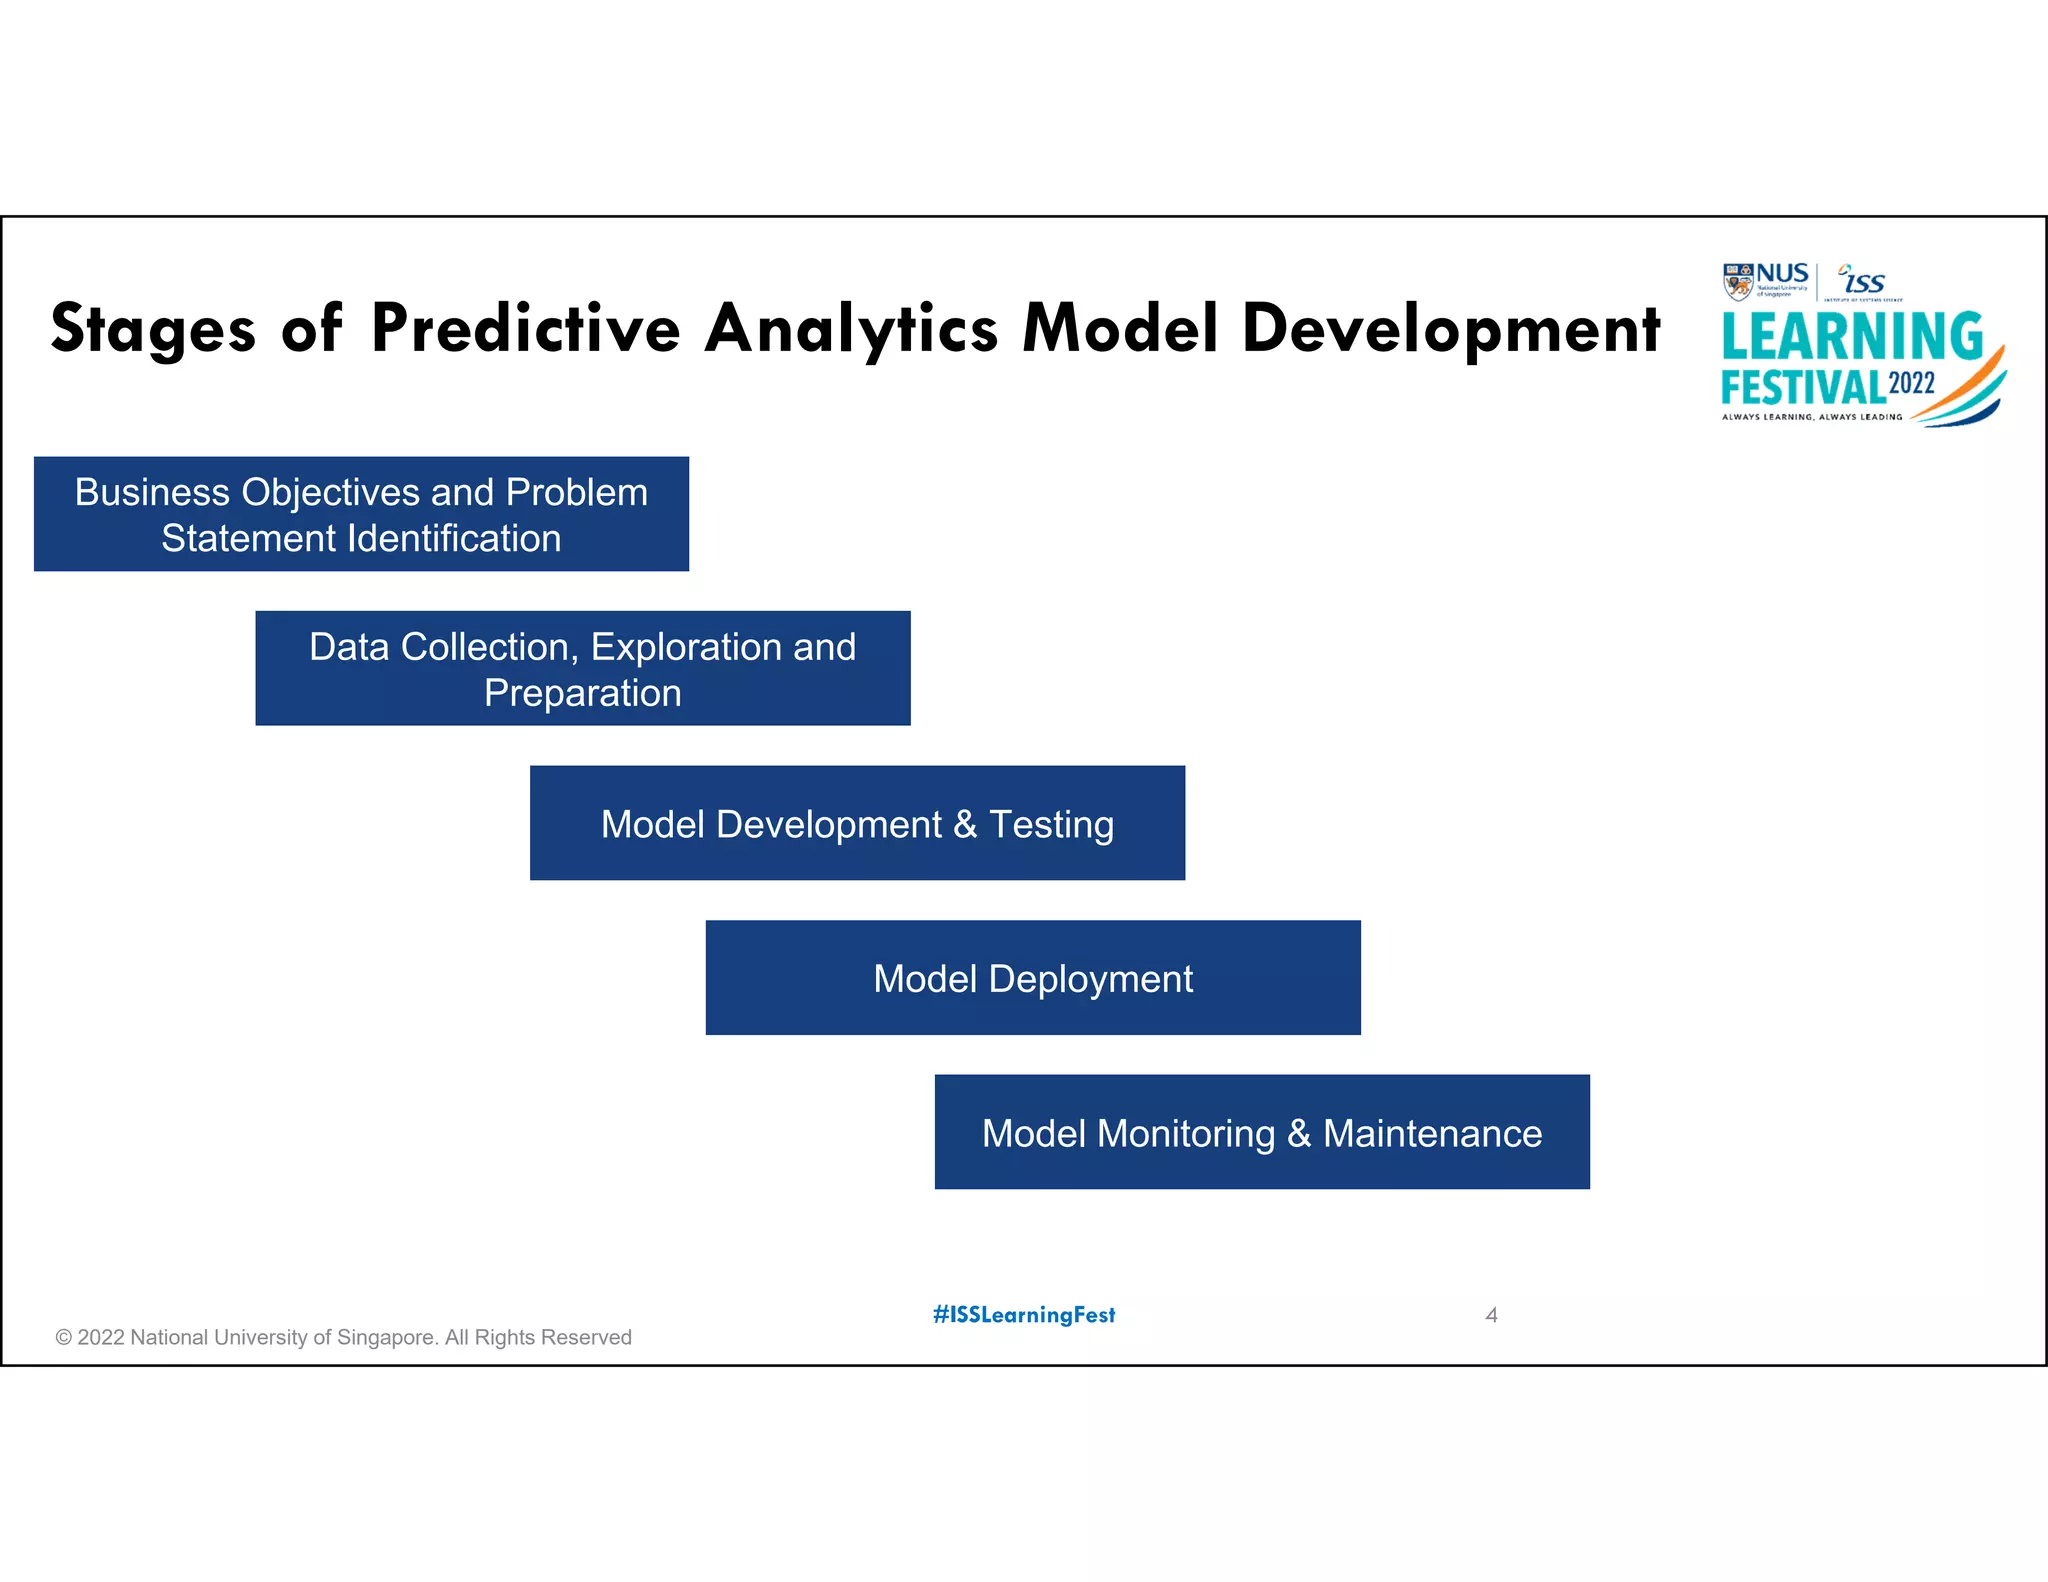
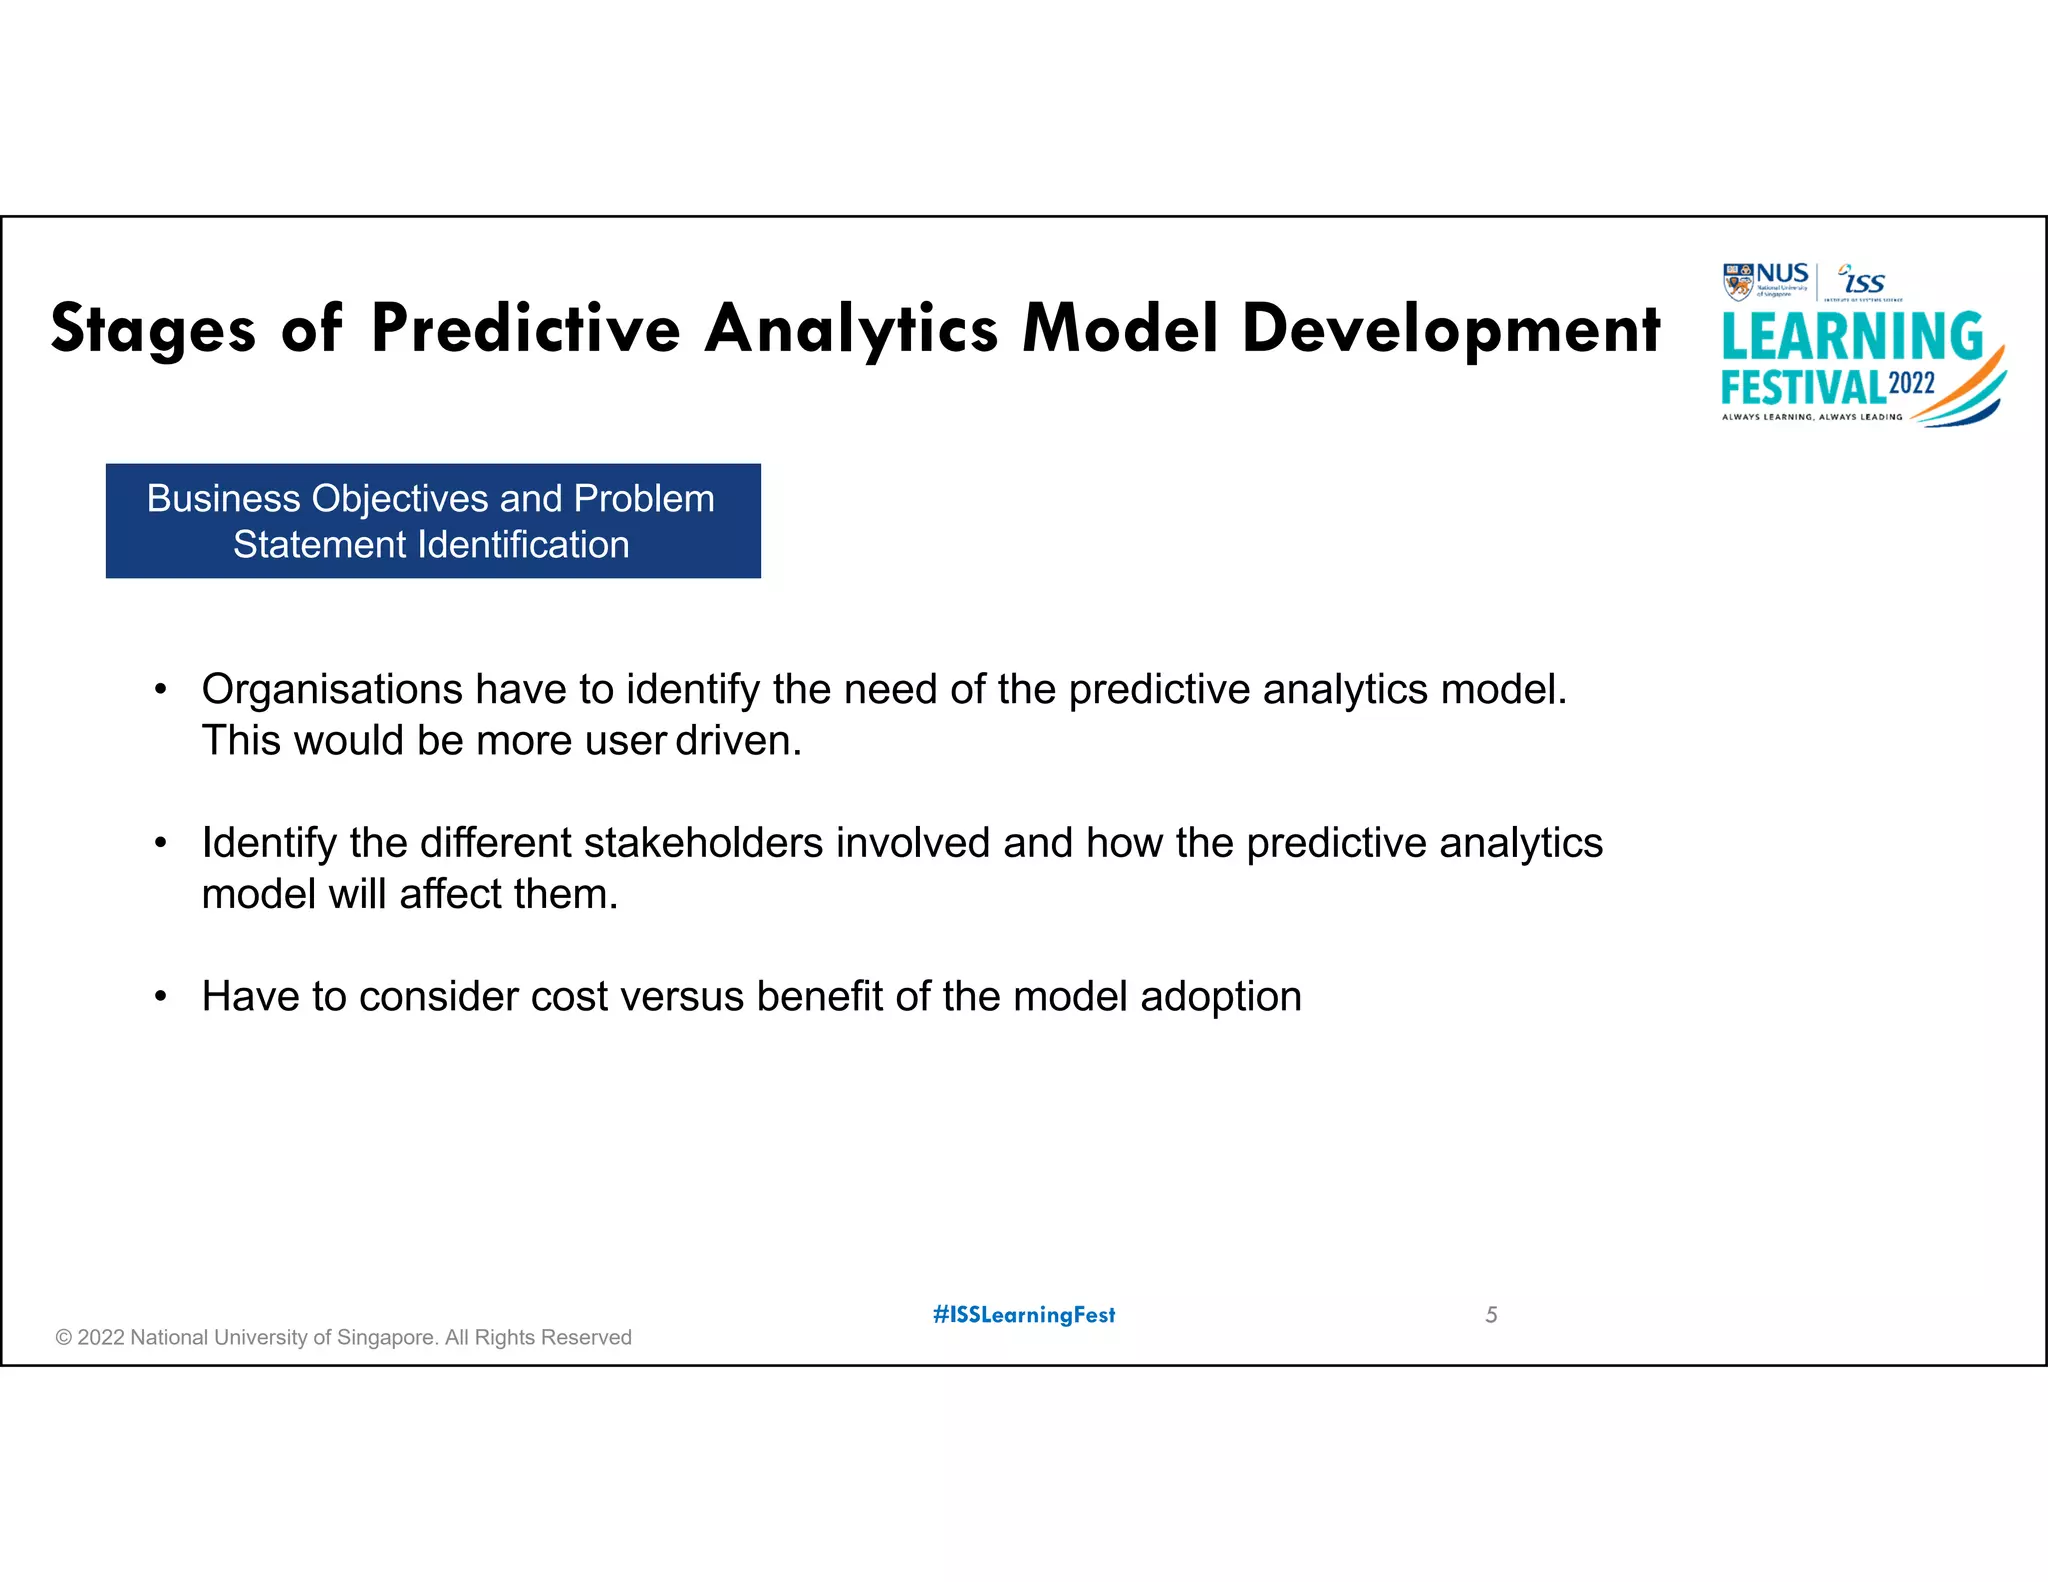
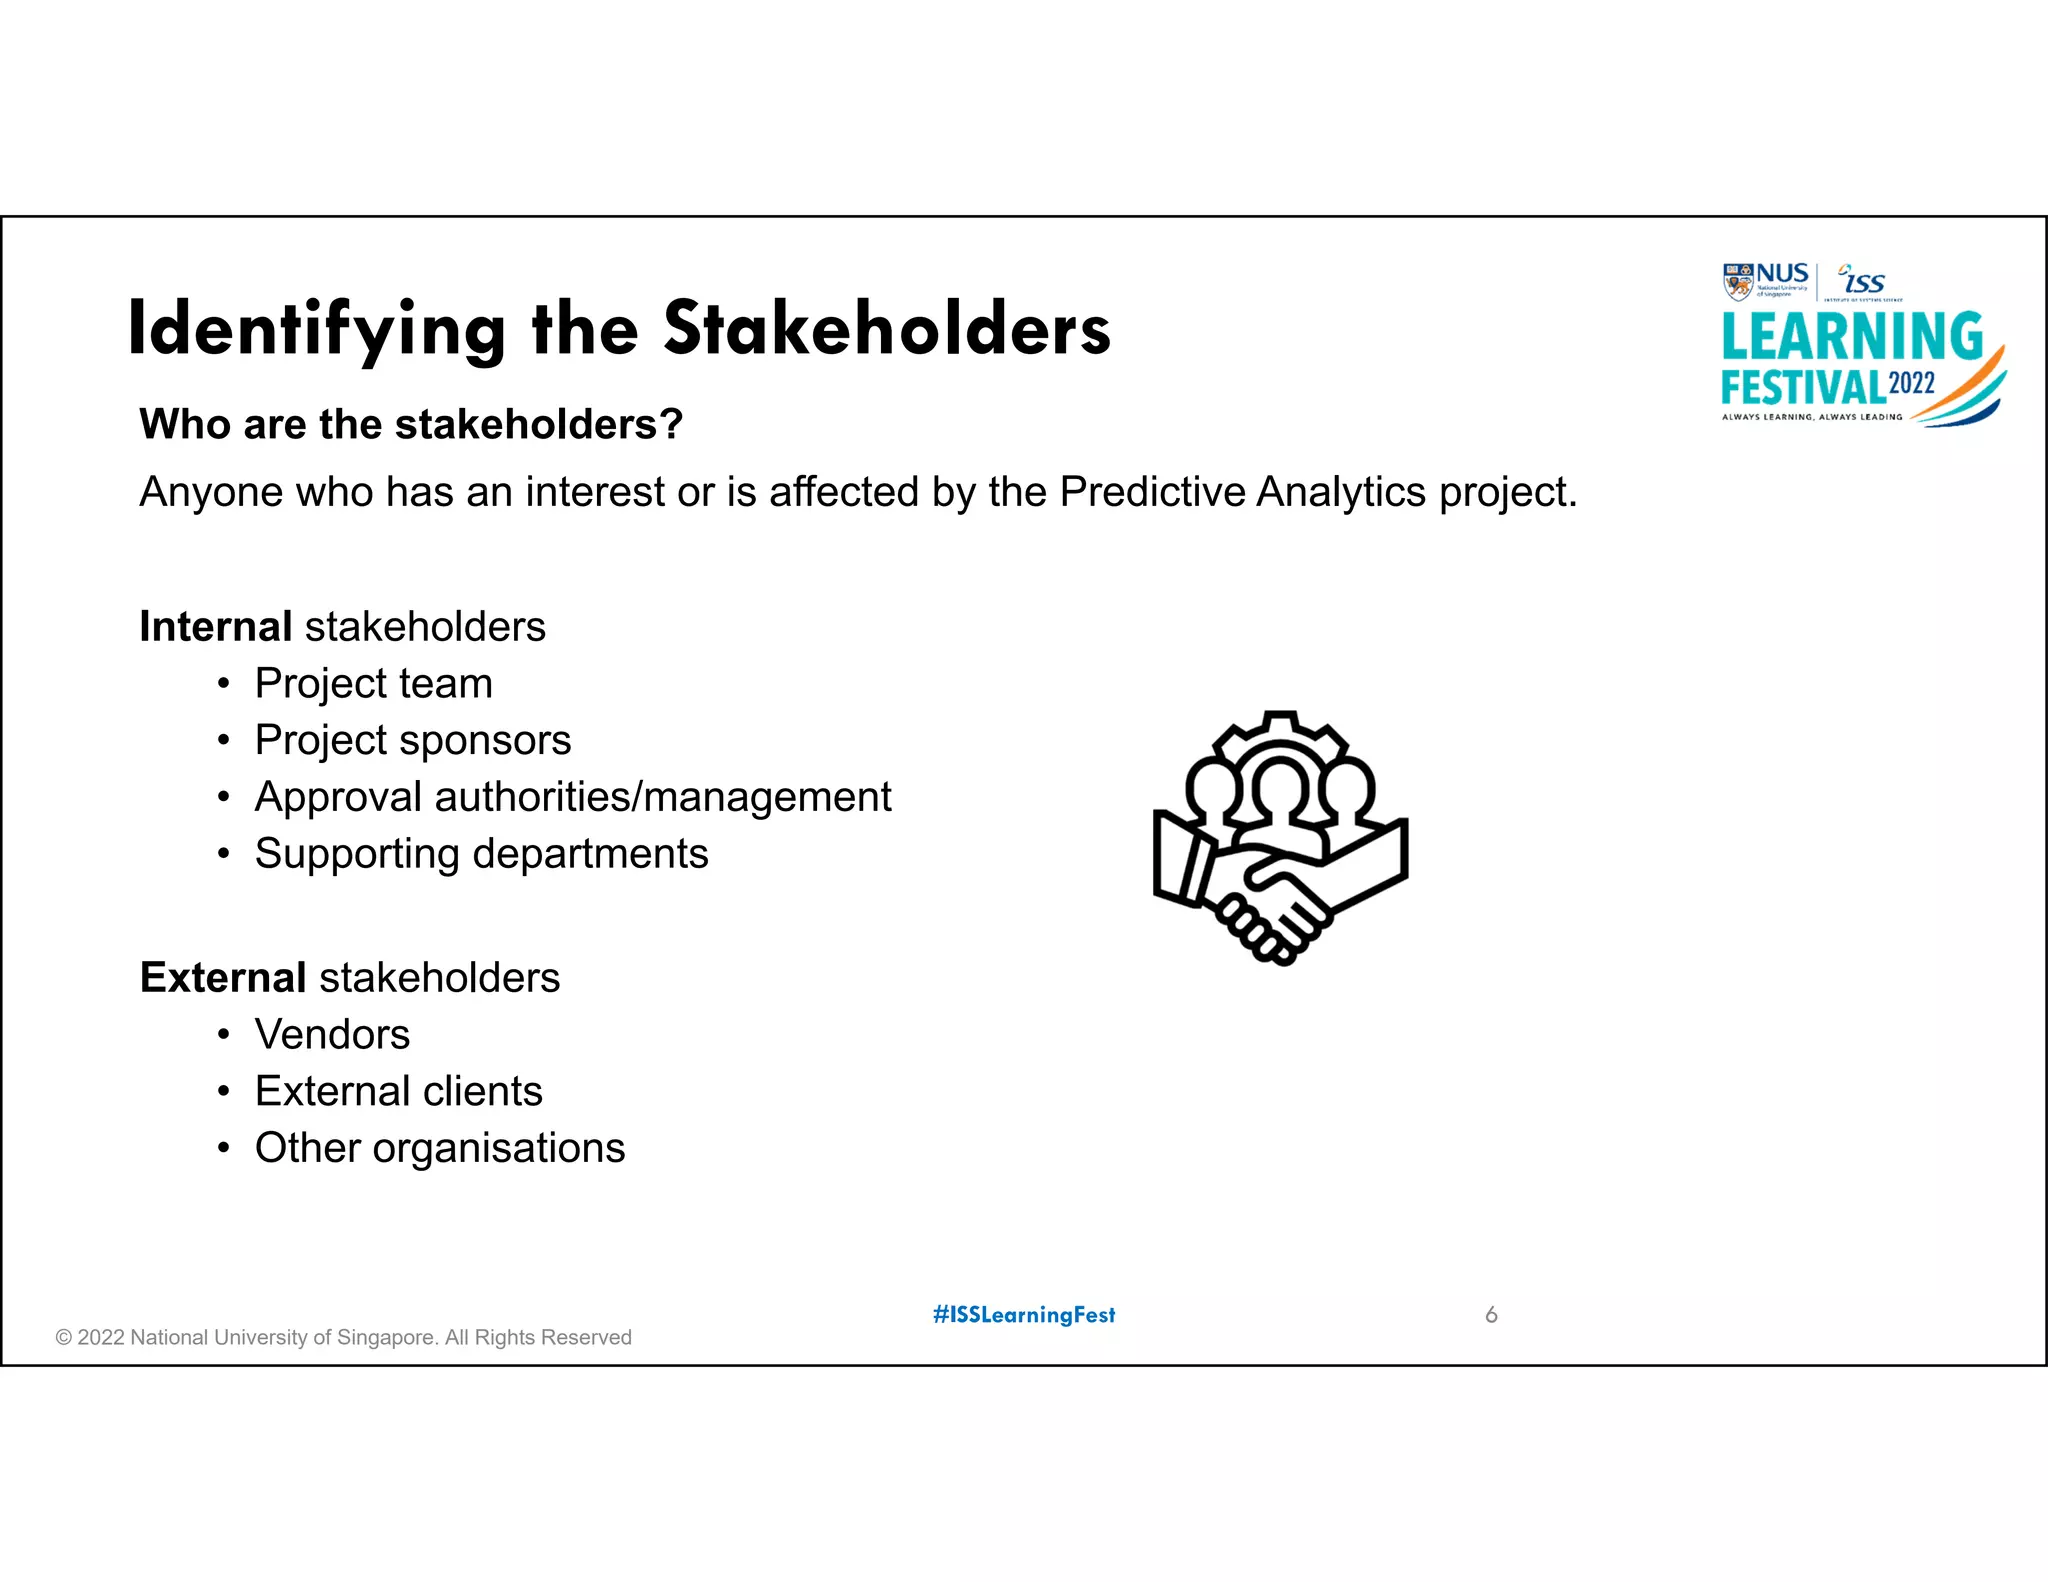
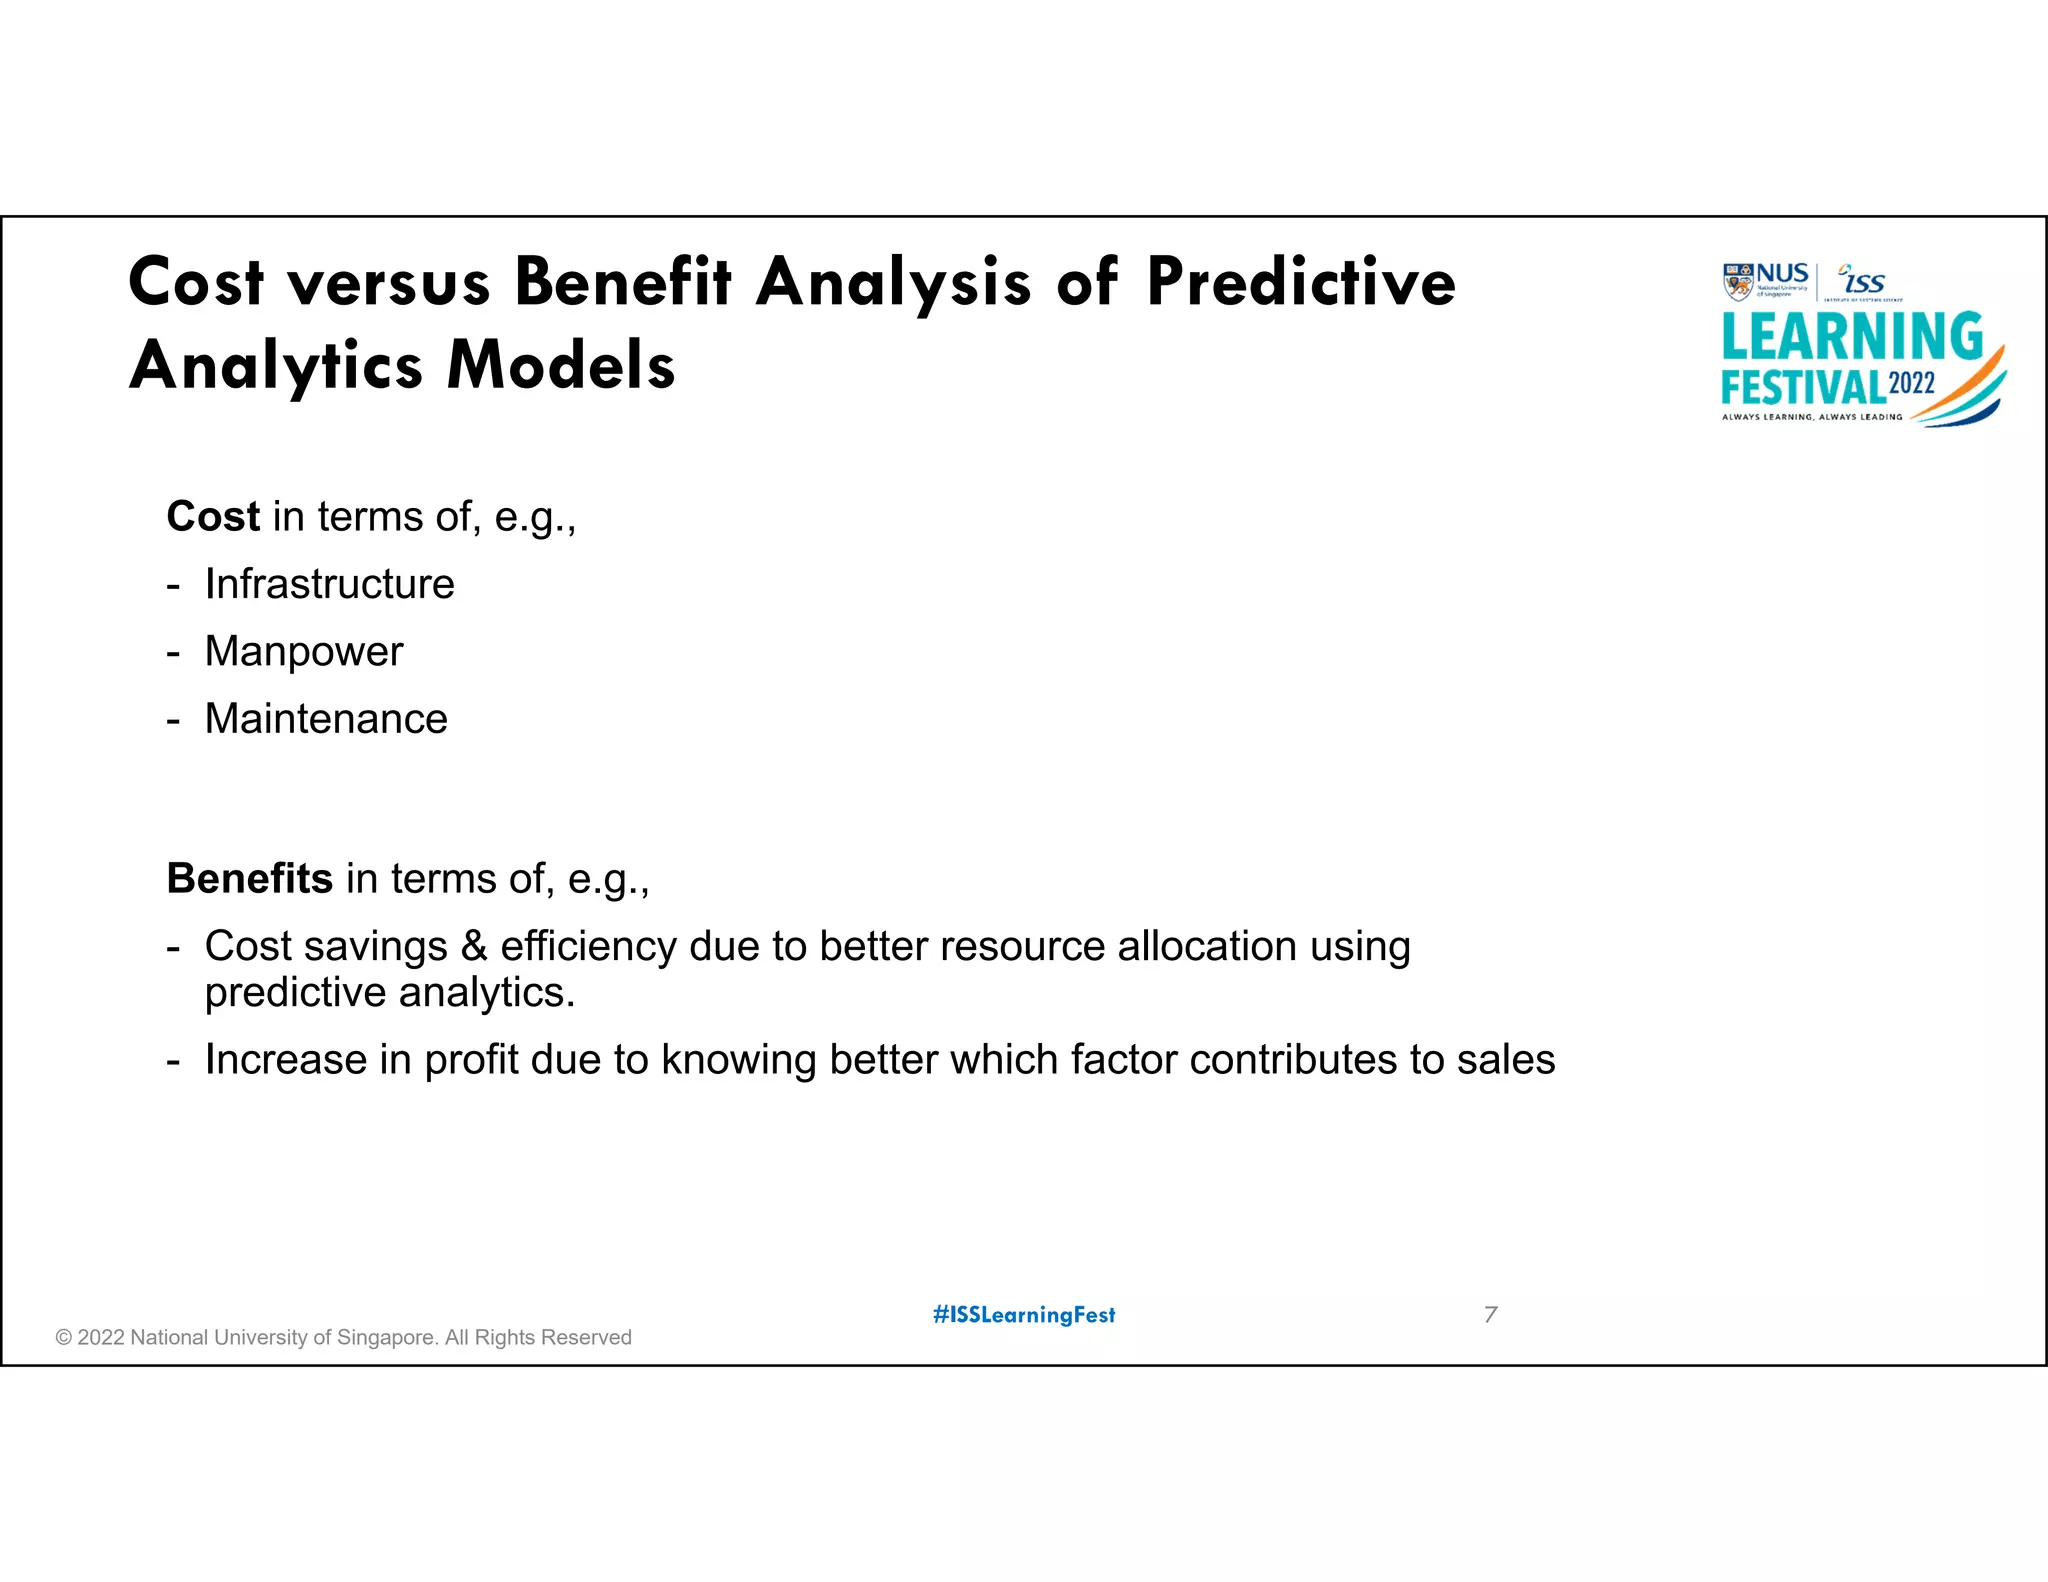
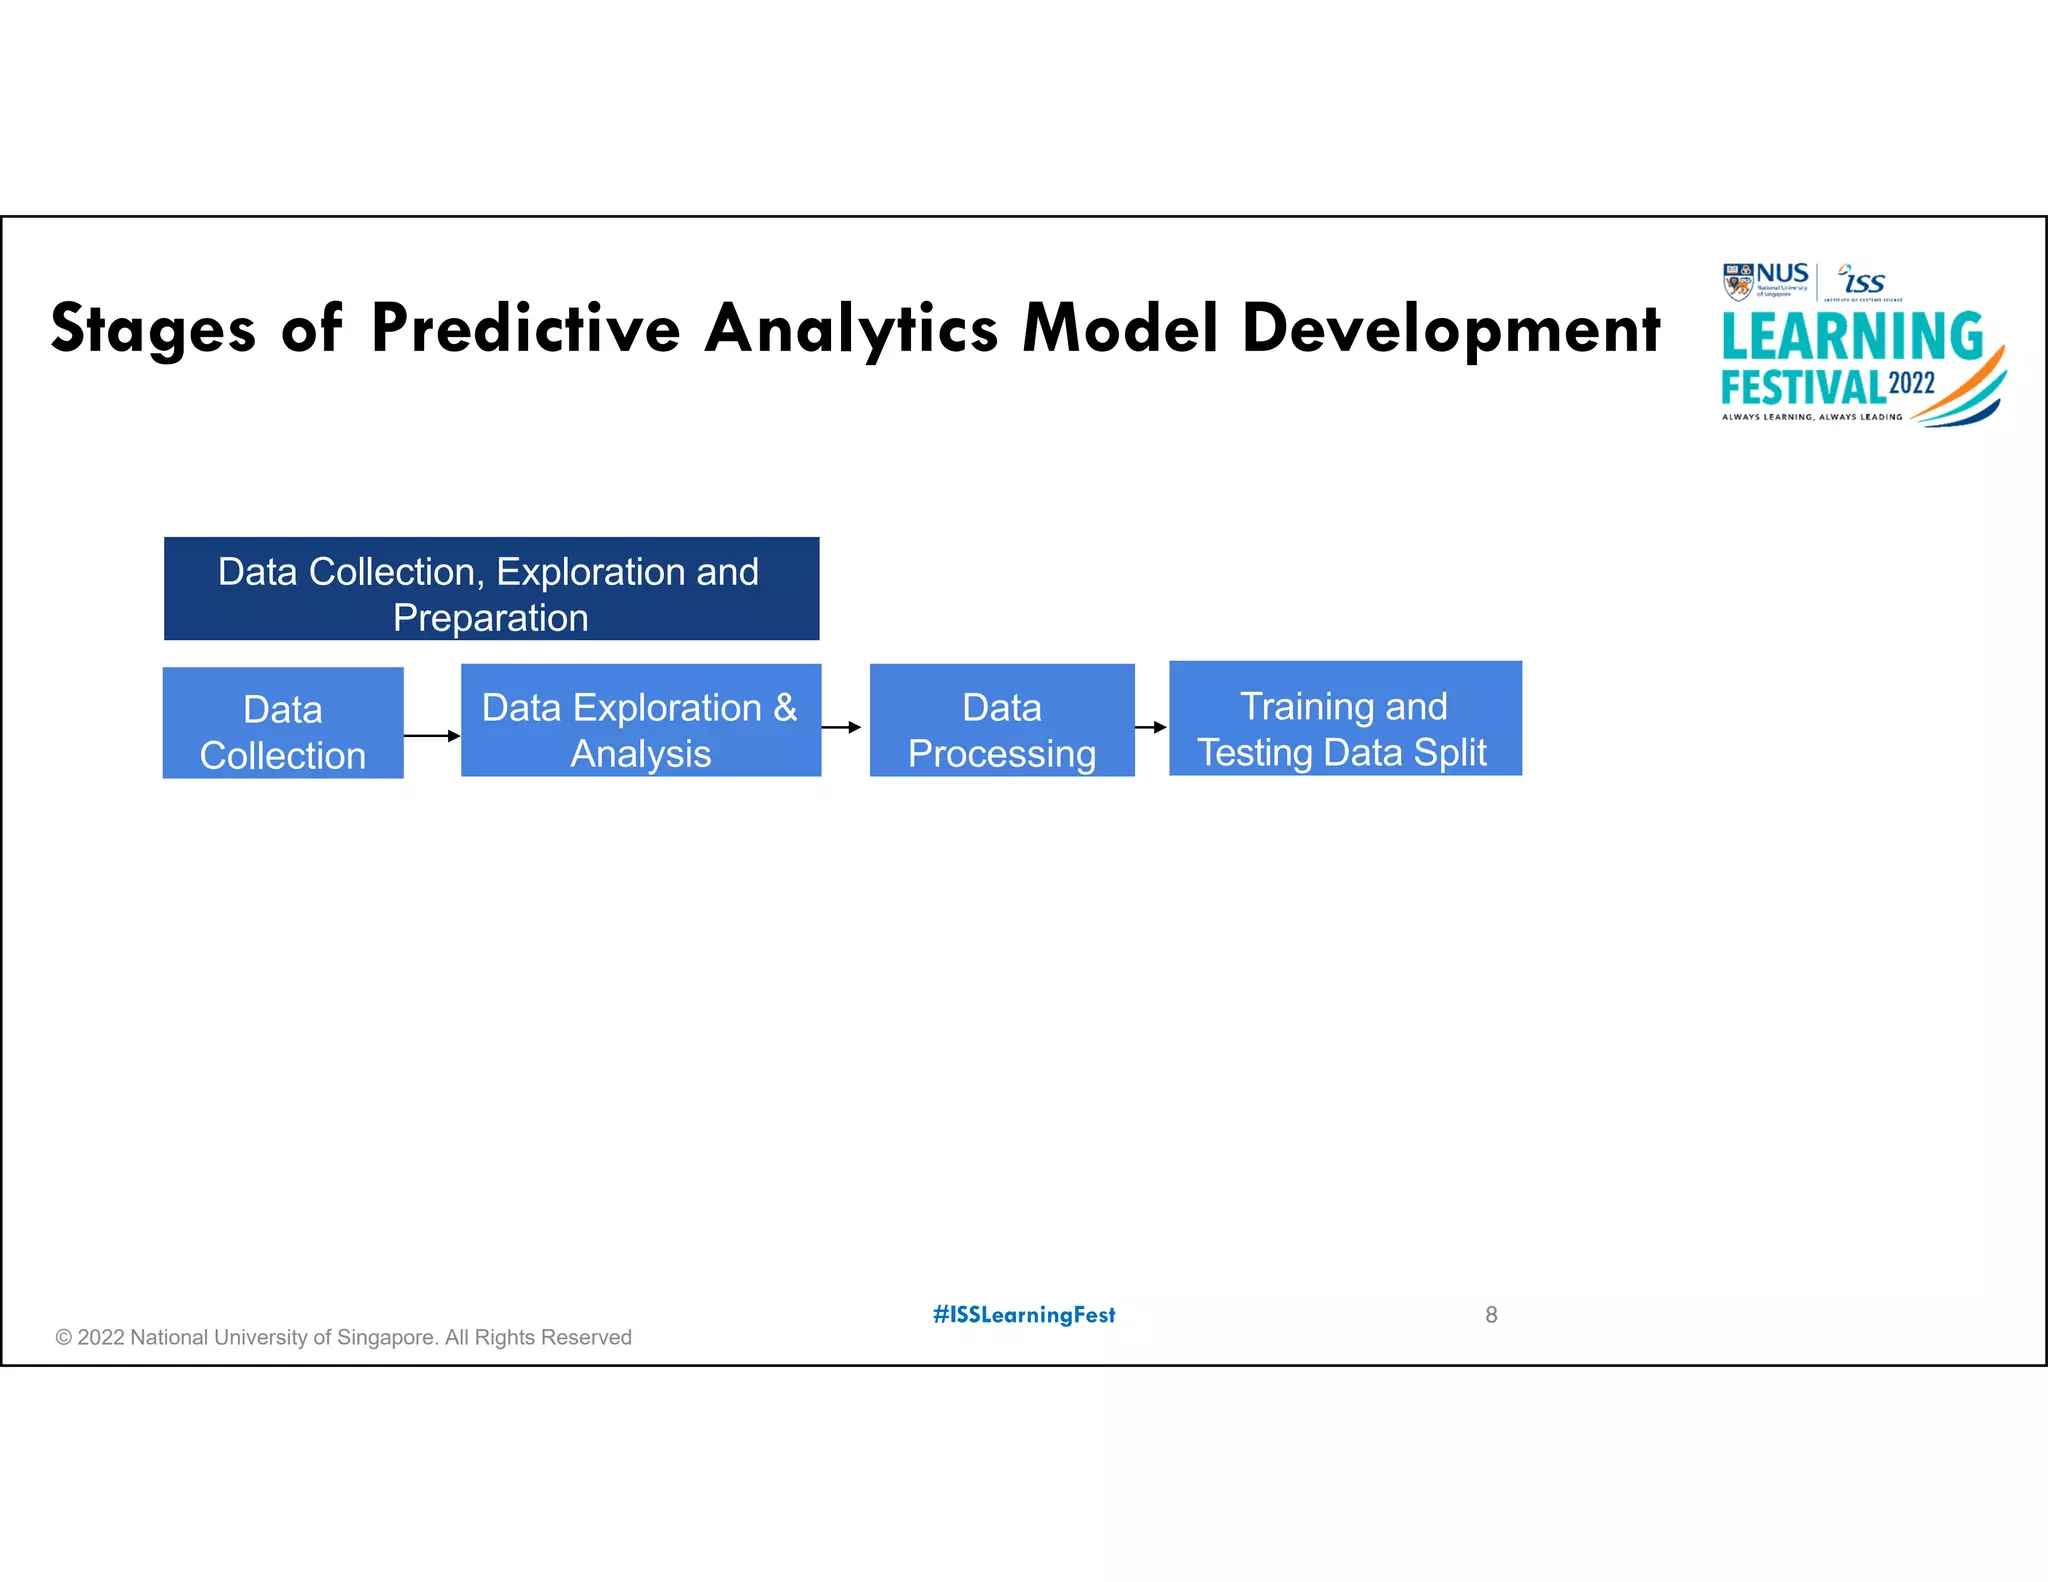
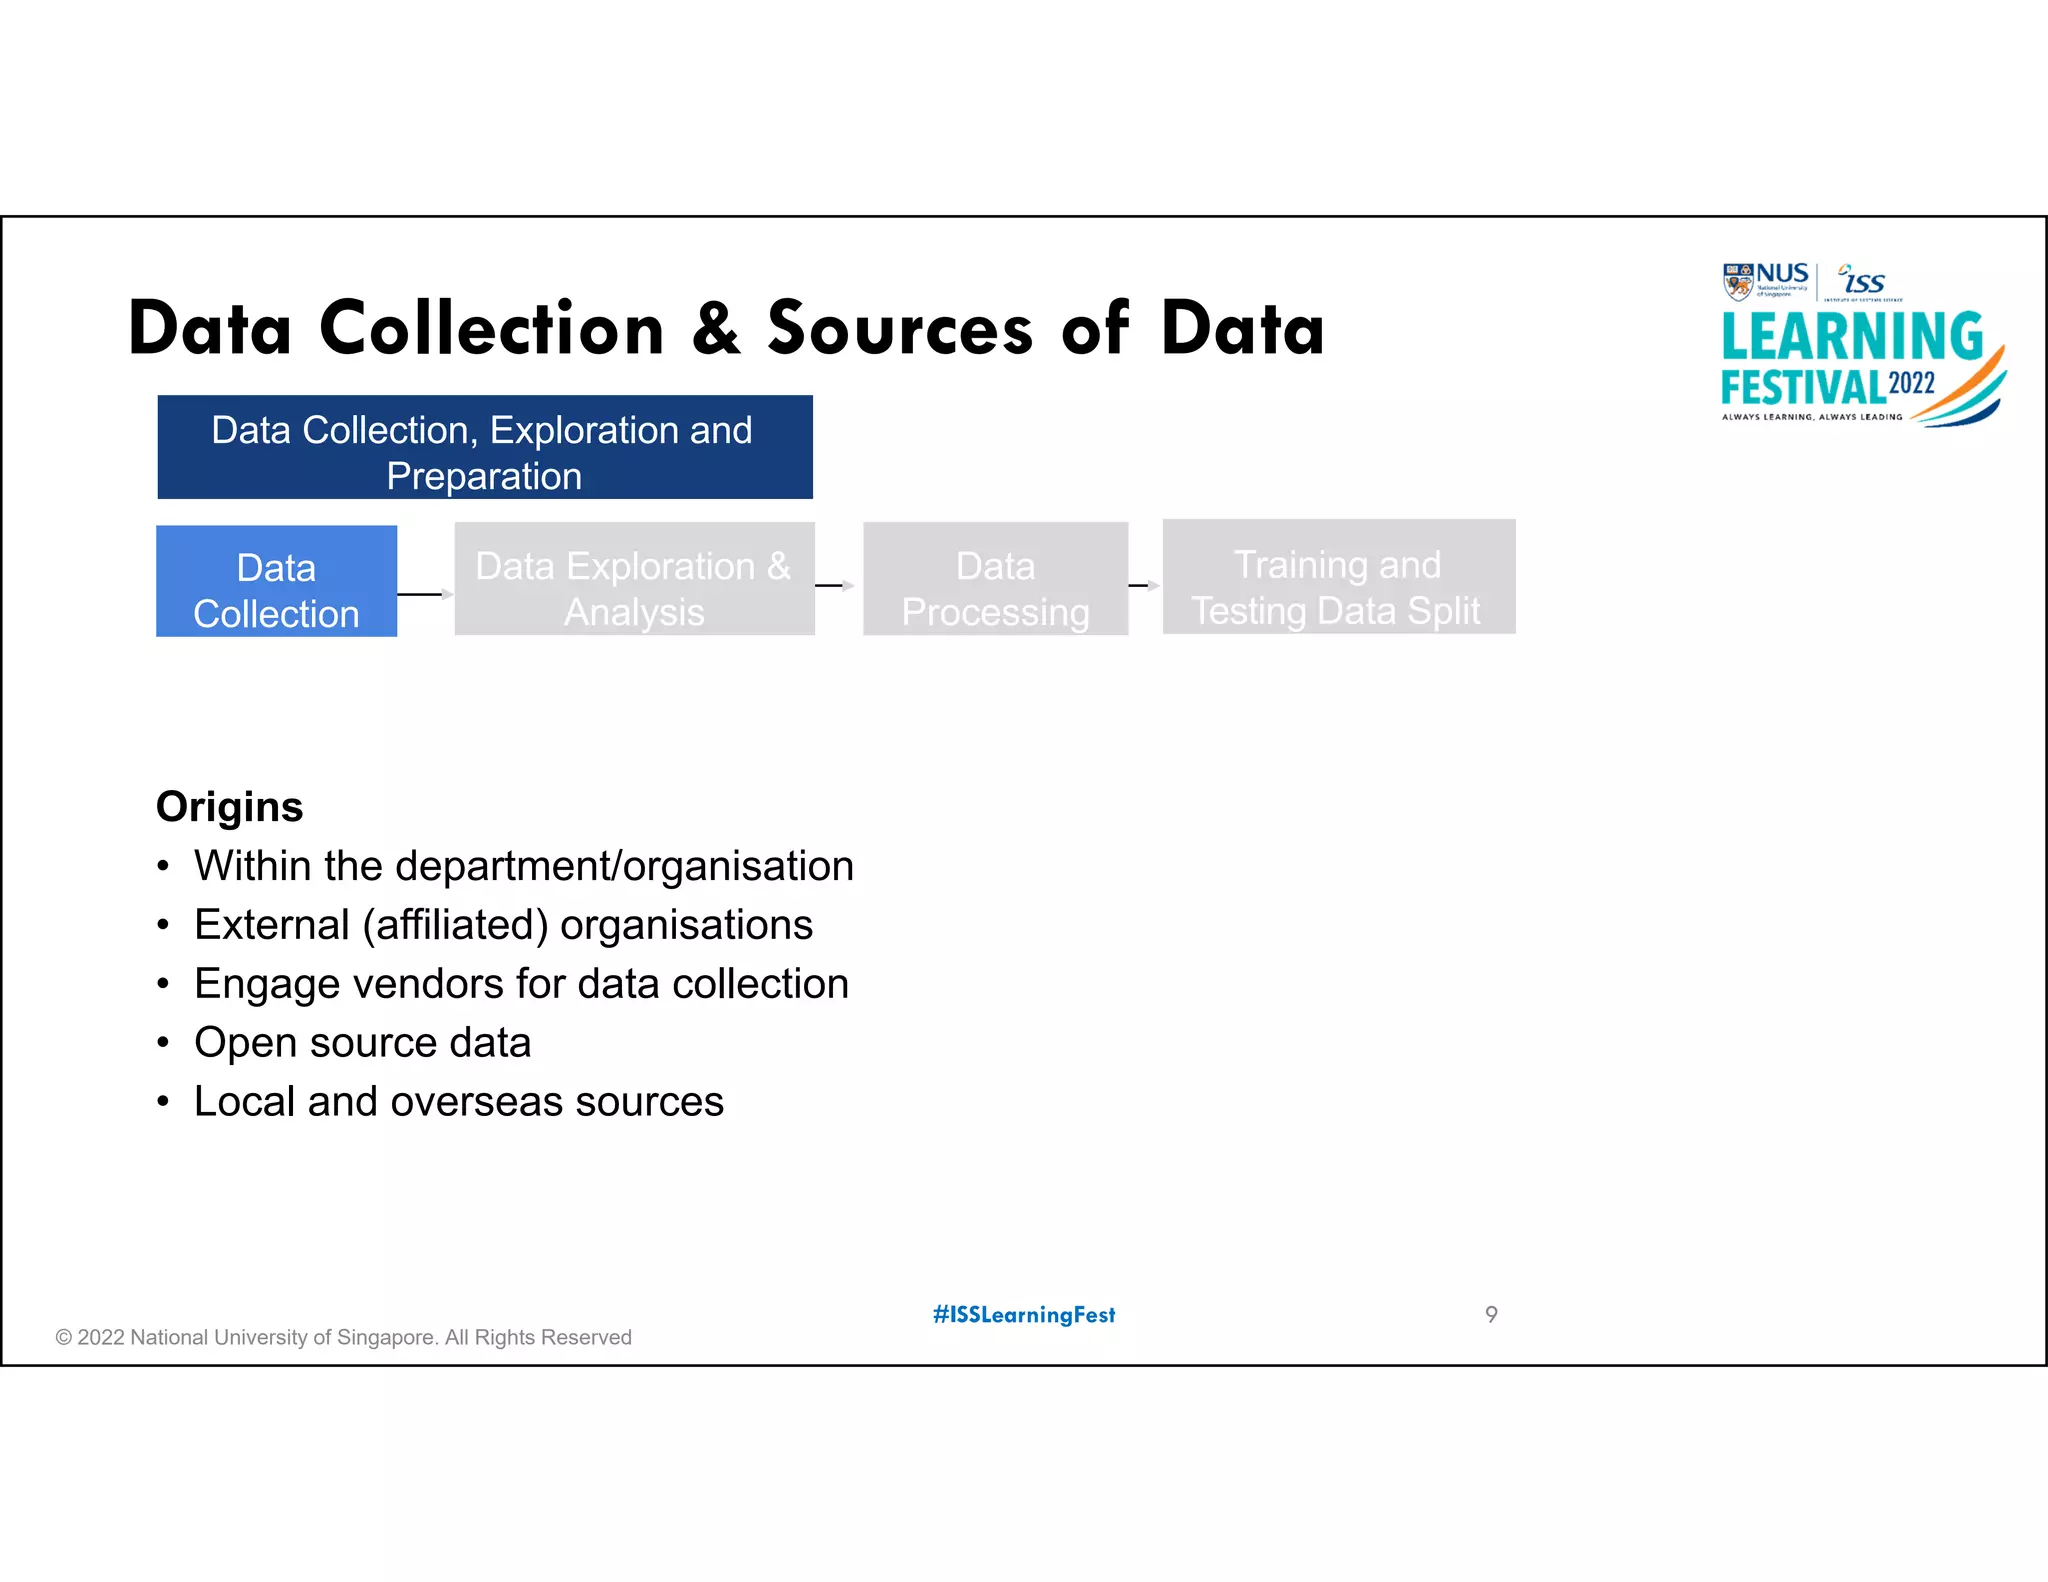
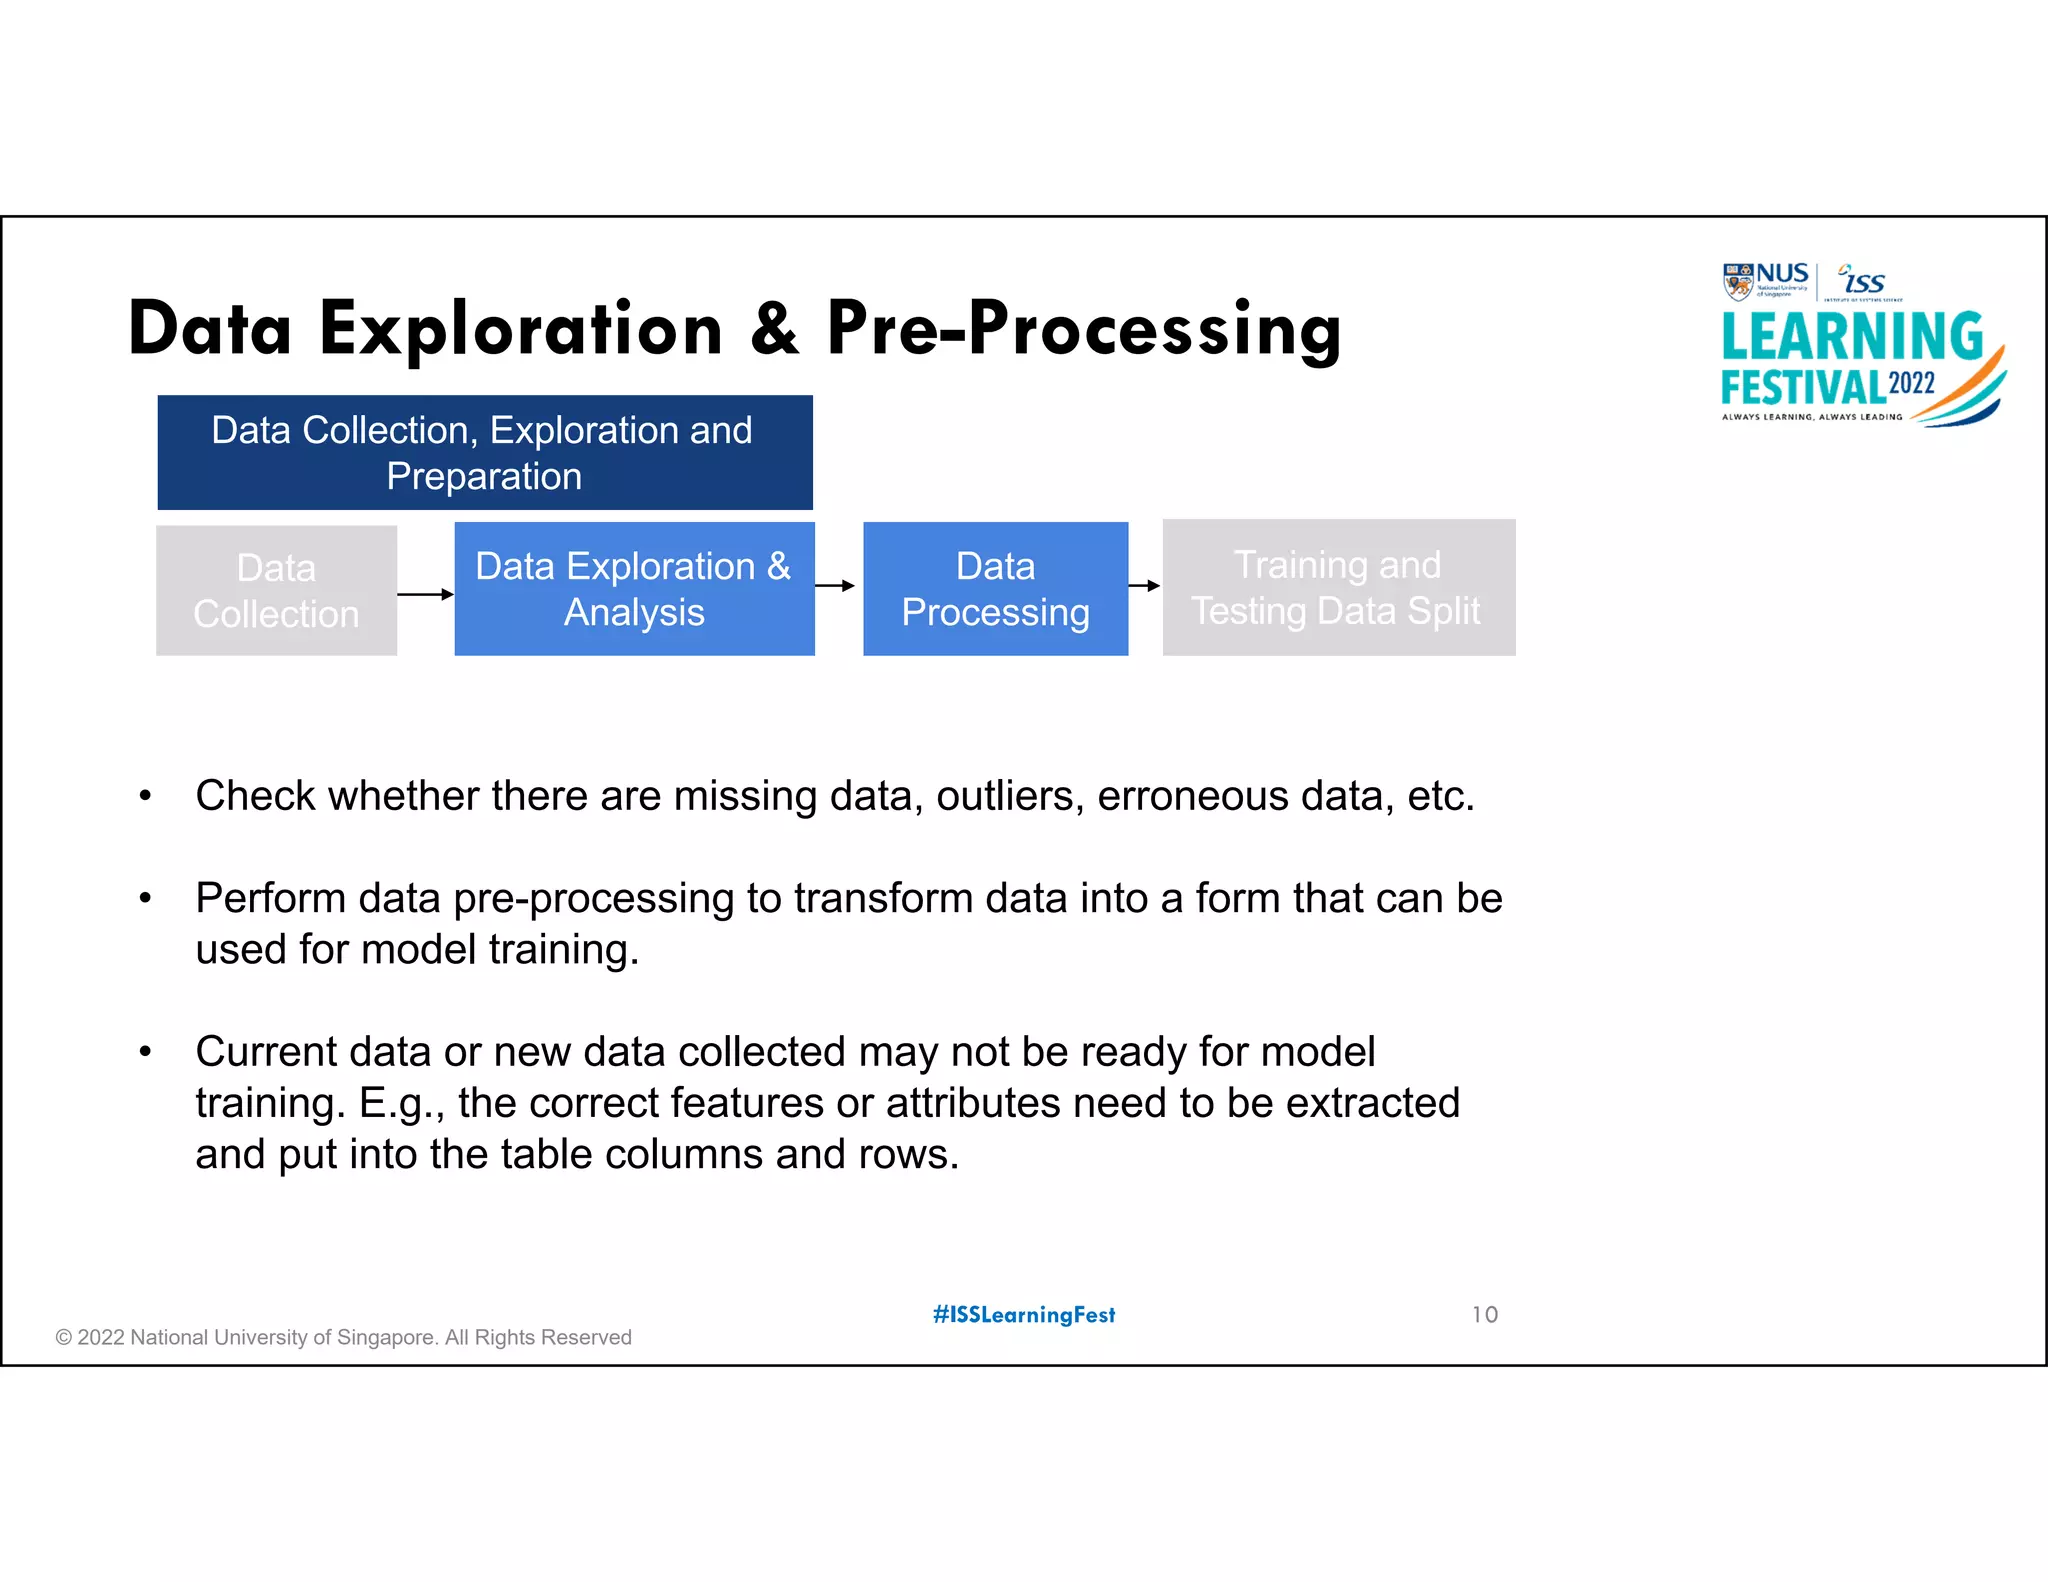
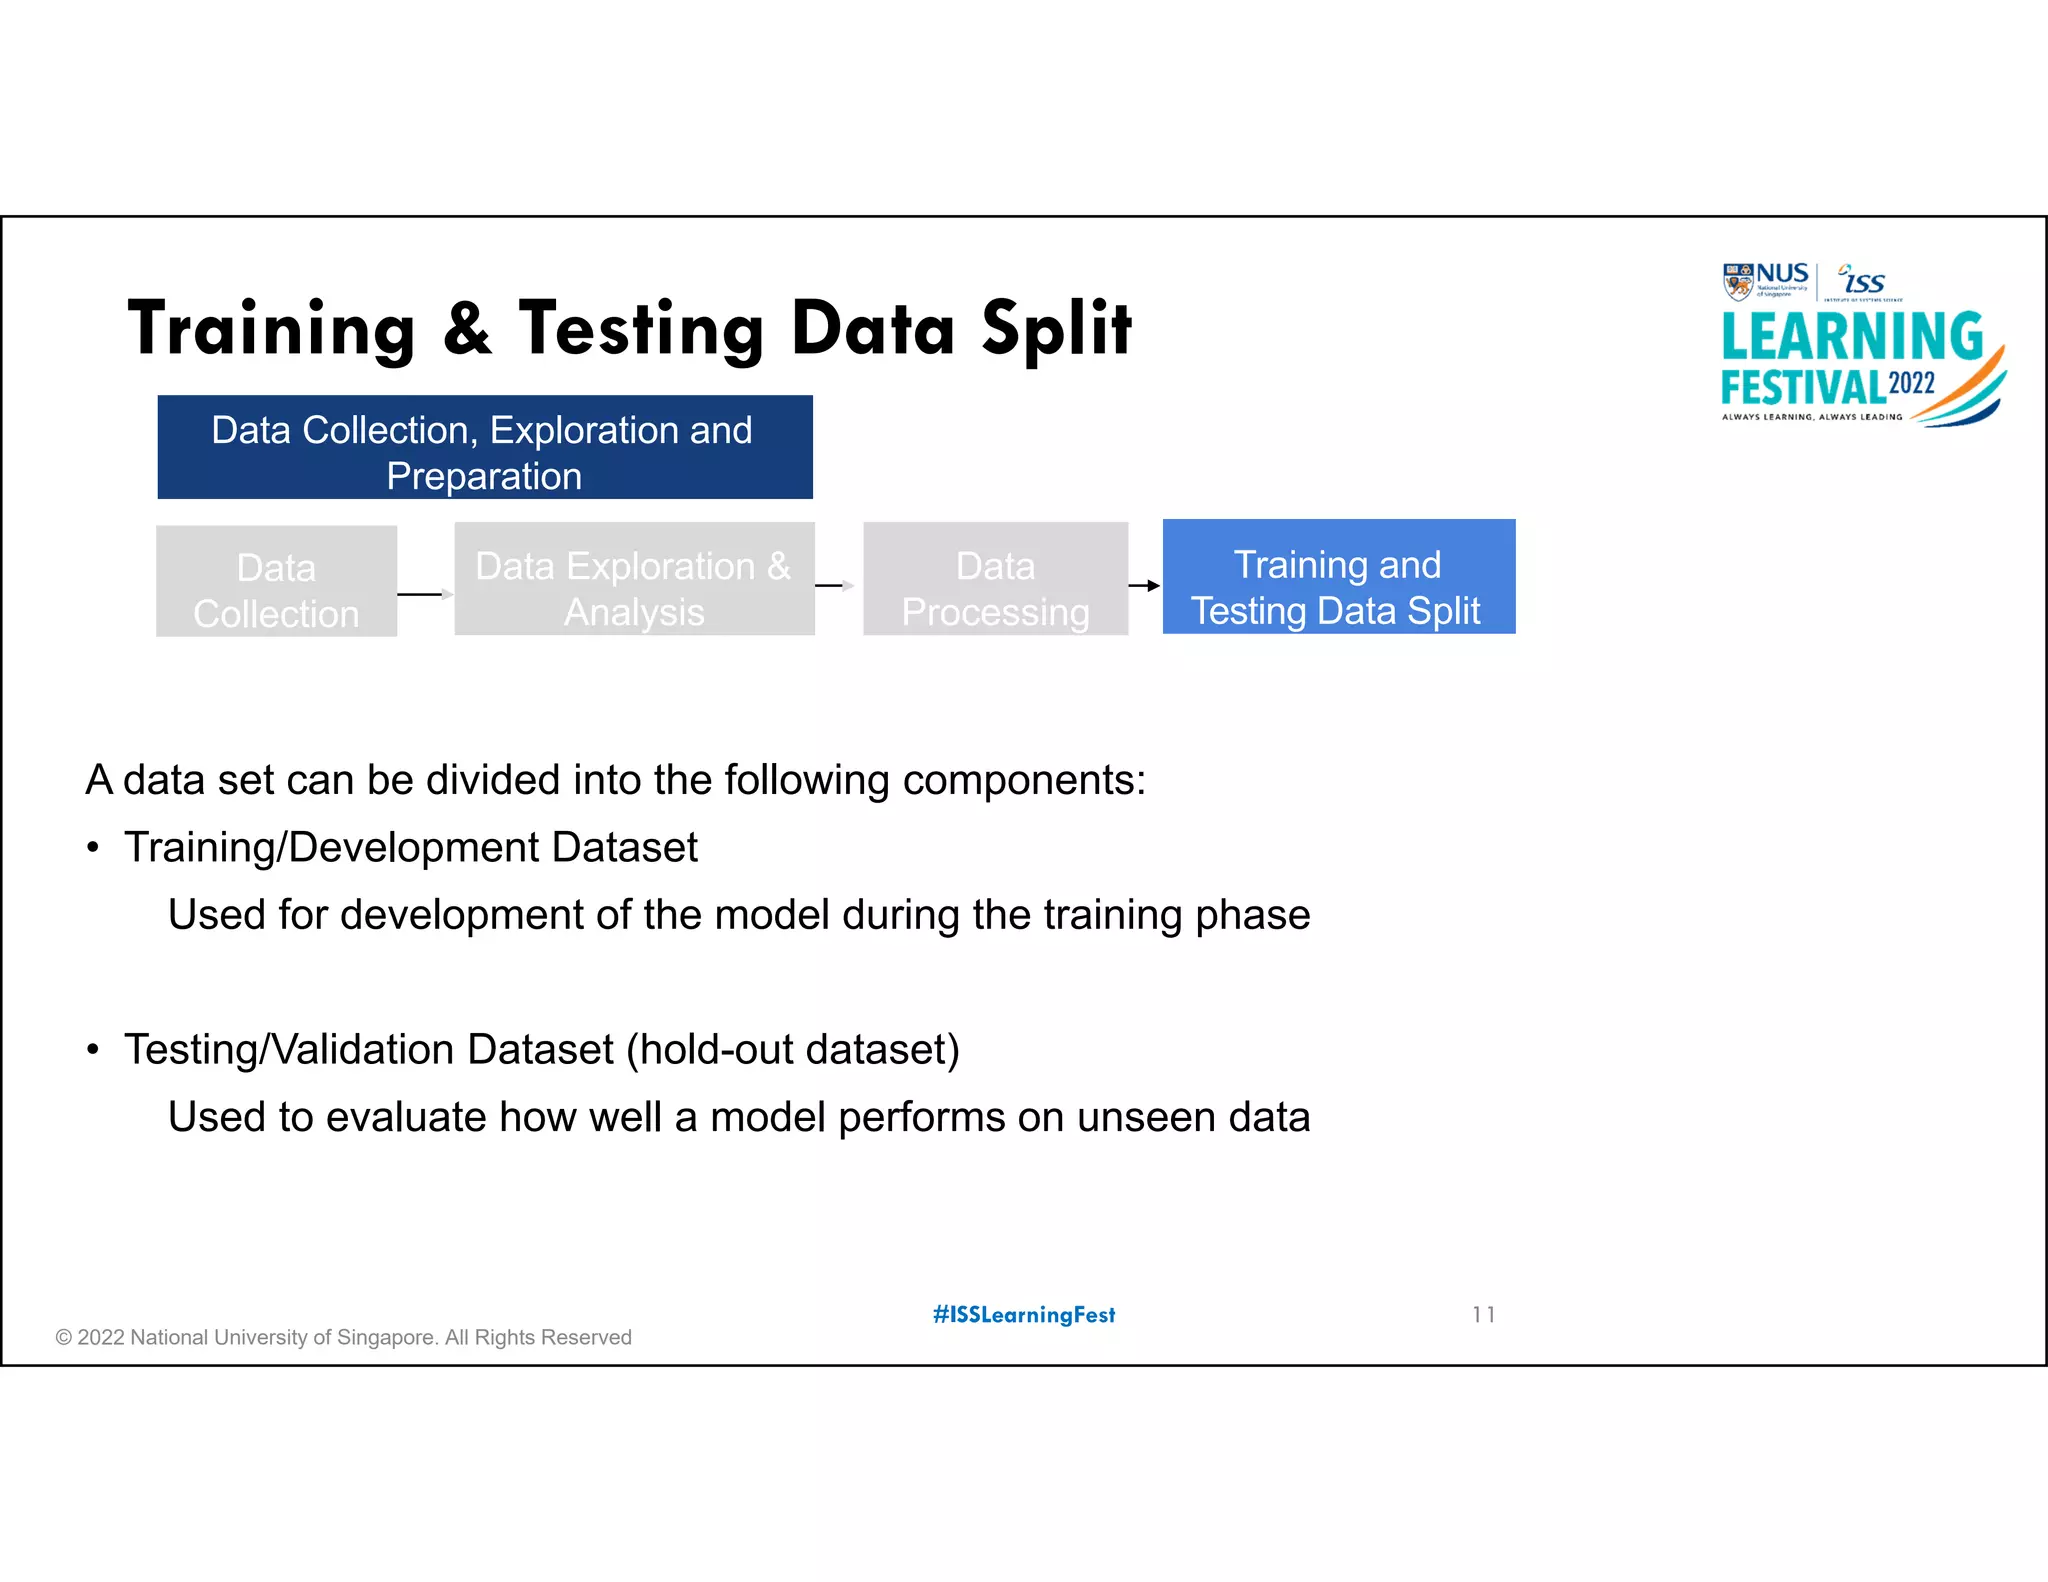
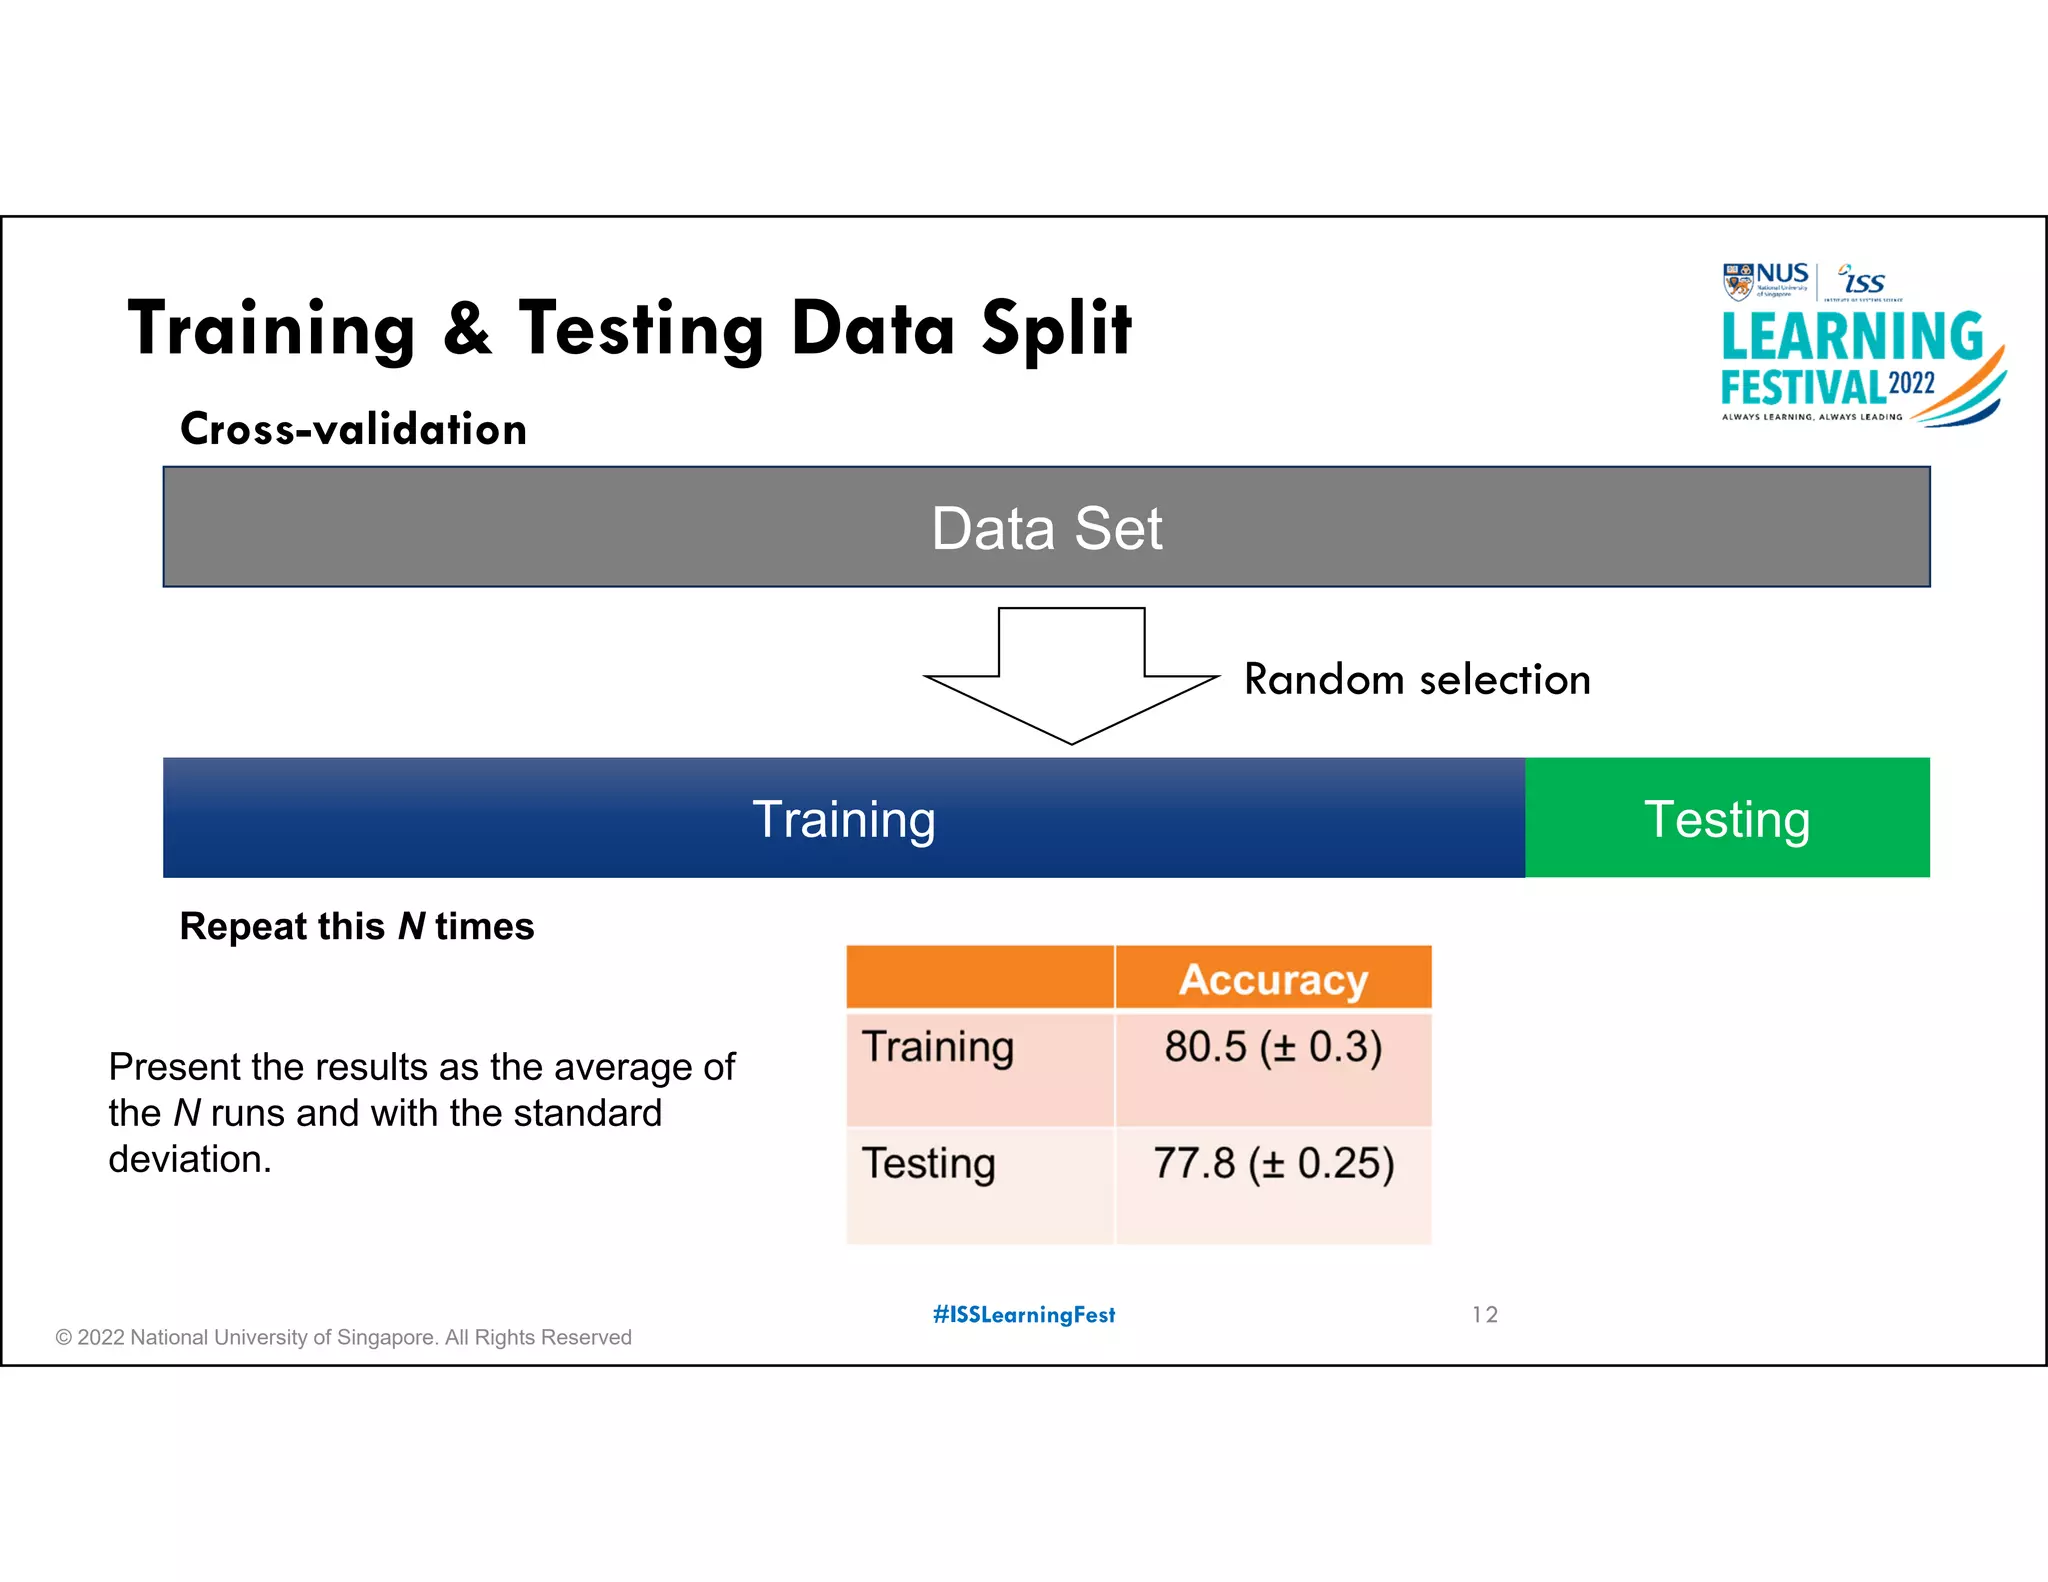
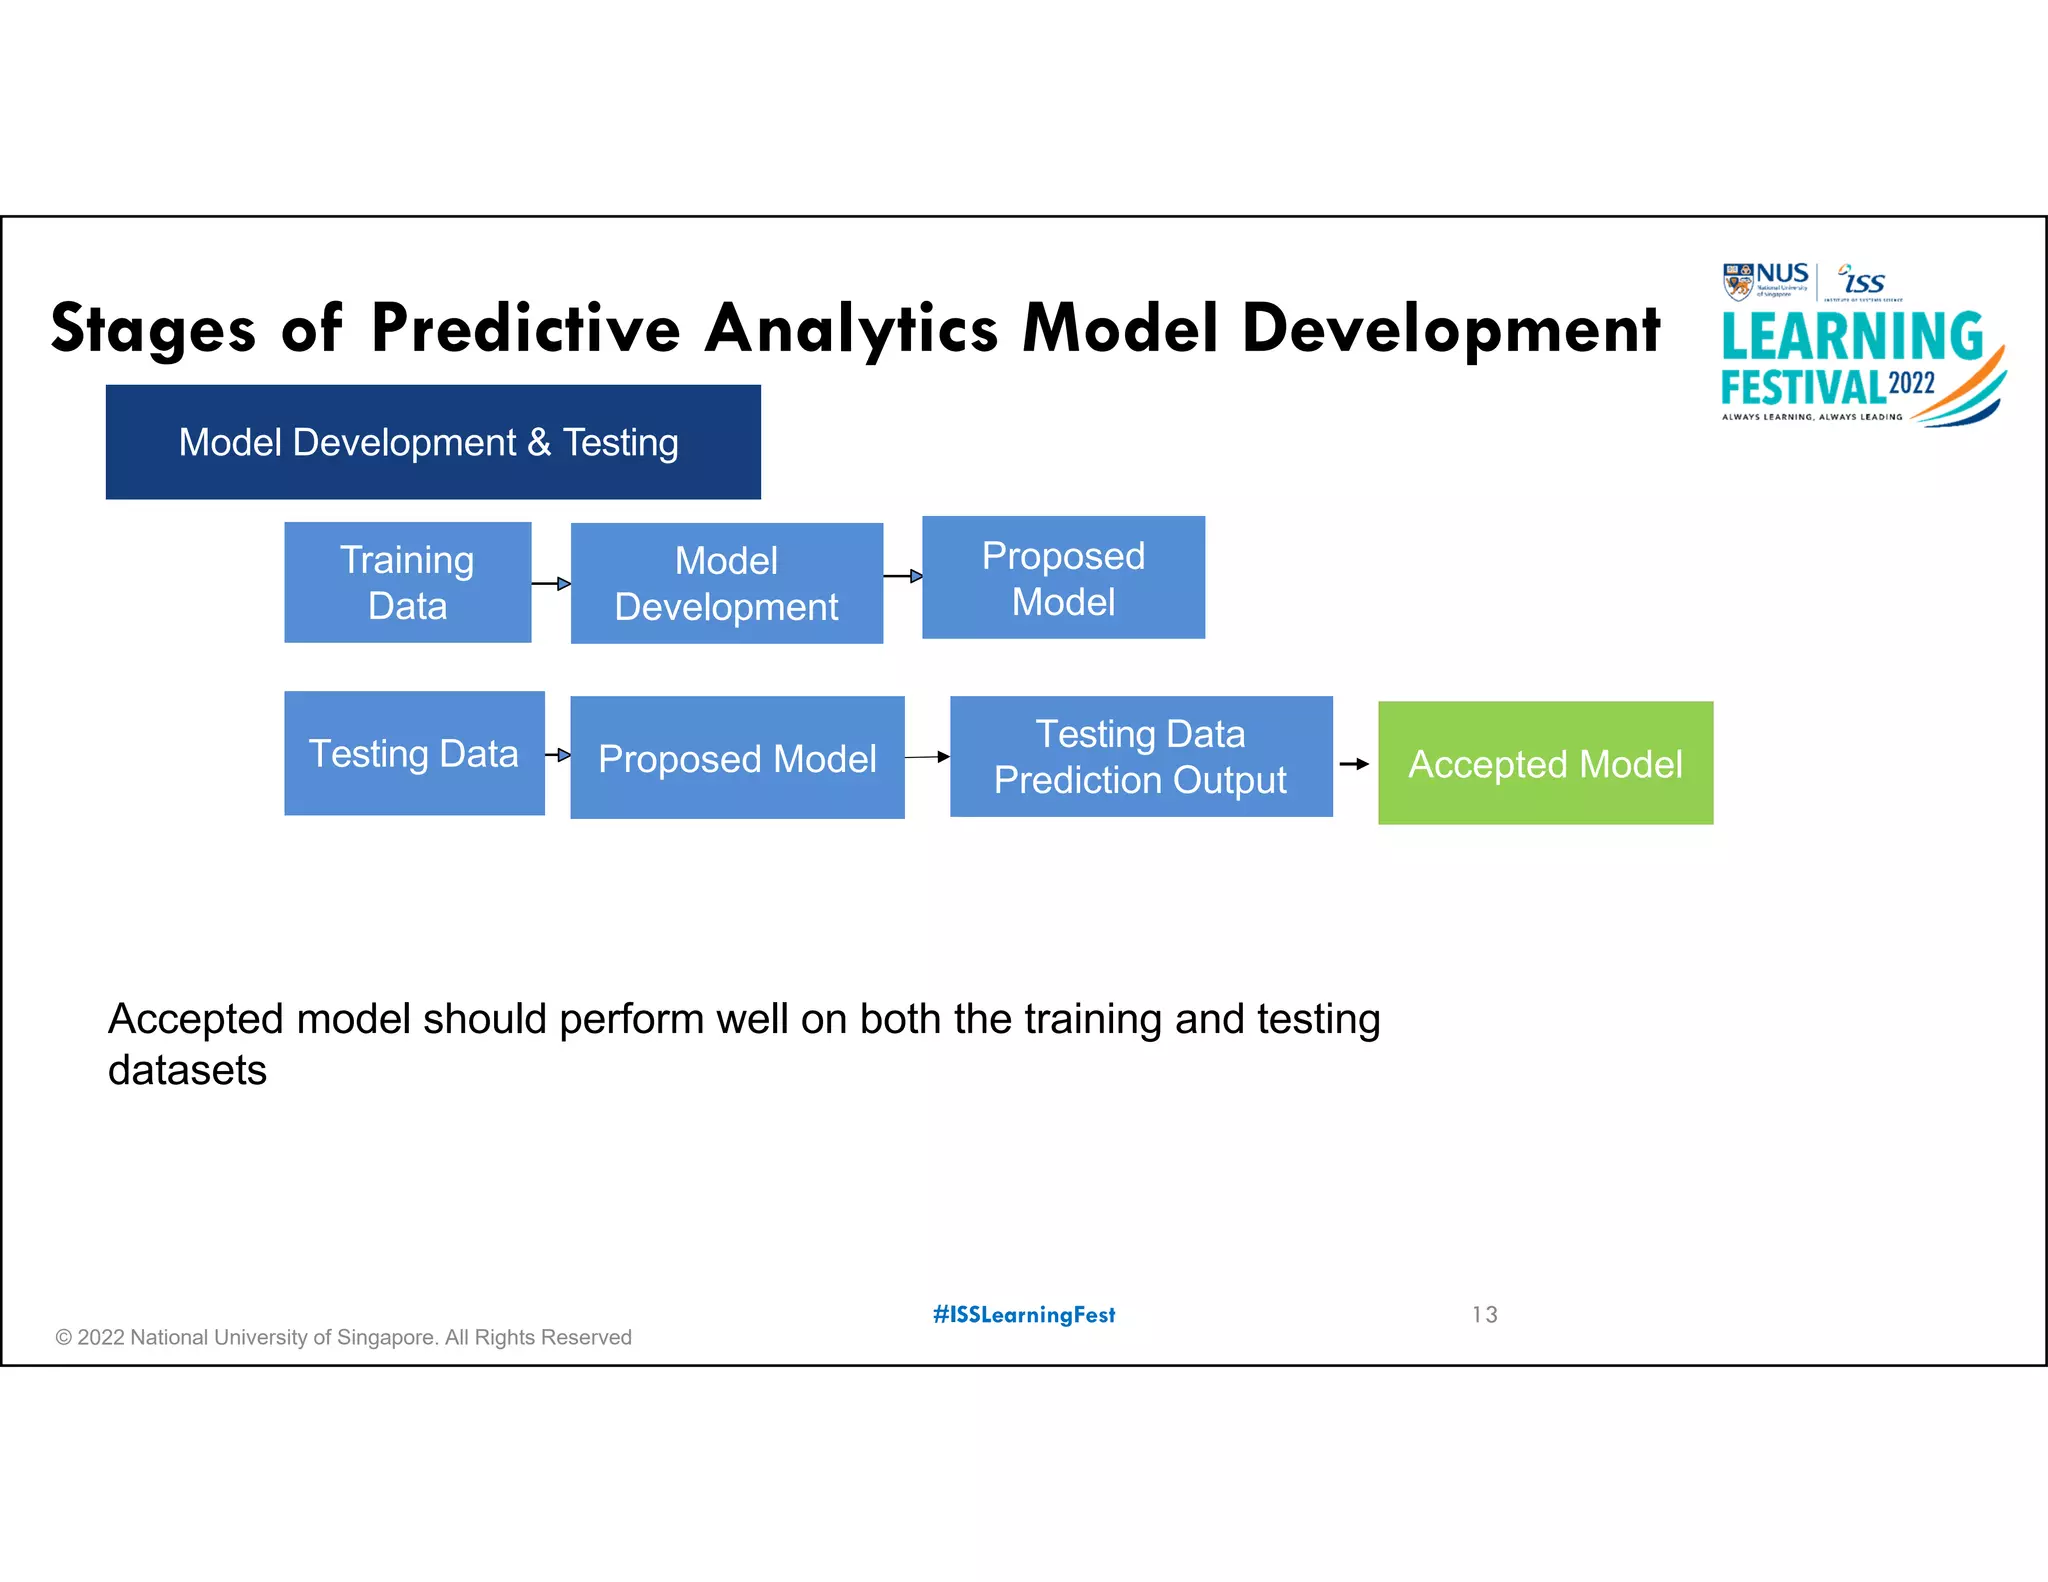
Predictive Analytics
Dr. Brian ANG
Senior Lecturer and Consultant
Data Science
brian_ang@nus.edu.sg
#ISSLearningFest 1
© 2022 National University of Singapore. All Rights Reserved
What is Predictive Analytics?
#ISSLearningFest
Higher
Profit
Cost
Savings
Better
Resource
Allocation
Better
Efficiency
Predict or forecast
future trends or events,
or the likelihood of an
event happening
Predictive
Predictive
Analyse currently available
data using computational
approaches
Analytics
Analytics
To predict or forecast future trends and events based on
currently available data.
To predict or forecast future trends and events based on
currently available data.
2
© 2022 National University of Singapore. All Rights Reserved
#ISSLearningFest
Example Applications of Predictive Analytics
Medical Finance Marketing
Sales Forecast
Predictive
Maintenance
Environmental
Prediction
Icons in this slide deck are from Flaticon.com
3
© 2022 National University of Singapore. All Rights Reserved
#ISSLearningFest
Stages of Predictive Analytics Model Development
Business Objectives and Problem
Statement Identification
Data Collection, Exploration and
Preparation
Model Development & Testing
Model Deployment
Model Monitoring & Maintenance
4
© 2022 National University of Singapore. All Rights Reserved
#ISSLearningFest
Stages of Predictive Analytics Model Development
Business Objectives and Problem
Statement Identification
• Organisations have to identify the need of the predictive analytics model.
This would be more user driven.
• Identify the different stakeholders involved and how the predictive analytics
model will affect them.
• Have to consider cost versus benefit of the model adoption
5
© 2022 National University of Singapore. All Rights Reserved
#ISSLearningFest
Identifying the Stakeholders
Who are the stakeholders?
Anyone who has an interest or is affected by the Predictive Analytics project.
Internal stakeholders
• Project team
• Project sponsors
• Approval authorities/management
• Supporting departments
External stakeholders
• Vendors
• External clients
• Other organisations
6
© 2022 National University of Singapore. All Rights Reserved
#ISSLearningFest
Cost versus Benefit Analysis of Predictive
Analytics Models
Cost in terms of, e.g.,
- Infrastructure
- Manpower
- Maintenance
Benefits in terms of, e.g.,
- Cost savings & efficiency due to better resource allocation using
predictive analytics.
- Increase in profit due to knowing better which factor contributes to sales
7
© 2022 National University of Singapore. All Rights Reserved
#ISSLearningFest
Data
Collection
Data
Processing
Training and
Testing Data Split
Data Exploration &
Analysis
Data Collection, Exploration and
Preparation
Stages of Predictive Analytics Model Development
8
© 2022 National University of Singapore. All Rights Reserved
#ISSLearningFest
Data Collection & Sources of Data
Data
Collection
Data
Processing
Training and
Testing Data Split
Data Exploration &
Analysis
Data Collection, Exploration and
Preparation
Origins
• Within the department/organisation
• External (affiliated) organisations
• Engage vendors for data collection
• Open source data
• Local and overseas sources
9
© 2022 National University of Singapore. All Rights Reserved
#ISSLearningFest
Data Exploration & Pre-Processing
Data
Collection
Data
Processing
Training and
Testing Data Split
Data Exploration &
Analysis
Data Collection, Exploration and
Preparation
• Check whether there are missing data, outliers, erroneous data, etc.
• Perform data pre-processing to transform data into a form that can be
used for model training.
• Current data or new data collected may not be ready for model
training. E.g., the correct features or attributes need to be extracted
and put into the table columns and rows.
10
© 2022 National University of Singapore. All Rights Reserved
#ISSLearningFest
Training & Testing Data Split
A data set can be divided into the following components:
• Training/Development Dataset
Used for development of the model during the training phase
• Testing/Validation Dataset (hold-out dataset)
Used to evaluate how well a model performs on unseen data
Data
Collection
Data
Processing
Training and
Testing Data Split
Data Exploration &
Analysis
Data Collection, Exploration and
Preparation
11
© 2022 National University of Singapore. All Rights Reserved
#ISSLearningFest
Training & Testing Data Split
Data Set
Training Testing
Cross-validation
12
Repeat this N times
Present the results as the average of
the N runs and with the standard
deviation.
Random selection
© 2022 National University of Singapore. All Rights Reserved
#ISSLearningFest
Stages of Predictive Analytics Model Development
Model
Development
Training
Data
Testing Data
Prediction Output
Testing Data
Model Development & Testing
Accepted model should perform well on both the training and testing
datasets
Proposed
Model
Proposed Model Accepted Model
13
© 2022 National University of Singapore. All Rights Reserved
#ISSLearningFest
Predictive Analytics Model Examples
• To predict numeric quantities
• E.g., predict revenue based on
marketing expenditure, car sales
based on car features.
Regression
14
• Predict categorical quantities
• E.g., predict whether a customer will buy a
product or not. Among a few diseases,
which disease is a patient likely to contract.
Classification
• Predict future quantities based previous
trend
• E.g., forecast next few months
temperature based on historical data.
Forecasting
© 2022 National University of Singapore. All Rights Reserved
#ISSLearningFest
Regression Model Examples
Fit a straight line for a given set of points
y=bo+b1x1+b2x2+b3x3 +b4x4 +b5x5 + e
y=bo+b1x1+b2𝑥 + e
Simple Linear Regression Model Quadratic regression model
Multiple Linear Regression model
15
y=bo+b1x1+ e
0
10000
20000
30000
40000
50000
60000
70000
80000
90000
10 30 50 70
Healthcare
Cost
Age
Predicted Value
Actual Value
Residual
© 2022 National University of Singapore. All Rights Reserved
#ISSLearningFest
Classification Model Examples
Image from:
https://www.ibm.com/cloud/blog/ai-vs-machine-learning-vs-deep-learning-vs-neural-networks
Image from: https://en.wikipedia.org/wiki/Random_forest
16
© 2022 National University of Singapore. All Rights Reserved
#ISSLearningFest
Forecasting Model Examples
Auto-Regressive Integrated Moving Average (ARIMA)
or the
Seasonal ARIMA models
(p,d,q) (P,D,Q)s
Seasonal Component
Non-Seasonal Component
17
© 2022 National University of Singapore. All Rights Reserved
#ISSLearningFest
Evaluation of Regression & Time Series Models
𝑅𝑜𝑜𝑡 𝑀𝑒𝑎𝑛 𝑆𝑞𝑢𝑎𝑟𝑒 𝐸𝑟𝑟𝑜𝑟 𝑅𝑀𝑆𝐸
∑ 𝑒
𝑛
𝑀𝑒𝑎𝑛 𝐴𝑏𝑠𝑜𝑙𝑢𝑡𝑒 𝑃𝑒𝑟𝑐𝑒𝑛𝑡 𝐷𝑒𝑣𝑖𝑎𝑡𝑖𝑜𝑛 𝑀𝐴𝑃𝐷
100%
𝑛
|
𝑒
𝑦
|
Error: 𝑒 𝑦 𝑦
18
© 2022 National University of Singapore. All Rights Reserved
#ISSLearningFest
Evaluation of Classification Models
𝑛
• Accuracy =
𝑐
× 100%
• Is accuracy the only evaluation metric?
Where
- c is the total number of correctly classified samples
- n is the total number of samples
19
© 2022 National University of Singapore. All Rights Reserved
#ISSLearningFest
Confusion Matrix
Predicted Values
Negative Positive
Actual
Values
Negative
Positive
We can further analyze the model performance by breaking down the results.
Consider a Binary Classification Problem
20
True Negative (TN)
True Positive (TP)
False Negative (FN)
False Positive (FP)
© 2022 National University of Singapore. All Rights Reserved
#ISSLearningFest
Confusion Matrix
Predicted Values
Negative Positive
Actual
Values
Negative True Negative (TN) False Positive (FP)
Positive False Negative (FN) True Positive (TP)
- Accuracy = (TP+TN)/(TP+TN+FP+FN) %
- Specificity = TN/(TN+FP)
Example: Percentage of patients correctly predicted as not having a certain disease, or
percentage of transactions correctly predicted as not fraud.
- Sensitivity = TP/(TP+FN)
Example: Percentage of patients correctly predicted as having certain disease, or
percentage of transactions correctly predicted as fraud.
21
© 2022 National University of Singapore. All Rights Reserved
#ISSLearningFest
Try it Out
Predicted Values
Negative Positive
Actual
Values
Negative 765 55
Positive 154 26
Accuracy = (765+26)/1000 = 79.1% Accuracy = (605+138)/1000 = 74.3%
Specificity = 765/(765+55) = 0.933
Sensitivity= 26/(26+154) = 0.14
Specificity = 605/(605+215) = 0.738
Sensitivity = 138/(42+138) = 0.767
Model 1 Model 2
Predicted Values
Negative Positive
Actual
Values
Negative 605 215
Positive 42 138
22
One may be more interested in sensitivity, e.g., in identifying patients who are
going to get a certain disease or a transaction being a fraud.
© 2022 National University of Singapore. All Rights Reserved
#ISSLearningFest
Selecting the Best Model
Accuracy Model 1a Model 1b Model2a Model2b Model3
Training 80.5 (± 0.3) 83.5 (± 2.3) 82.5 (± 1.35) 81.5 (± 0.3) 83.2 (± 1.3)
Testing 77.8 (± 0.25) 78.5 (± 3.8) 79.8 (± 0.22) 75.8 (± 0.15) 80.7 (± 0.28)
• One may try different models
• Same model with different hyper-parameters
• Need to compare across the various models before choosing the best model
23
© 2022 National University of Singapore. All Rights Reserved
#ISSLearningFest
Model Deployment
Model Deployment
24
Consideration examples:
• Communication plans to staff or users of the analytics model, timeline
and action items for the deployment.
• Which teams are involved in the deployment? Are the various teams
aware and sufficiently engaged?
• When, where and how to deploy the model?
© 2022 National University of Singapore. All Rights Reserved
#ISSLearningFest
Model Monitoring and Maintenance
Model Monitoring & Maintenance
• After the model is deployed, the model has to be monitored to
ensure that it is working the way it is intended.
• It needs to be maintained so that it is updated and relevant.
• New data may be added to the older data (some cases but not
always) to retrain the whole model
• Some models allow incremental training, i.e., do not need to
retrain the whole model.
25
© 2022 National University of Singapore. All Rights Reserved
#ISSLearningFest
How Often Should Models be Updated?
Model review & update may be performed at:
• Regular Interval
• Performance has degraded
• Ad hoc
• New and better algorithms are available
26
© 2022 National University of Singapore. All Rights Reserved
#ISSLearningFest
Stages of Predictive Analytics Model Development
Business Objectives and Problem
Statement Identification
Data Collection, Exploration and
Preparation
Model Development & Testing
Model Deployment
Model Monitoring & Maintenance
27
© 2022 National University of Singapore. All Rights Reserved
#ISSLearningFest
https://www.iss.nus.edu.sg/
28
Give Us Your Feedback
#ISSLearningFest
Day 2 Programme
29
Thank You!
#ISSLearningFest 30
Q & A
#ISSLearningFest 31
Predictive Analytics Talk
Survey
#ISSLearningFest 32
https://forms.gle/2zYmocqC7AyCu6ua9
Thank You!
#ISSLearningFest 33
brian_ang@nus.edu.sg

Predictive Analytics

  • 1.
    Predictive Analytics Dr. BrianANG Senior Lecturer and Consultant Data Science brian_ang@nus.edu.sg #ISSLearningFest 1
  • 2.
    © 2022 NationalUniversity of Singapore. All Rights Reserved What is Predictive Analytics? #ISSLearningFest Higher Profit Cost Savings Better Resource Allocation Better Efficiency Predict or forecast future trends or events, or the likelihood of an event happening Predictive Predictive Analyse currently available data using computational approaches Analytics Analytics To predict or forecast future trends and events based on currently available data. To predict or forecast future trends and events based on currently available data. 2
  • 3.
    © 2022 NationalUniversity of Singapore. All Rights Reserved #ISSLearningFest Example Applications of Predictive Analytics Medical Finance Marketing Sales Forecast Predictive Maintenance Environmental Prediction Icons in this slide deck are from Flaticon.com 3
  • 4.
    © 2022 NationalUniversity of Singapore. All Rights Reserved #ISSLearningFest Stages of Predictive Analytics Model Development Business Objectives and Problem Statement Identification Data Collection, Exploration and Preparation Model Development & Testing Model Deployment Model Monitoring & Maintenance 4
  • 5.
    © 2022 NationalUniversity of Singapore. All Rights Reserved #ISSLearningFest Stages of Predictive Analytics Model Development Business Objectives and Problem Statement Identification • Organisations have to identify the need of the predictive analytics model. This would be more user driven. • Identify the different stakeholders involved and how the predictive analytics model will affect them. • Have to consider cost versus benefit of the model adoption 5
  • 6.
    © 2022 NationalUniversity of Singapore. All Rights Reserved #ISSLearningFest Identifying the Stakeholders Who are the stakeholders? Anyone who has an interest or is affected by the Predictive Analytics project. Internal stakeholders • Project team • Project sponsors • Approval authorities/management • Supporting departments External stakeholders • Vendors • External clients • Other organisations 6
  • 7.
    © 2022 NationalUniversity of Singapore. All Rights Reserved #ISSLearningFest Cost versus Benefit Analysis of Predictive Analytics Models Cost in terms of, e.g., - Infrastructure - Manpower - Maintenance Benefits in terms of, e.g., - Cost savings & efficiency due to better resource allocation using predictive analytics. - Increase in profit due to knowing better which factor contributes to sales 7
  • 8.
    © 2022 NationalUniversity of Singapore. All Rights Reserved #ISSLearningFest Data Collection Data Processing Training and Testing Data Split Data Exploration & Analysis Data Collection, Exploration and Preparation Stages of Predictive Analytics Model Development 8
  • 9.
    © 2022 NationalUniversity of Singapore. All Rights Reserved #ISSLearningFest Data Collection & Sources of Data Data Collection Data Processing Training and Testing Data Split Data Exploration & Analysis Data Collection, Exploration and Preparation Origins • Within the department/organisation • External (affiliated) organisations • Engage vendors for data collection • Open source data • Local and overseas sources 9
  • 10.
    © 2022 NationalUniversity of Singapore. All Rights Reserved #ISSLearningFest Data Exploration & Pre-Processing Data Collection Data Processing Training and Testing Data Split Data Exploration & Analysis Data Collection, Exploration and Preparation • Check whether there are missing data, outliers, erroneous data, etc. • Perform data pre-processing to transform data into a form that can be used for model training. • Current data or new data collected may not be ready for model training. E.g., the correct features or attributes need to be extracted and put into the table columns and rows. 10
  • 11.
    © 2022 NationalUniversity of Singapore. All Rights Reserved #ISSLearningFest Training & Testing Data Split A data set can be divided into the following components: • Training/Development Dataset Used for development of the model during the training phase • Testing/Validation Dataset (hold-out dataset) Used to evaluate how well a model performs on unseen data Data Collection Data Processing Training and Testing Data Split Data Exploration & Analysis Data Collection, Exploration and Preparation 11
  • 12.
    © 2022 NationalUniversity of Singapore. All Rights Reserved #ISSLearningFest Training & Testing Data Split Data Set Training Testing Cross-validation 12 Repeat this N times Present the results as the average of the N runs and with the standard deviation. Random selection
  • 13.
    © 2022 NationalUniversity of Singapore. All Rights Reserved #ISSLearningFest Stages of Predictive Analytics Model Development Model Development Training Data Testing Data Prediction Output Testing Data Model Development & Testing Accepted model should perform well on both the training and testing datasets Proposed Model Proposed Model Accepted Model 13
  • 14.
    © 2022 NationalUniversity of Singapore. All Rights Reserved #ISSLearningFest Predictive Analytics Model Examples • To predict numeric quantities • E.g., predict revenue based on marketing expenditure, car sales based on car features. Regression 14 • Predict categorical quantities • E.g., predict whether a customer will buy a product or not. Among a few diseases, which disease is a patient likely to contract. Classification • Predict future quantities based previous trend • E.g., forecast next few months temperature based on historical data. Forecasting
  • 15.
    © 2022 NationalUniversity of Singapore. All Rights Reserved #ISSLearningFest Regression Model Examples Fit a straight line for a given set of points y=bo+b1x1+b2x2+b3x3 +b4x4 +b5x5 + e y=bo+b1x1+b2𝑥 + e Simple Linear Regression Model Quadratic regression model Multiple Linear Regression model 15 y=bo+b1x1+ e 0 10000 20000 30000 40000 50000 60000 70000 80000 90000 10 30 50 70 Healthcare Cost Age Predicted Value Actual Value Residual
  • 16.
    © 2022 NationalUniversity of Singapore. All Rights Reserved #ISSLearningFest Classification Model Examples Image from: https://www.ibm.com/cloud/blog/ai-vs-machine-learning-vs-deep-learning-vs-neural-networks Image from: https://en.wikipedia.org/wiki/Random_forest 16
  • 17.
    © 2022 NationalUniversity of Singapore. All Rights Reserved #ISSLearningFest Forecasting Model Examples Auto-Regressive Integrated Moving Average (ARIMA) or the Seasonal ARIMA models (p,d,q) (P,D,Q)s Seasonal Component Non-Seasonal Component 17
  • 18.
    © 2022 NationalUniversity of Singapore. All Rights Reserved #ISSLearningFest Evaluation of Regression & Time Series Models 𝑅𝑜𝑜𝑡 𝑀𝑒𝑎𝑛 𝑆𝑞𝑢𝑎𝑟𝑒 𝐸𝑟𝑟𝑜𝑟 𝑅𝑀𝑆𝐸 ∑ 𝑒 𝑛 𝑀𝑒𝑎𝑛 𝐴𝑏𝑠𝑜𝑙𝑢𝑡𝑒 𝑃𝑒𝑟𝑐𝑒𝑛𝑡 𝐷𝑒𝑣𝑖𝑎𝑡𝑖𝑜𝑛 𝑀𝐴𝑃𝐷 100% 𝑛 | 𝑒 𝑦 | Error: 𝑒 𝑦 𝑦 18
  • 19.
    © 2022 NationalUniversity of Singapore. All Rights Reserved #ISSLearningFest Evaluation of Classification Models 𝑛 • Accuracy = 𝑐 × 100% • Is accuracy the only evaluation metric? Where - c is the total number of correctly classified samples - n is the total number of samples 19
  • 20.
    © 2022 NationalUniversity of Singapore. All Rights Reserved #ISSLearningFest Confusion Matrix Predicted Values Negative Positive Actual Values Negative Positive We can further analyze the model performance by breaking down the results. Consider a Binary Classification Problem 20 True Negative (TN) True Positive (TP) False Negative (FN) False Positive (FP)
  • 21.
    © 2022 NationalUniversity of Singapore. All Rights Reserved #ISSLearningFest Confusion Matrix Predicted Values Negative Positive Actual Values Negative True Negative (TN) False Positive (FP) Positive False Negative (FN) True Positive (TP) - Accuracy = (TP+TN)/(TP+TN+FP+FN) % - Specificity = TN/(TN+FP) Example: Percentage of patients correctly predicted as not having a certain disease, or percentage of transactions correctly predicted as not fraud. - Sensitivity = TP/(TP+FN) Example: Percentage of patients correctly predicted as having certain disease, or percentage of transactions correctly predicted as fraud. 21
  • 22.
    © 2022 NationalUniversity of Singapore. All Rights Reserved #ISSLearningFest Try it Out Predicted Values Negative Positive Actual Values Negative 765 55 Positive 154 26 Accuracy = (765+26)/1000 = 79.1% Accuracy = (605+138)/1000 = 74.3% Specificity = 765/(765+55) = 0.933 Sensitivity= 26/(26+154) = 0.14 Specificity = 605/(605+215) = 0.738 Sensitivity = 138/(42+138) = 0.767 Model 1 Model 2 Predicted Values Negative Positive Actual Values Negative 605 215 Positive 42 138 22 One may be more interested in sensitivity, e.g., in identifying patients who are going to get a certain disease or a transaction being a fraud.
  • 23.
    © 2022 NationalUniversity of Singapore. All Rights Reserved #ISSLearningFest Selecting the Best Model Accuracy Model 1a Model 1b Model2a Model2b Model3 Training 80.5 (± 0.3) 83.5 (± 2.3) 82.5 (± 1.35) 81.5 (± 0.3) 83.2 (± 1.3) Testing 77.8 (± 0.25) 78.5 (± 3.8) 79.8 (± 0.22) 75.8 (± 0.15) 80.7 (± 0.28) • One may try different models • Same model with different hyper-parameters • Need to compare across the various models before choosing the best model 23
  • 24.
    © 2022 NationalUniversity of Singapore. All Rights Reserved #ISSLearningFest Model Deployment Model Deployment 24 Consideration examples: • Communication plans to staff or users of the analytics model, timeline and action items for the deployment. • Which teams are involved in the deployment? Are the various teams aware and sufficiently engaged? • When, where and how to deploy the model?
  • 25.
    © 2022 NationalUniversity of Singapore. All Rights Reserved #ISSLearningFest Model Monitoring and Maintenance Model Monitoring & Maintenance • After the model is deployed, the model has to be monitored to ensure that it is working the way it is intended. • It needs to be maintained so that it is updated and relevant. • New data may be added to the older data (some cases but not always) to retrain the whole model • Some models allow incremental training, i.e., do not need to retrain the whole model. 25
  • 26.
    © 2022 NationalUniversity of Singapore. All Rights Reserved #ISSLearningFest How Often Should Models be Updated? Model review & update may be performed at: • Regular Interval • Performance has degraded • Ad hoc • New and better algorithms are available 26
  • 27.
    © 2022 NationalUniversity of Singapore. All Rights Reserved #ISSLearningFest Stages of Predictive Analytics Model Development Business Objectives and Problem Statement Identification Data Collection, Exploration and Preparation Model Development & Testing Model Deployment Model Monitoring & Maintenance 27
  • 28.
    © 2022 NationalUniversity of Singapore. All Rights Reserved #ISSLearningFest https://www.iss.nus.edu.sg/ 28
  • 29.
    Give Us YourFeedback #ISSLearningFest Day 2 Programme 29
  • 30.
  • 31.
  • 32.
    Predictive Analytics Talk Survey #ISSLearningFest32 https://forms.gle/2zYmocqC7AyCu6ua9
  • 33.