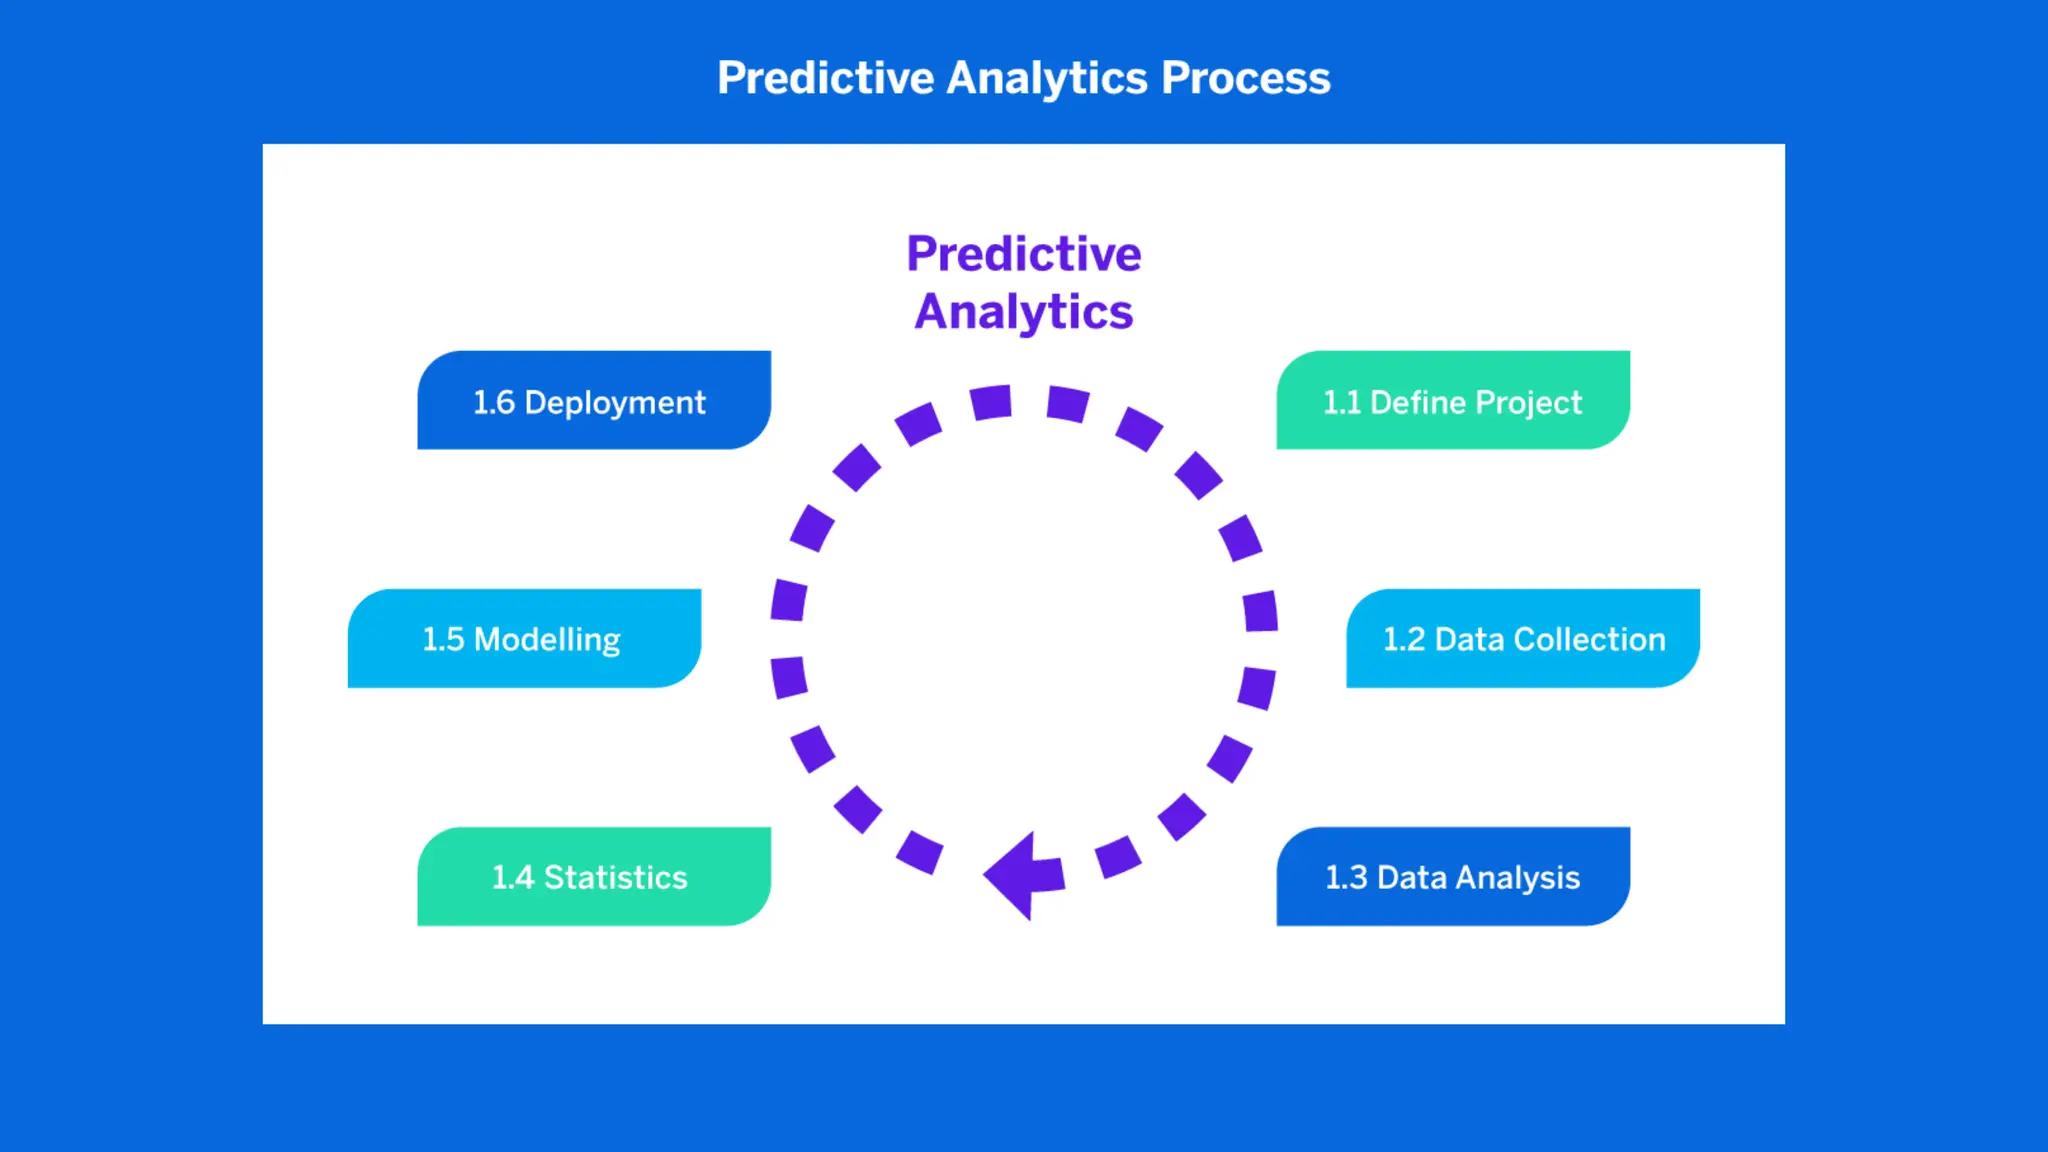
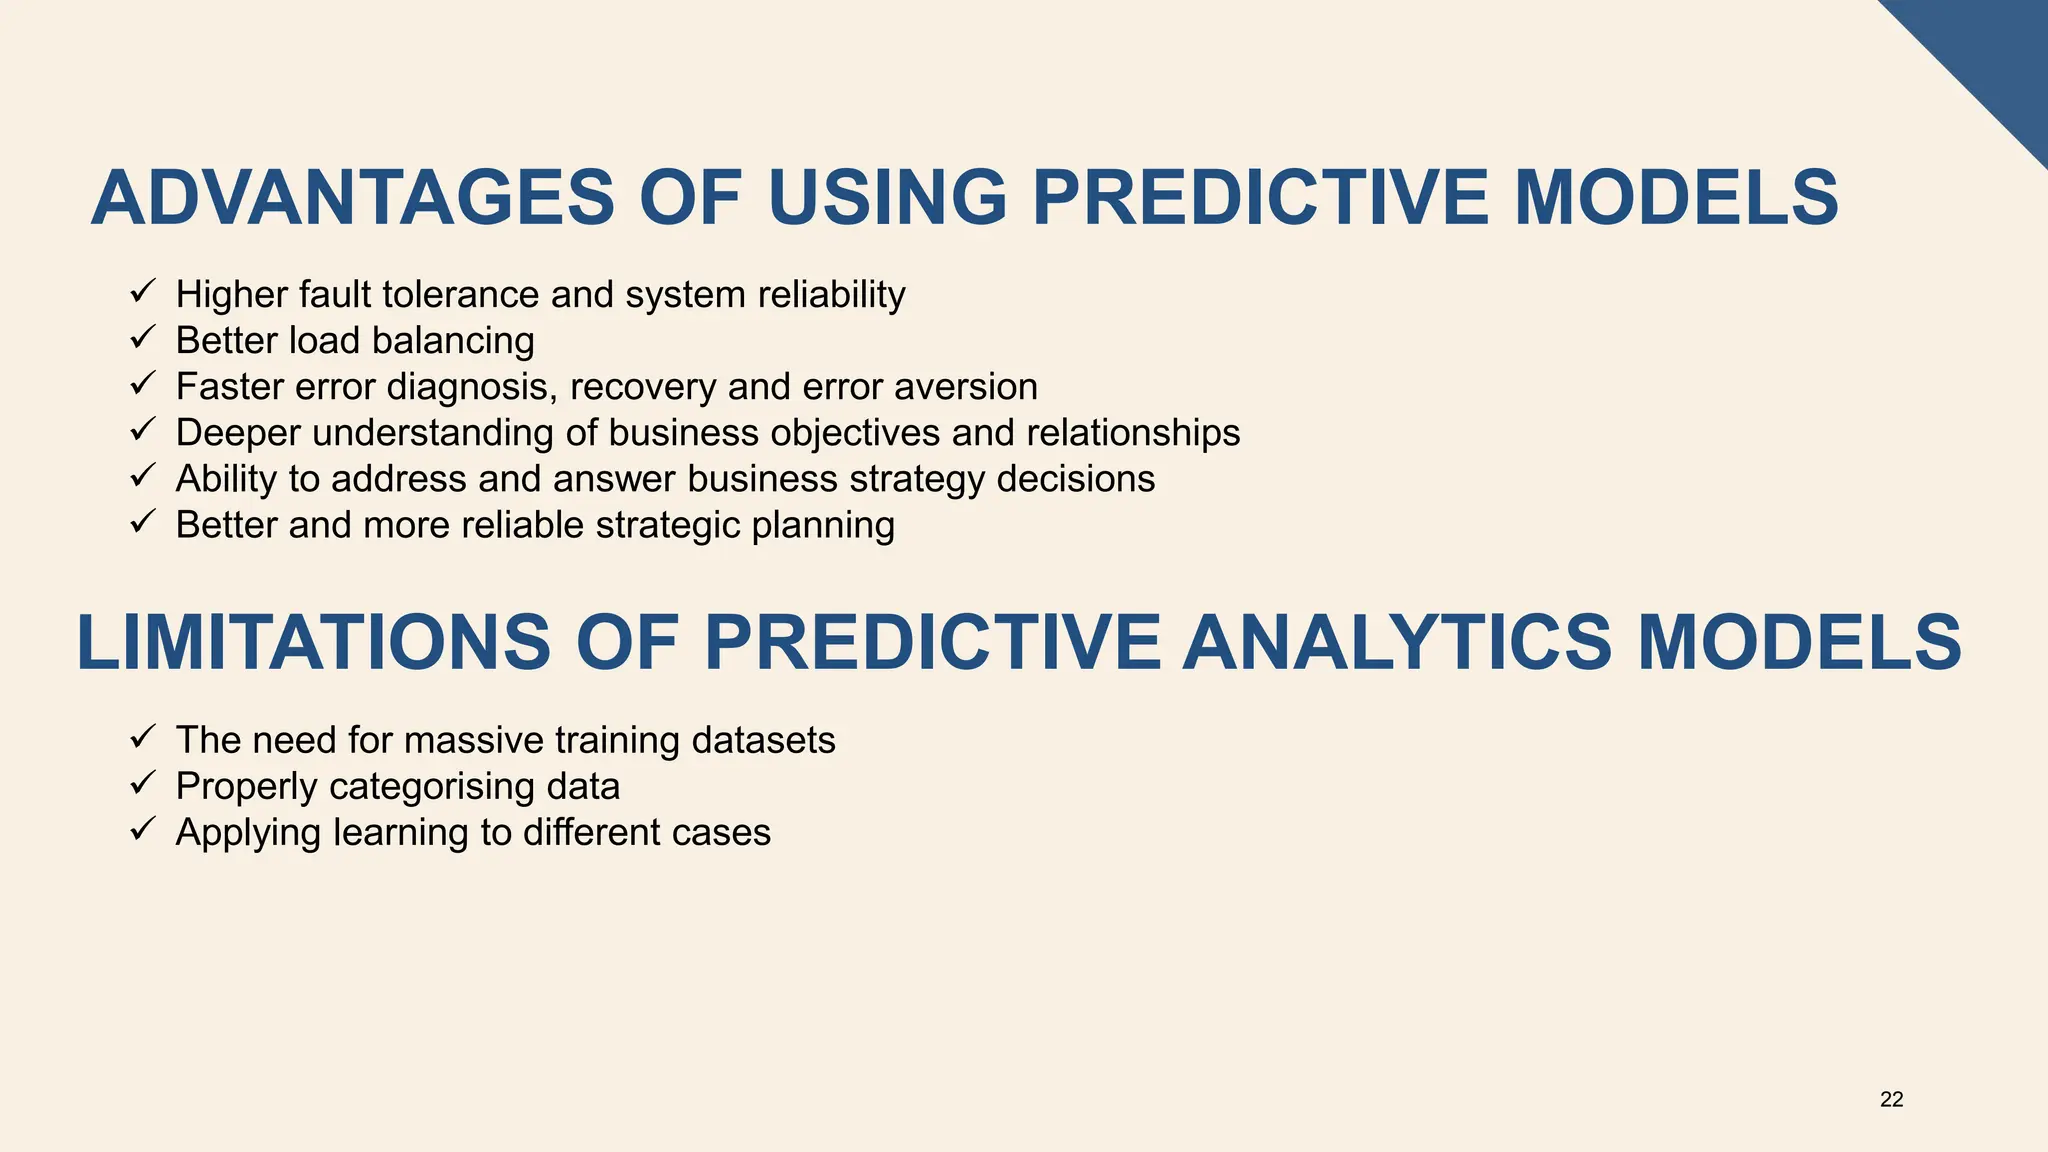
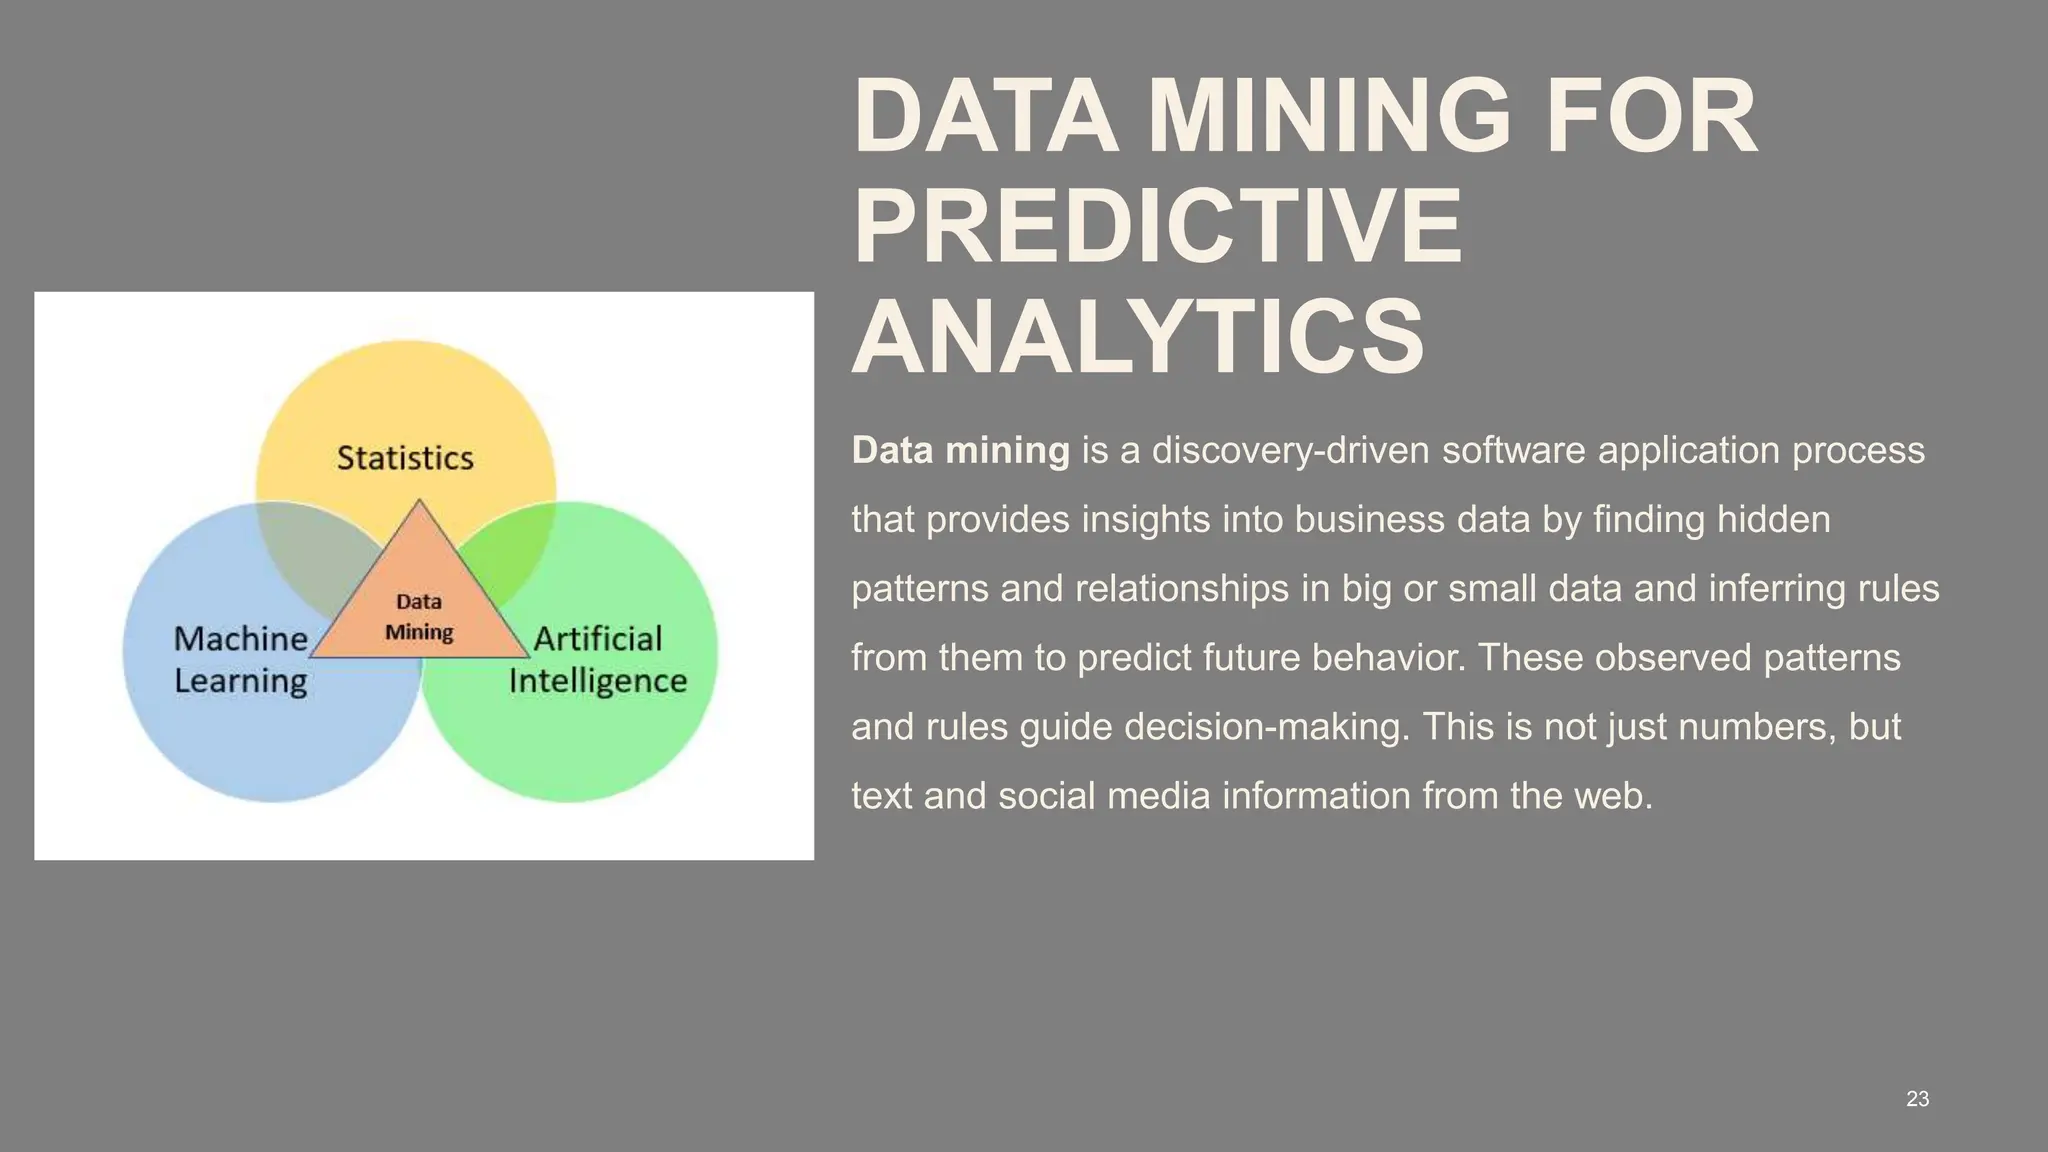
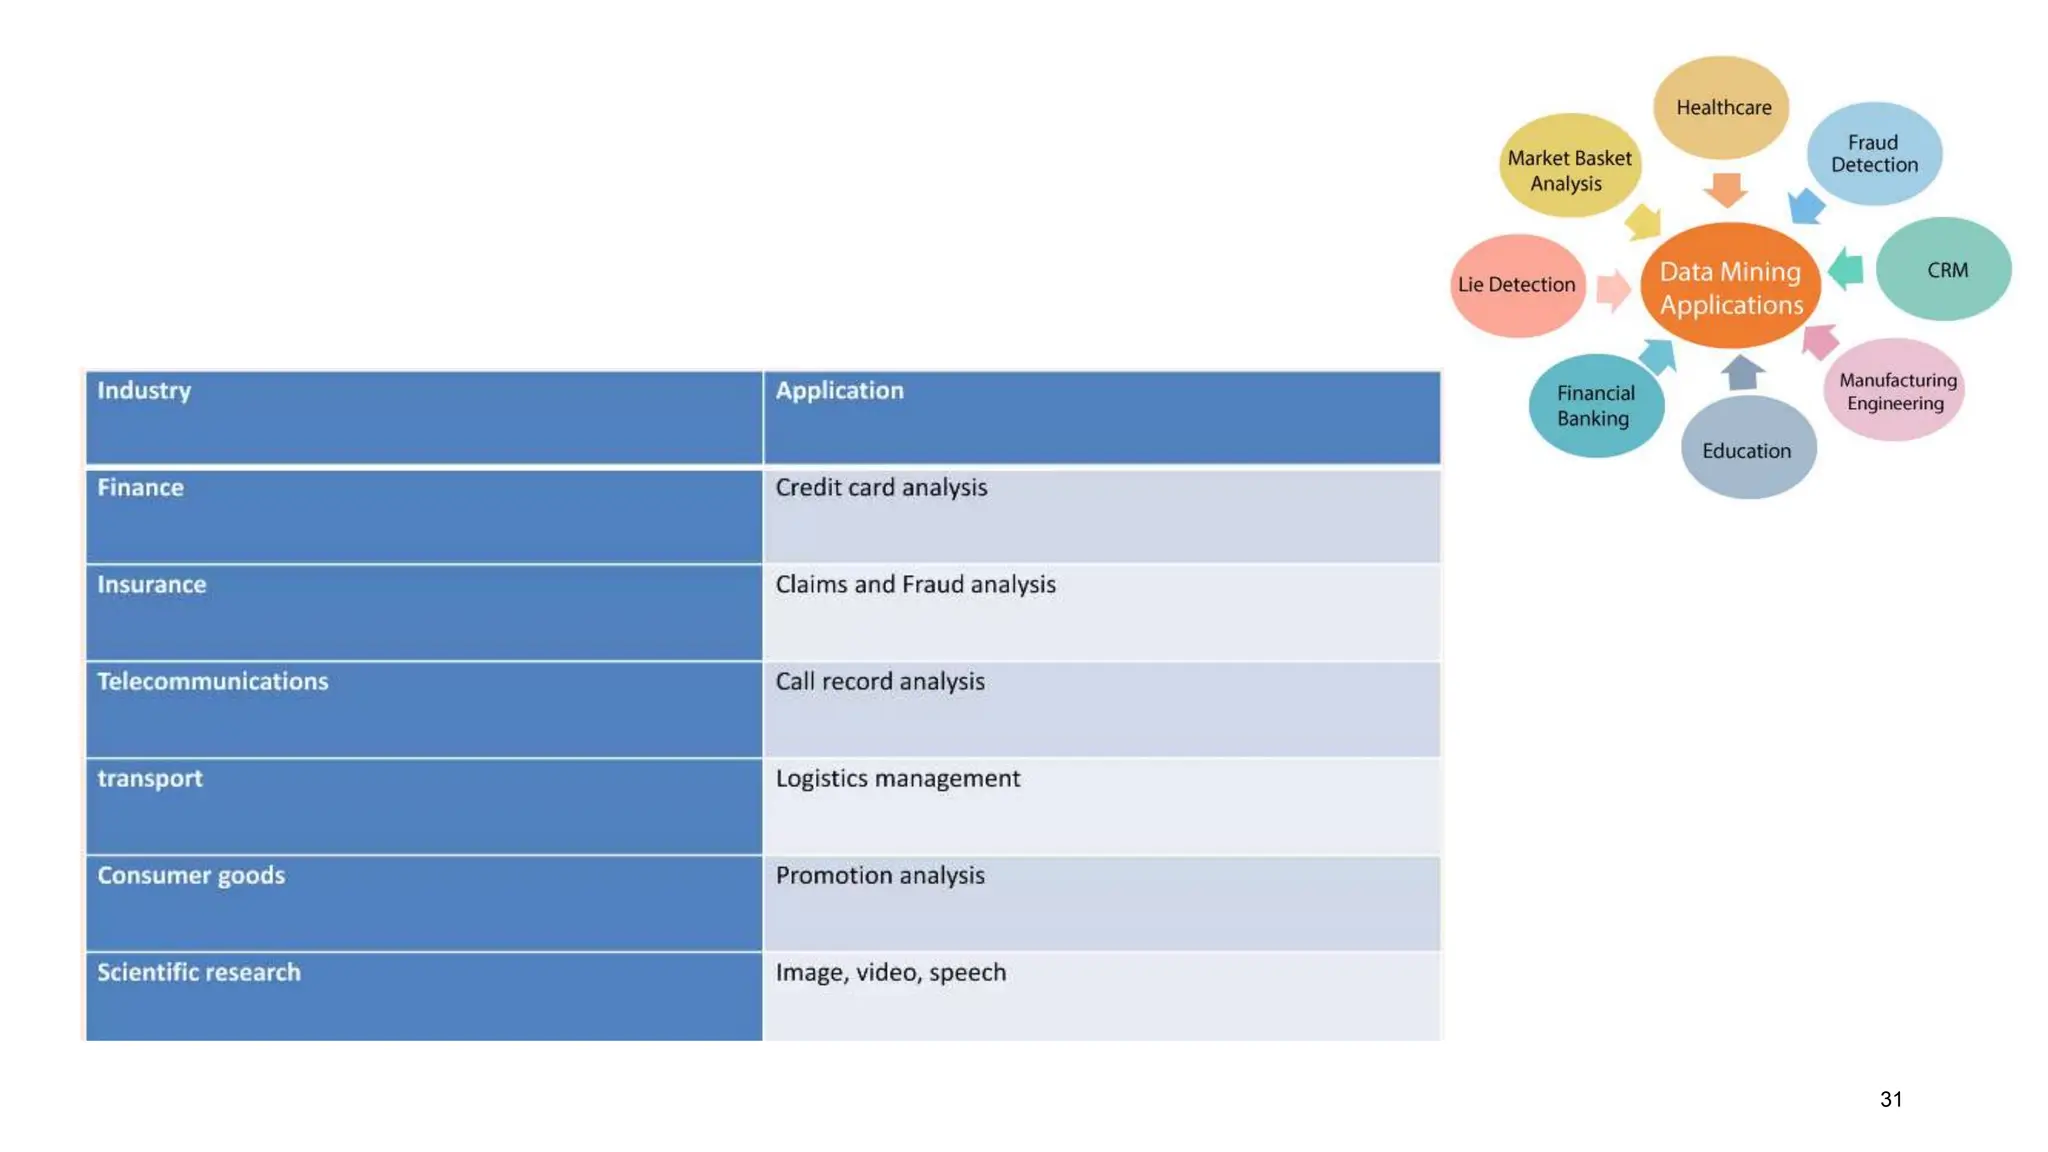
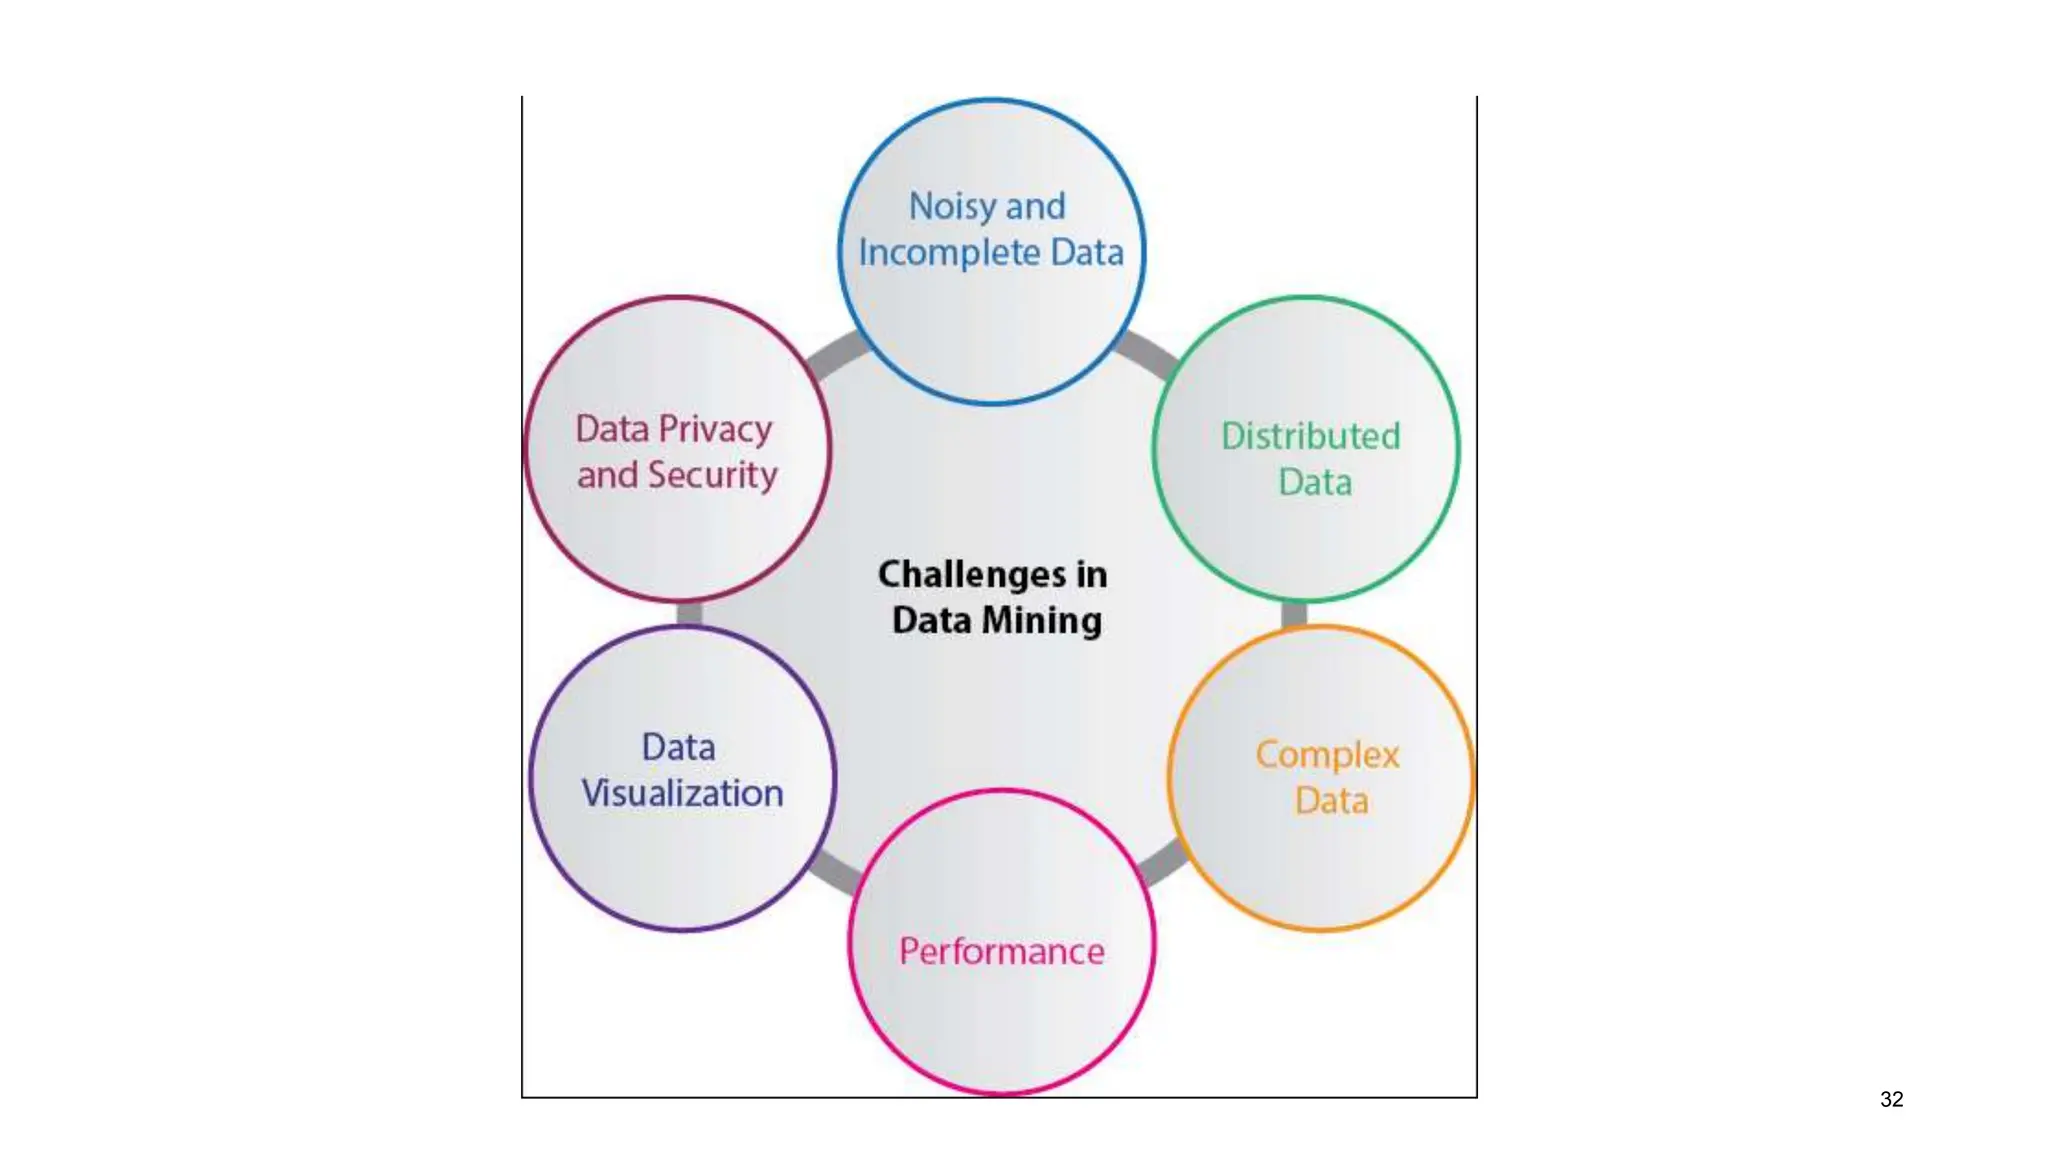
PREDICTIVE
ANALYTICS
SYLLABUS
Introduction to Predictive analytics - Logic and
Data Driven Models - Predictive Analysis
Modeling and procedure - Data Mining for
Predictive analytics - Analysis of Predictive
analytics
2
INTRODUCTION TO
PREDICTIVE
ANALYTICS
Predictive analytics is the use of data, statistical
algorithms and machine learning techniques to
identify the likelihood of future outcomes based
on historical data. The goal is to go beyond
knowing what has happened to providing a best
assessment of what will happen in the future.
3
Predictive modeling
means developing models
that can be used to
forecast or predict future
events. In business
analytics, models can be
developed based on logic
or data
LOGIC AND DATA
DRIVEN MODELS
LOGIC-DRIVEN
MODELS
7
A logic-driven model is one based on experience, knowledge,
and logical relationships of variables and constants connected
to the desired business performance outcome situation. The
question here is how to put variables and constants together to
create a model that can predict the future.
CAUSE-AND-EFFECT DIAGRAM
(FISHBONE DIAGRAM)
• The cause-and-effect diagram is a
visual aid diagram that permits a user
to hypothesize relationships between
potential causes of an outcome.
• This diagram lists potential causes in
terms of human, technology, policy,
and process resources in an effort to
establish some basic relationships
that impact business performance.
8
9
INFLUENCE DIAGRAM
• Another useful diagram to
conceptualize potential relationships
with business performance variables
is called the influence diagram.
• Influence diagrams can be useful to
conceptualize the relationships of
variables in the development of
models.
• It maps the relationship of variables
and a constant to the desired
business performance outcome of
profit.
10
DATA-DRIVEN PREDICTIVE MODELS
11
RETAIL PRICING
MARKDOWNS MODEL
12
When retailers deliberately reduce the selling price of retail
merchandise, it is called price markdown or markdown pricing.
MODELLING
RELATIONSHIPS AND
TRENDS IN DATA
13
• Linear function: y=a+bx
• Logarithmic function: y=ln(x)
• Polynomial function: v=ax2+bx+c
• Power function: y=axb
• Exponential function: y=aex
CLUSTERING MODEL
14
• Partitions data set into clusters, and models it by one representative from each cluster
• Can be very effective if data is clustered but not if data is “smeared”
15
TIME SERIES MODEL
16
NEURAL NETWORKS
17
REGRESSION ANALYSIS
18
19
CLASSIFICATION MODEL
20
CLASSIFICATION EXAMPLE
Tid Home
Owner
Marital
Status
Taxable
Income Default
1 Yes Single 125K No
2 No Married 100K No
3 No Single 70K No
4 Yes Married 120K No
5 No Divorced 95K Yes
6 No Married 60K No
7 Yes Divorced 220K No
8 No Single 85K Yes
9 No Married 75K No
10 No Single 90K Yes
10
Home
Owner
Marital
Status
Taxable
Income Default
No Single 75K ?
Yes Married 50K ?
No Married 150K ?
Yes Divorced 90K ?
No Single 40K ?
No Married 80K ?
10
Test
Set
Training
Set
Model
Learn
Classifier
ADVANTAGES OF USING PREDICTIVE MODELS
22
 Higher fault tolerance and system reliability
 Better load balancing
 Faster error diagnosis, recovery and error aversion
 Deeper understanding of business objectives and relationships
 Ability to address and answer business strategy decisions
 Better and more reliable strategic planning
LIMITATIONS OF PREDICTIVE ANALYTICS MODELS
 The need for massive training datasets
 Properly categorising data
 Applying learning to different cases
DATA MINING FOR
PREDICTIVE
ANALYTICS
Data mining is a discovery-driven software application process
that provides insights into business data by finding hidden
patterns and relationships in big or small data and inferring rules
from them to predict future behavior. These observed patterns
and rules guide decision-making. This is not just numbers, but
text and social media information from the web.
23
• As of 2018, it is believed that the world's largest
single database is the World Data Center for
Climate , clocking in at 6PB. That's larger than any
telco, larger than Google, larger than any single
bank, and larger than the CIA.
• With any size data file, the normal procedure in
data mining would be to divide the file into two
parts. One is referred to as a training data set,
and the other as a validation data set. The training
data set develops the association rules, and the
validation data set tests and proves that the rules
work.
24
25
26
DATA MINING PROCESS
DATA MINING METHODOLOGIES
27
• Summarization: find a compact description of the dataset or a subset of the dataset
• Classification: learning a function that maps an item into one of a set of predefined classes
• Association: identify significant dependencies between data attributes
• Clustering: identify a set of groups of similar items
• Trend analysis (Time series data)
DATA MINING TECHNIQUES
28
 Cluster analysis
 Neural networks
 Online Analytical processing
 Data visualisation
 The method of concluding the information which is a logical outcome of the information stored in
the database is known as deduction.
 The method of deducting the information which is generalised from the database is known as
induction.
• Decision trees
• Rule induction
EXAMPLE OF A DECISION TREE
Tid Home
Owner
Marital
Status
Taxable
Income Default
1 Yes Single 125K No
2 No Married 100K No
3 No Single 70K No
4 Yes Married 120K No
5 No Divorced 95K Yes
6 No Married 60K No
7 Yes Divorced 220K No
8 No Single 85K Yes
9 No Married 75K No
10 No Single 90K Yes
10
HO
MarSt
TaxInc
YES
NO
NO
NO
Yes No
Married
Single, Divorced
< 80K > 80K
Splitting Attributes
Training Data Model: Decision Tree
PROS AND CONS
30
31
32
ANALYSIS OF PREDICTIVE
ANALYTICS ​
• Your ability to communicate effectively will leave a lasting impact on
your audience​
• Effectively communicating involves not only delivering a message but
also resonating with the experiences, values, and emotions of those
listening
33
THANK YOU
Brita Tamm​
502-555-0152​
brita@firstupconsultants.com​
www.firstupconsultants.com

Predictive analytics BA4206 Anna University Business Analytics

  • 1.
  • 2.
    SYLLABUS Introduction to Predictiveanalytics - Logic and Data Driven Models - Predictive Analysis Modeling and procedure - Data Mining for Predictive analytics - Analysis of Predictive analytics 2
  • 3.
    INTRODUCTION TO PREDICTIVE ANALYTICS Predictive analyticsis the use of data, statistical algorithms and machine learning techniques to identify the likelihood of future outcomes based on historical data. The goal is to go beyond knowing what has happened to providing a best assessment of what will happen in the future. 3
  • 4.
    Predictive modeling means developingmodels that can be used to forecast or predict future events. In business analytics, models can be developed based on logic or data
  • 6.
  • 7.
    LOGIC-DRIVEN MODELS 7 A logic-driven modelis one based on experience, knowledge, and logical relationships of variables and constants connected to the desired business performance outcome situation. The question here is how to put variables and constants together to create a model that can predict the future.
  • 8.
    CAUSE-AND-EFFECT DIAGRAM (FISHBONE DIAGRAM) •The cause-and-effect diagram is a visual aid diagram that permits a user to hypothesize relationships between potential causes of an outcome. • This diagram lists potential causes in terms of human, technology, policy, and process resources in an effort to establish some basic relationships that impact business performance. 8
  • 9.
  • 10.
    INFLUENCE DIAGRAM • Anotheruseful diagram to conceptualize potential relationships with business performance variables is called the influence diagram. • Influence diagrams can be useful to conceptualize the relationships of variables in the development of models. • It maps the relationship of variables and a constant to the desired business performance outcome of profit. 10
  • 11.
  • 12.
    RETAIL PRICING MARKDOWNS MODEL 12 Whenretailers deliberately reduce the selling price of retail merchandise, it is called price markdown or markdown pricing.
  • 13.
    MODELLING RELATIONSHIPS AND TRENDS INDATA 13 • Linear function: y=a+bx • Logarithmic function: y=ln(x) • Polynomial function: v=ax2+bx+c • Power function: y=axb • Exponential function: y=aex
  • 14.
    CLUSTERING MODEL 14 • Partitionsdata set into clusters, and models it by one representative from each cluster • Can be very effective if data is clustered but not if data is “smeared”
  • 15.
  • 16.
  • 17.
  • 18.
  • 19.
  • 20.
  • 21.
    CLASSIFICATION EXAMPLE Tid Home Owner Marital Status Taxable IncomeDefault 1 Yes Single 125K No 2 No Married 100K No 3 No Single 70K No 4 Yes Married 120K No 5 No Divorced 95K Yes 6 No Married 60K No 7 Yes Divorced 220K No 8 No Single 85K Yes 9 No Married 75K No 10 No Single 90K Yes 10 Home Owner Marital Status Taxable Income Default No Single 75K ? Yes Married 50K ? No Married 150K ? Yes Divorced 90K ? No Single 40K ? No Married 80K ? 10 Test Set Training Set Model Learn Classifier
  • 22.
    ADVANTAGES OF USINGPREDICTIVE MODELS 22  Higher fault tolerance and system reliability  Better load balancing  Faster error diagnosis, recovery and error aversion  Deeper understanding of business objectives and relationships  Ability to address and answer business strategy decisions  Better and more reliable strategic planning LIMITATIONS OF PREDICTIVE ANALYTICS MODELS  The need for massive training datasets  Properly categorising data  Applying learning to different cases
  • 23.
    DATA MINING FOR PREDICTIVE ANALYTICS Datamining is a discovery-driven software application process that provides insights into business data by finding hidden patterns and relationships in big or small data and inferring rules from them to predict future behavior. These observed patterns and rules guide decision-making. This is not just numbers, but text and social media information from the web. 23
  • 24.
    • As of2018, it is believed that the world's largest single database is the World Data Center for Climate , clocking in at 6PB. That's larger than any telco, larger than Google, larger than any single bank, and larger than the CIA. • With any size data file, the normal procedure in data mining would be to divide the file into two parts. One is referred to as a training data set, and the other as a validation data set. The training data set develops the association rules, and the validation data set tests and proves that the rules work. 24
  • 25.
  • 26.
  • 27.
    DATA MINING METHODOLOGIES 27 •Summarization: find a compact description of the dataset or a subset of the dataset • Classification: learning a function that maps an item into one of a set of predefined classes • Association: identify significant dependencies between data attributes • Clustering: identify a set of groups of similar items • Trend analysis (Time series data)
  • 28.
    DATA MINING TECHNIQUES 28 Cluster analysis  Neural networks  Online Analytical processing  Data visualisation  The method of concluding the information which is a logical outcome of the information stored in the database is known as deduction.  The method of deducting the information which is generalised from the database is known as induction. • Decision trees • Rule induction
  • 29.
    EXAMPLE OF ADECISION TREE Tid Home Owner Marital Status Taxable Income Default 1 Yes Single 125K No 2 No Married 100K No 3 No Single 70K No 4 Yes Married 120K No 5 No Divorced 95K Yes 6 No Married 60K No 7 Yes Divorced 220K No 8 No Single 85K Yes 9 No Married 75K No 10 No Single 90K Yes 10 HO MarSt TaxInc YES NO NO NO Yes No Married Single, Divorced < 80K > 80K Splitting Attributes Training Data Model: Decision Tree
  • 30.
  • 31.
  • 32.
  • 33.
    ANALYSIS OF PREDICTIVE ANALYTICS​ • Your ability to communicate effectively will leave a lasting impact on your audience​ • Effectively communicating involves not only delivering a message but also resonating with the experiences, values, and emotions of those listening 33
  • 34.