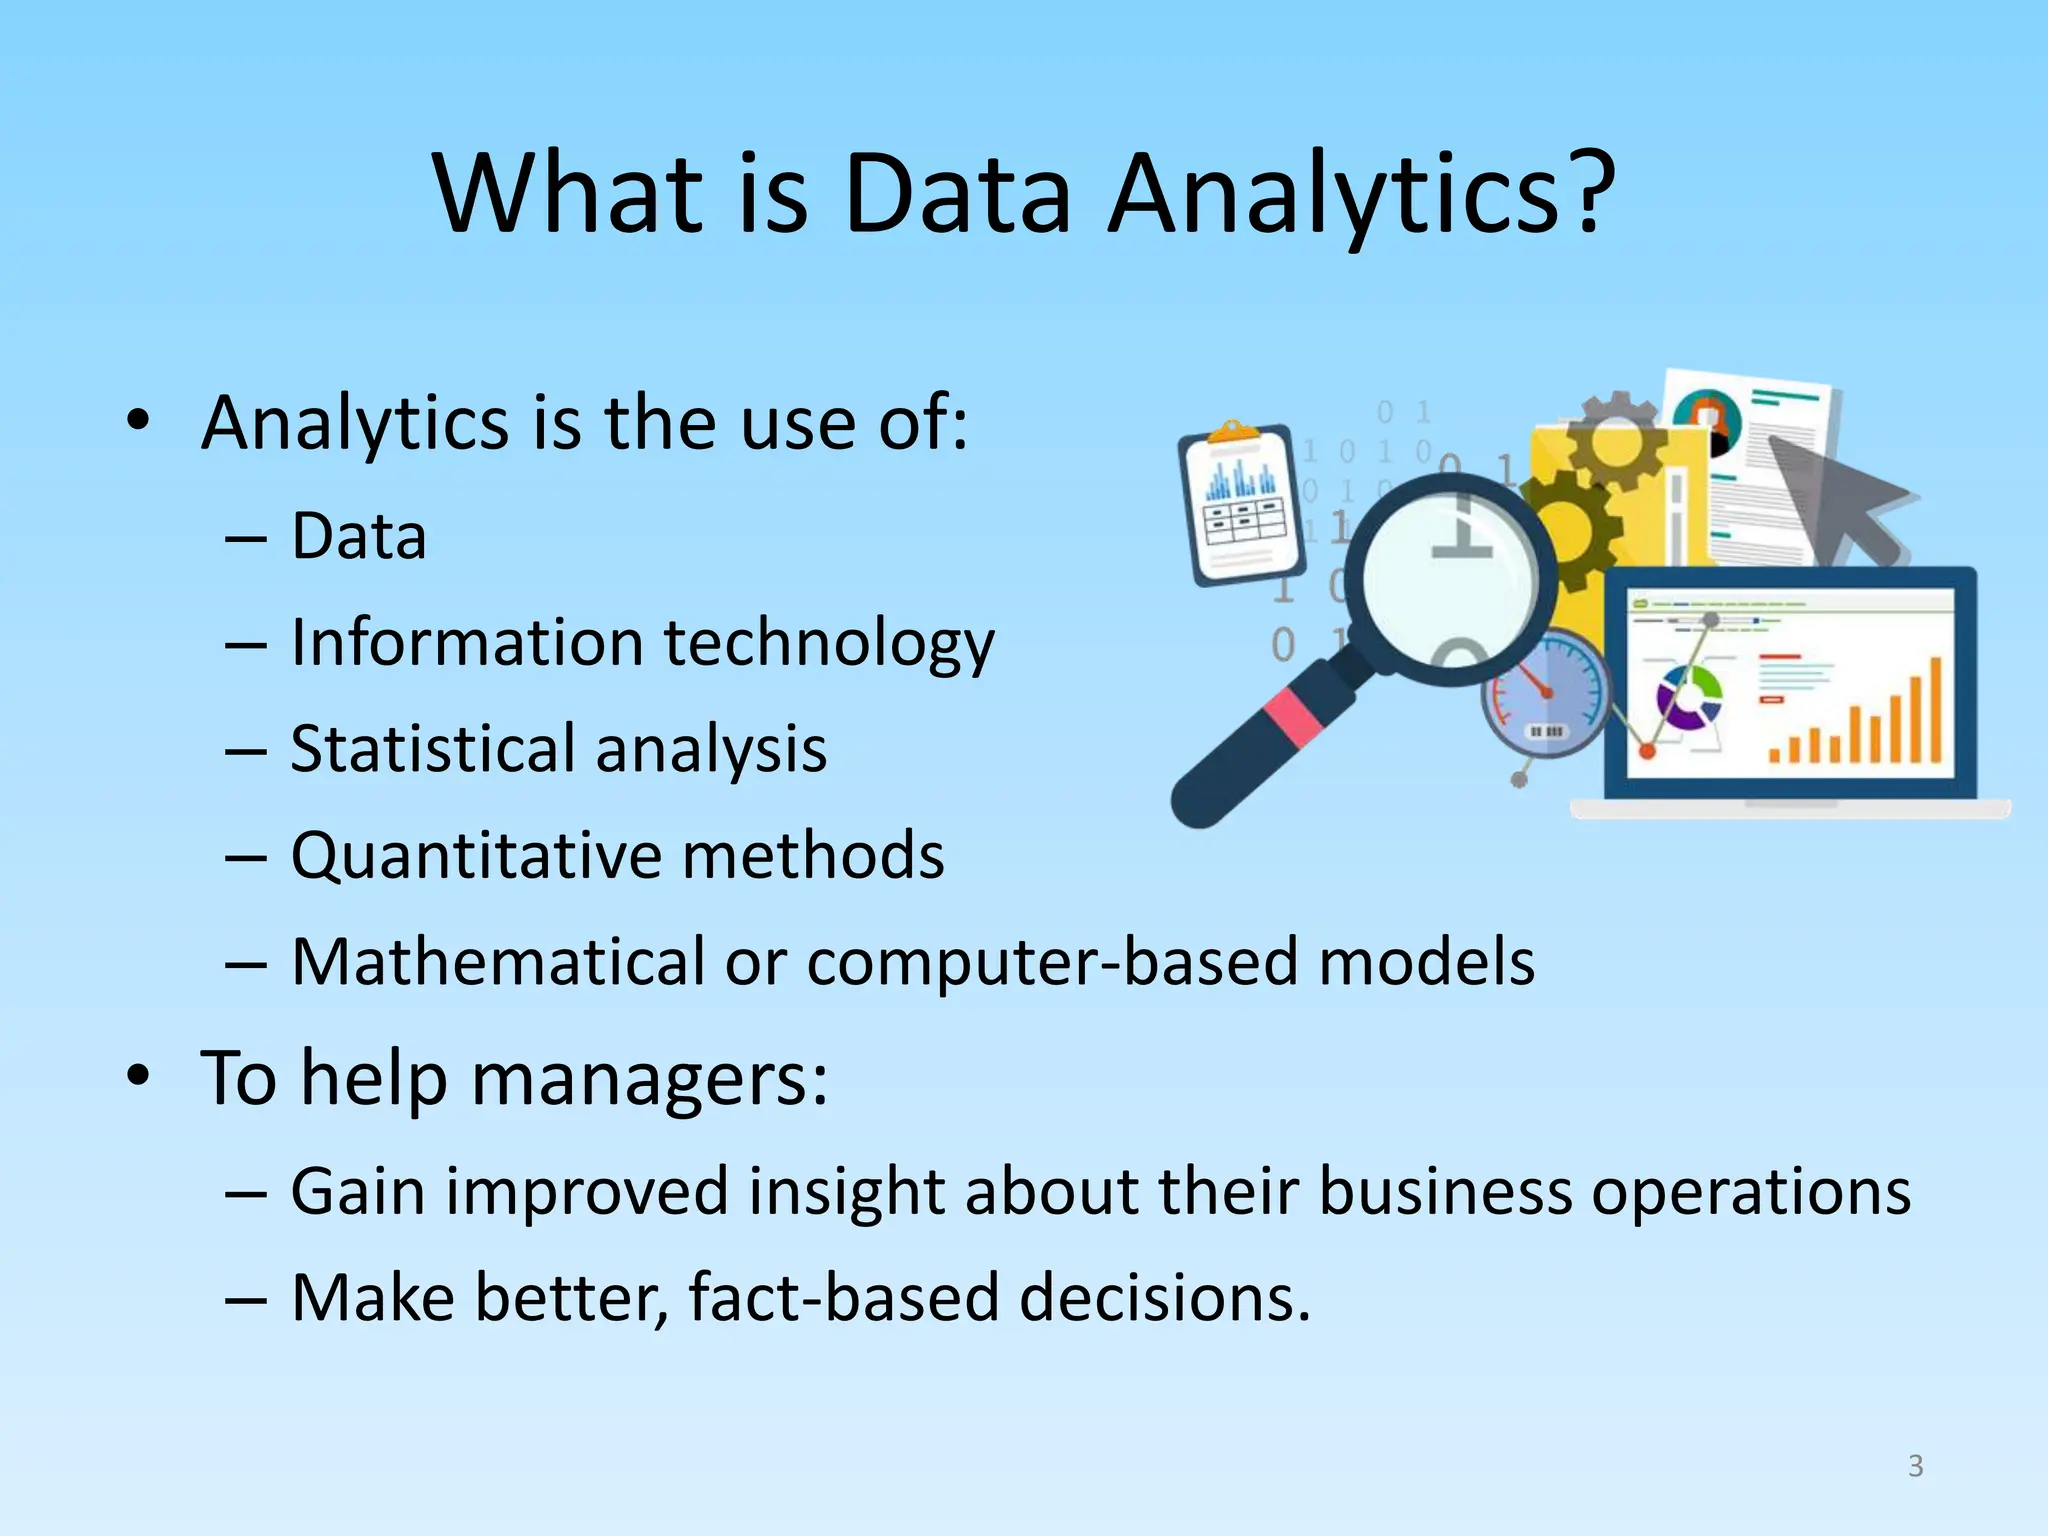
This document provides an overview of data analytics including:
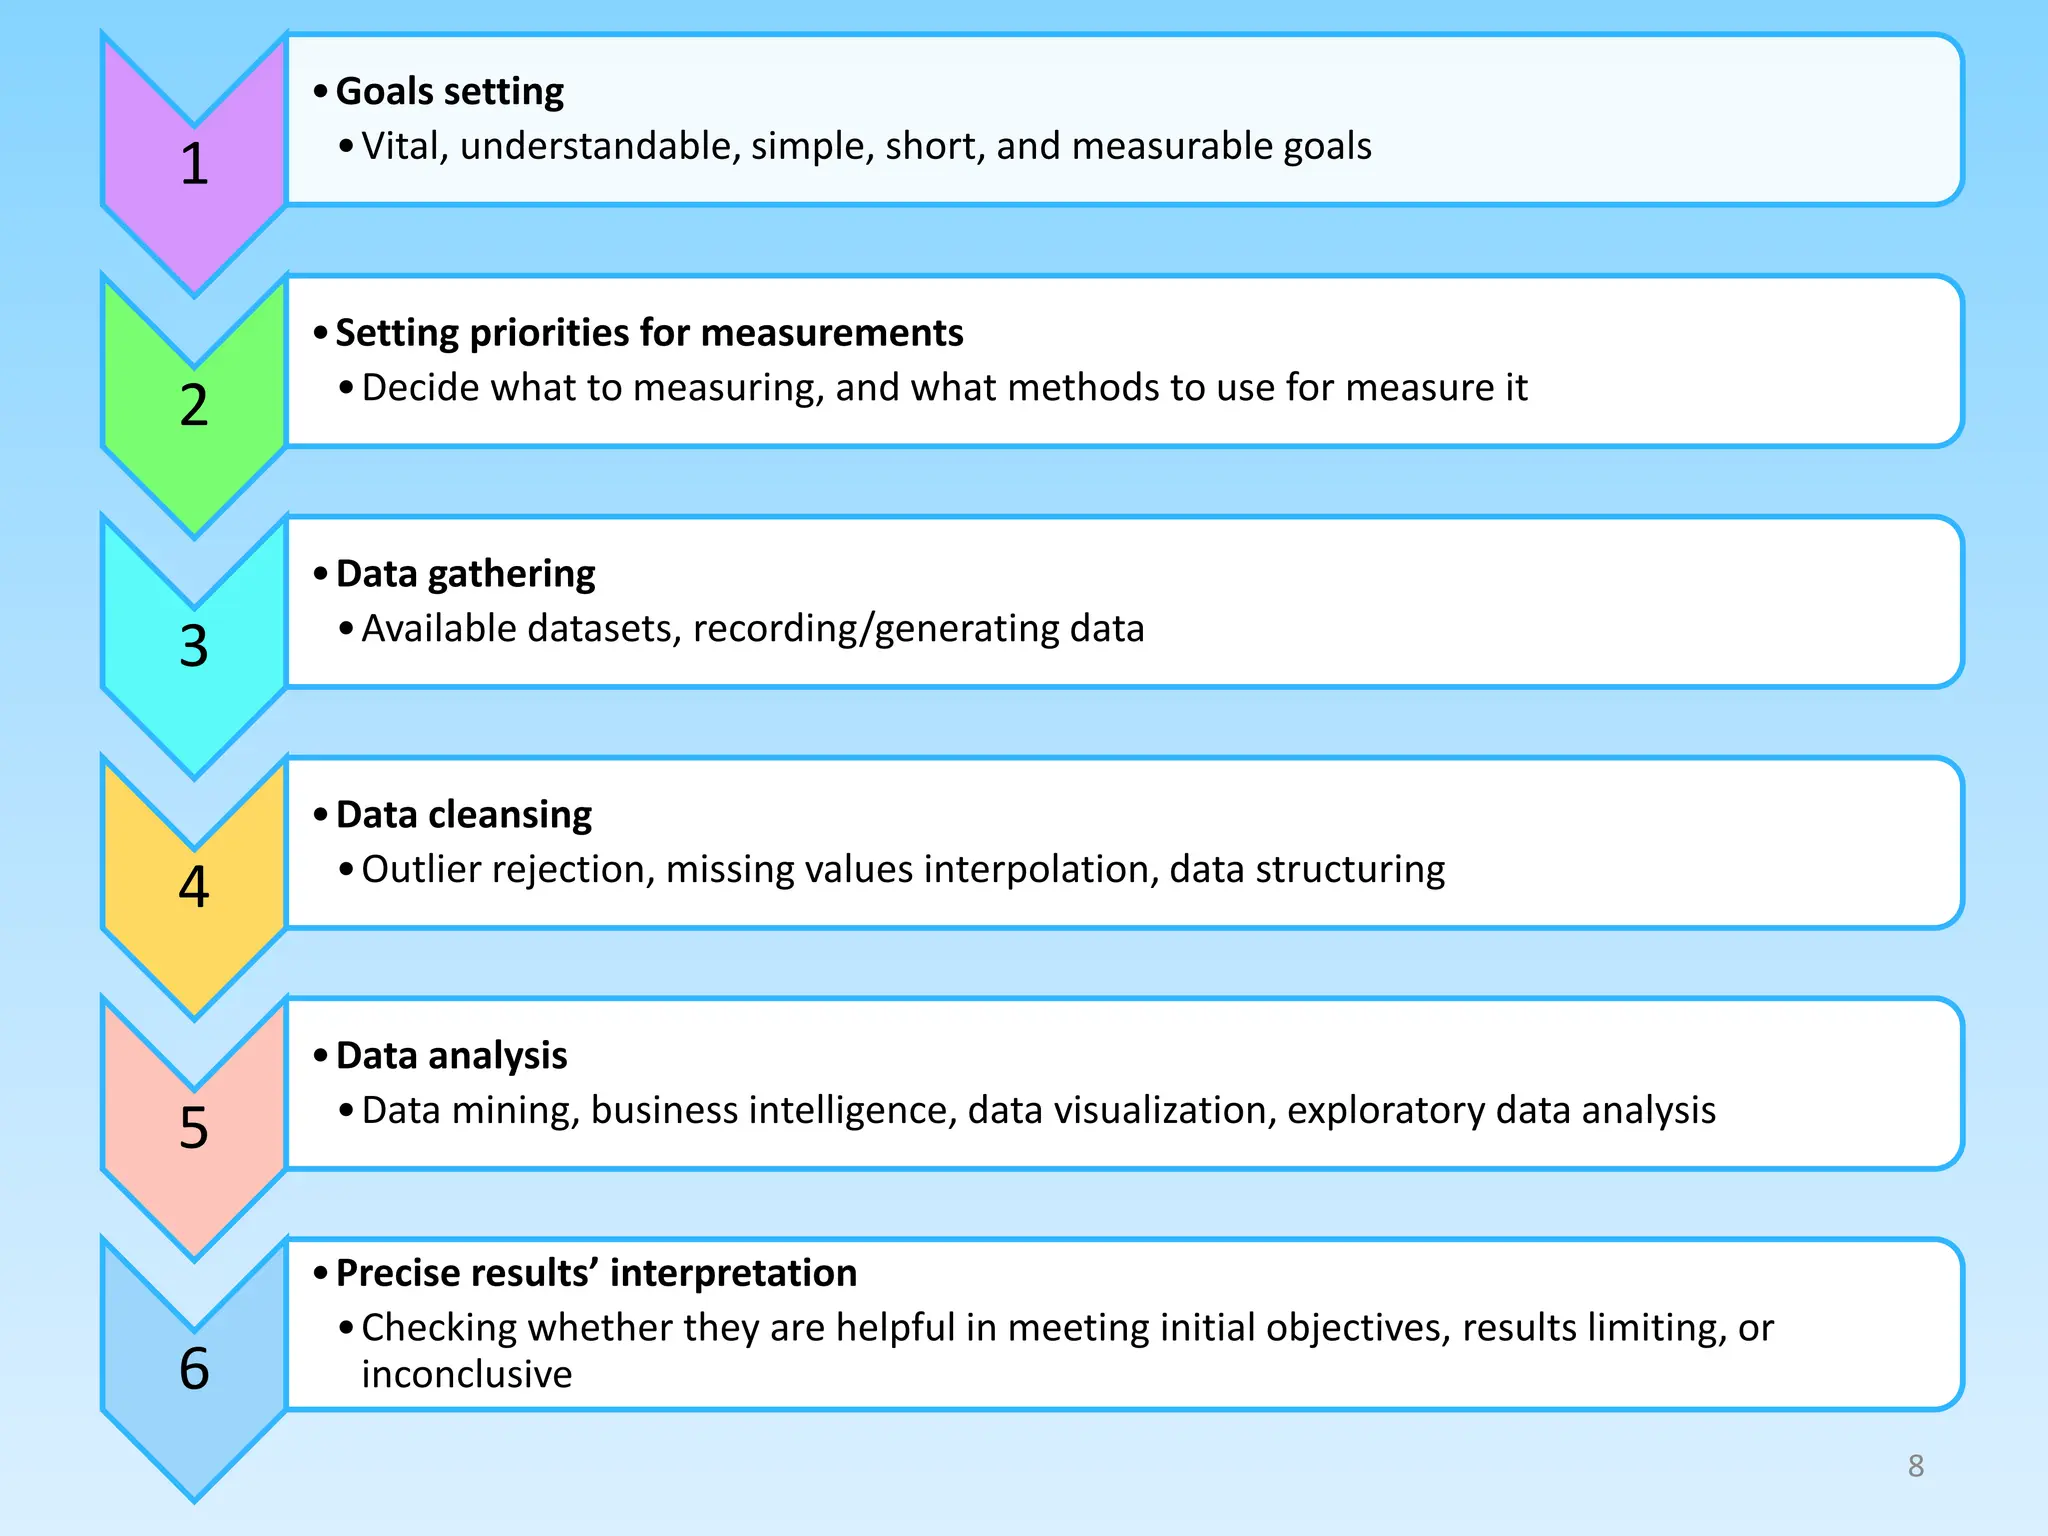
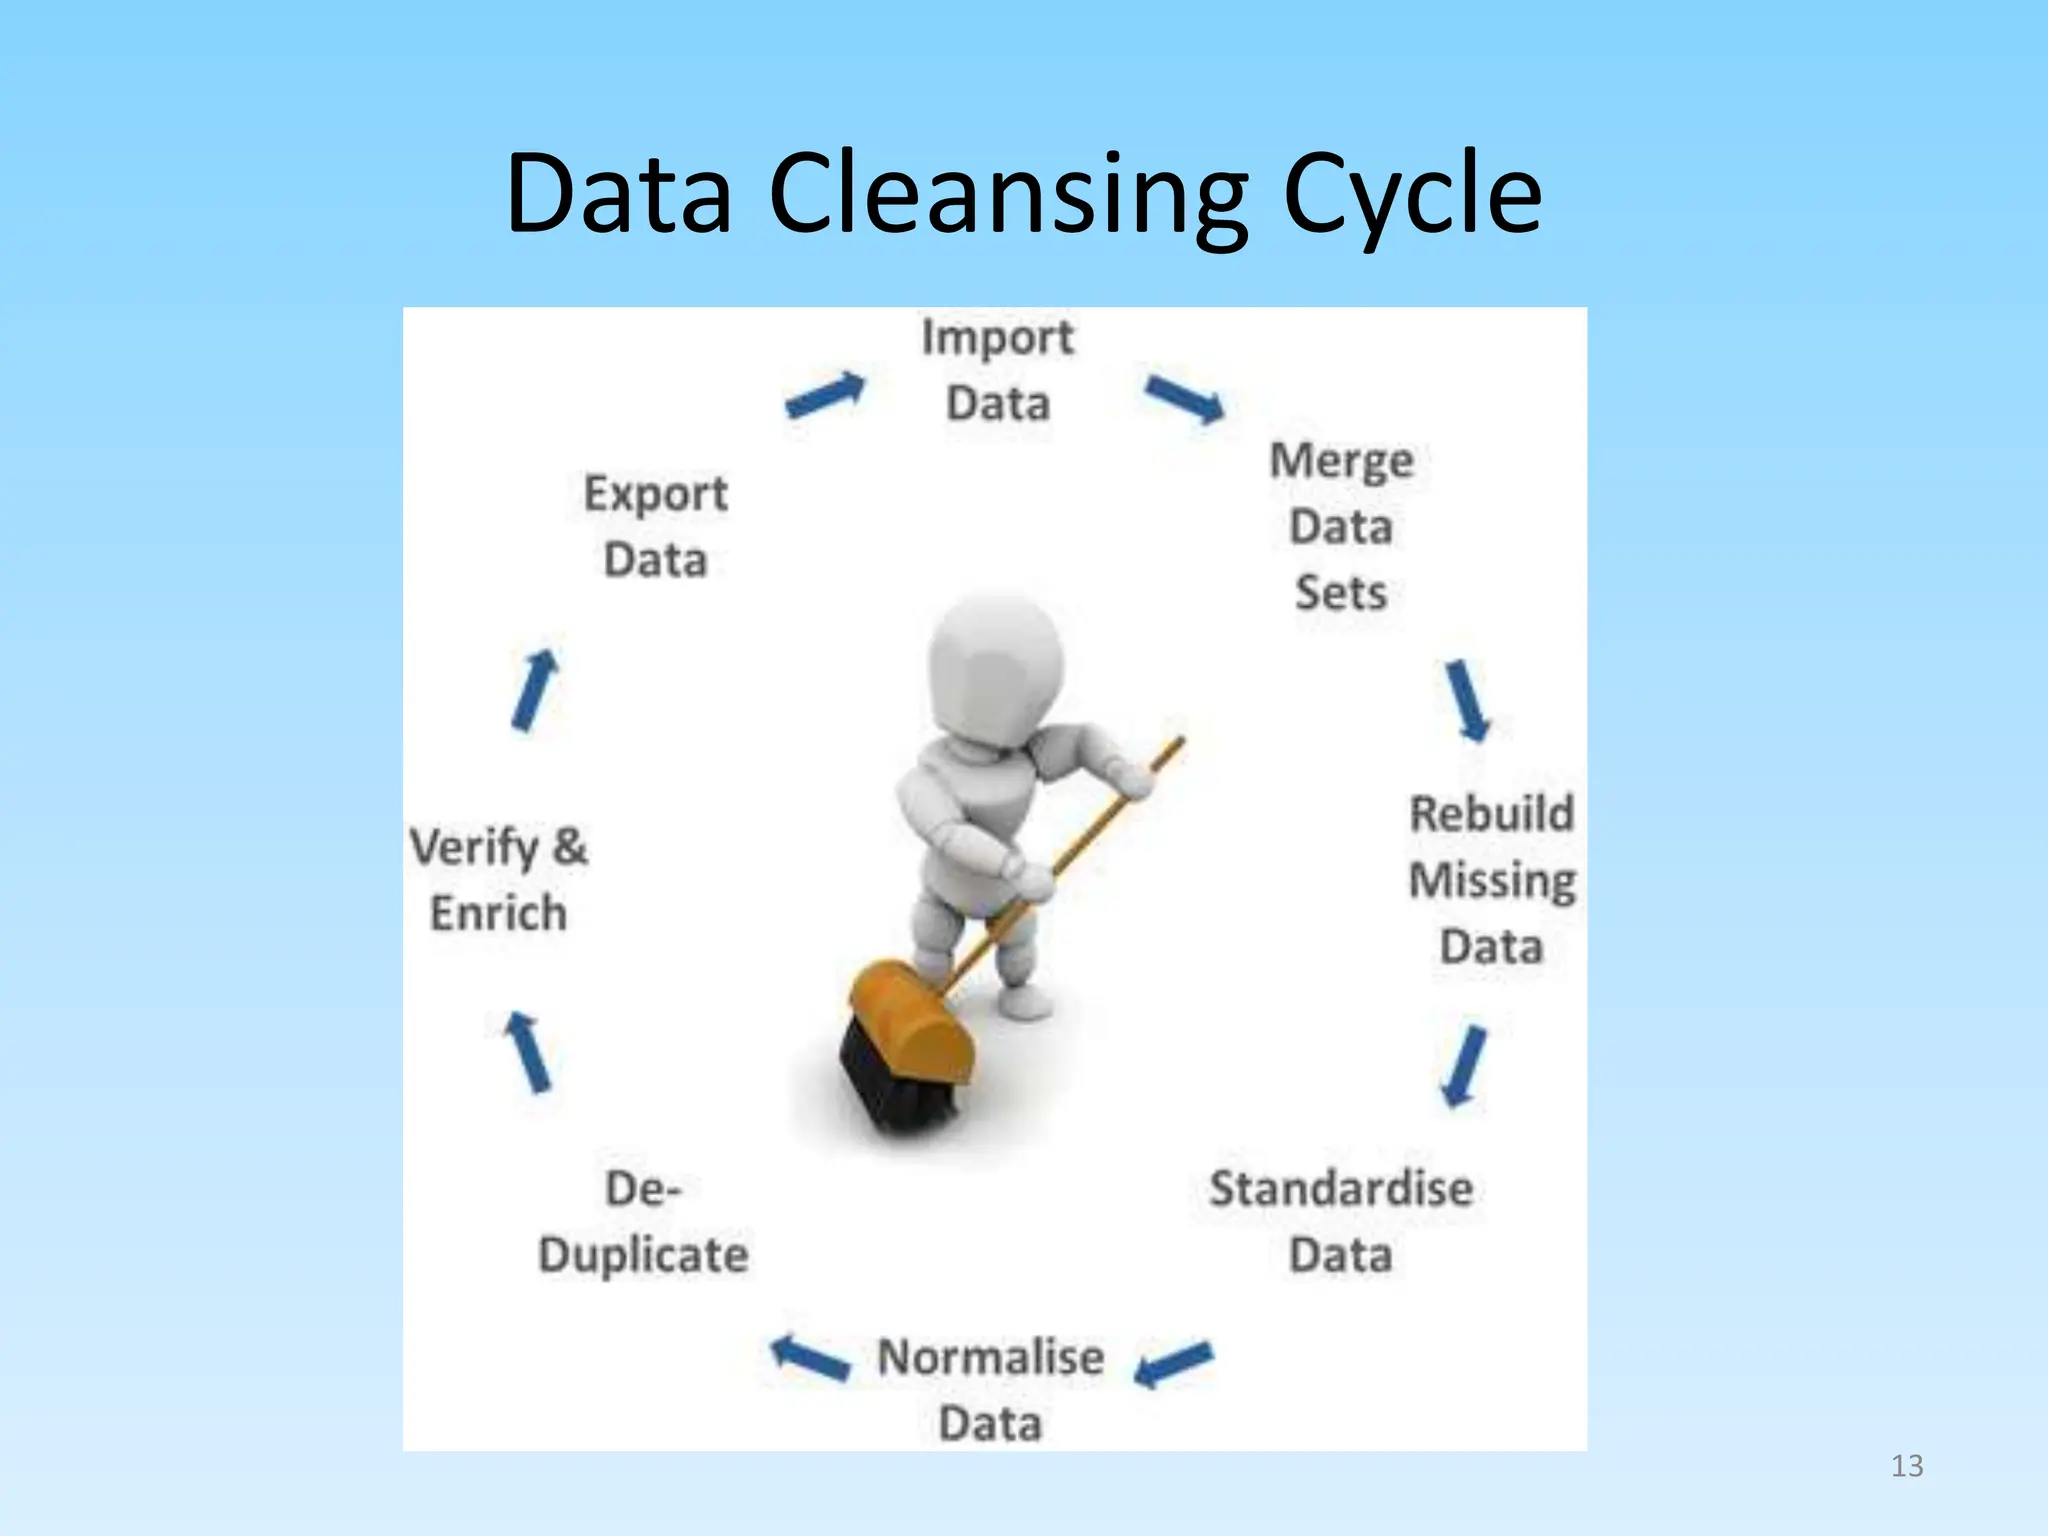
1. Defining data analytics and its key steps such as goal setting, data gathering and cleaning, analysis, and interpretation.
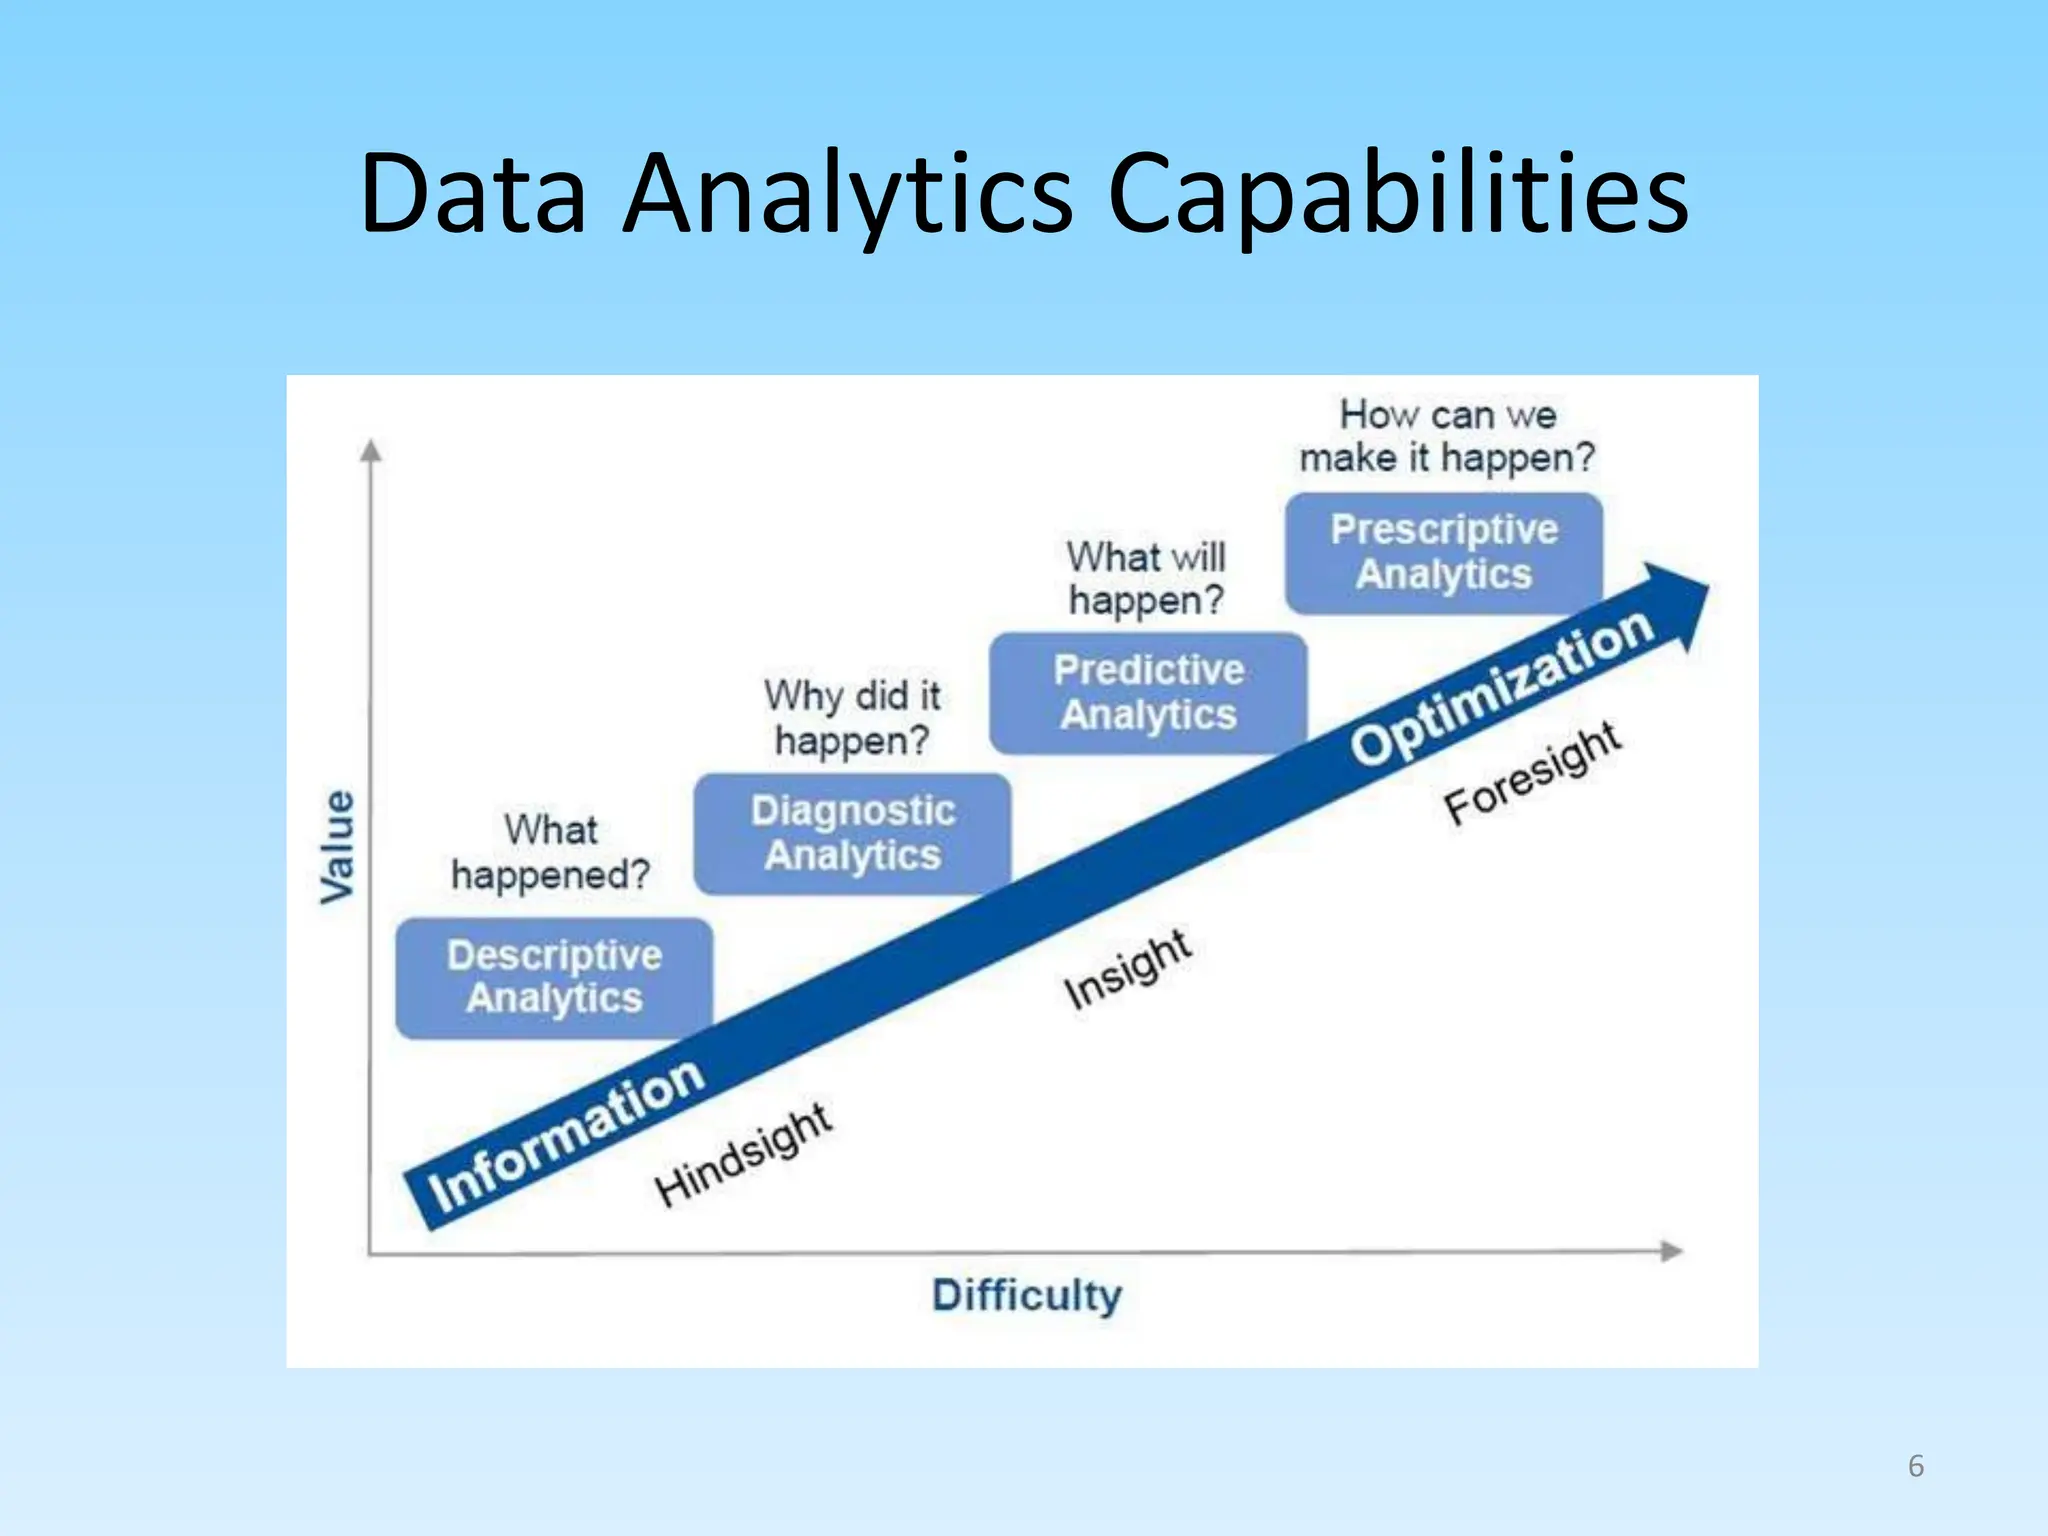
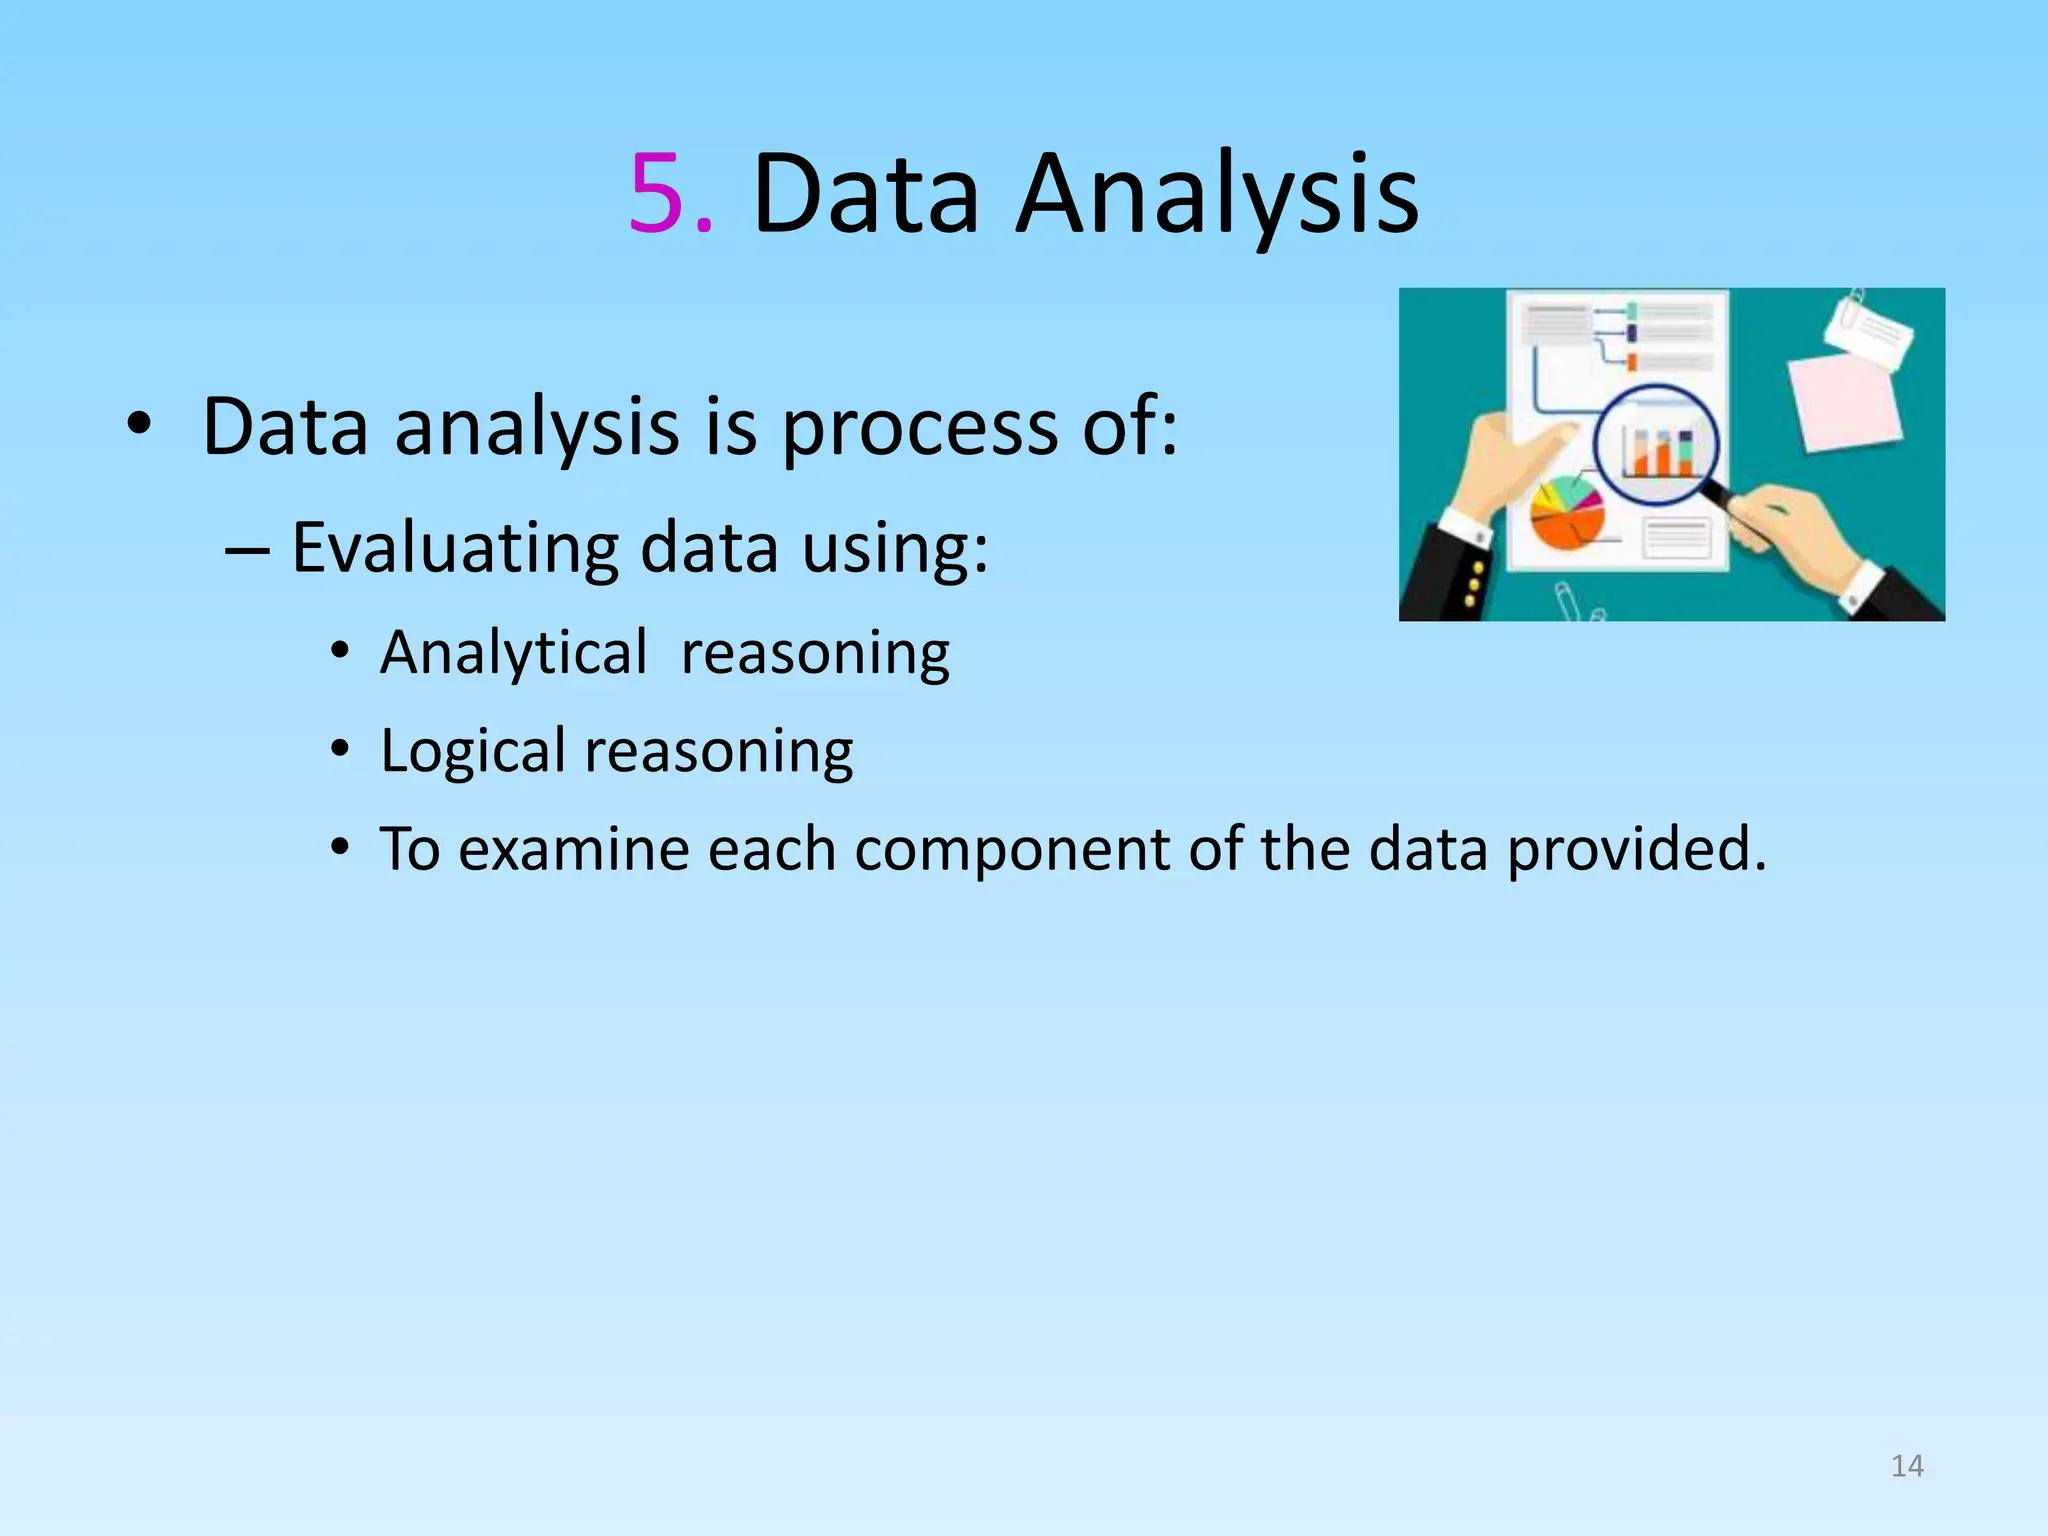
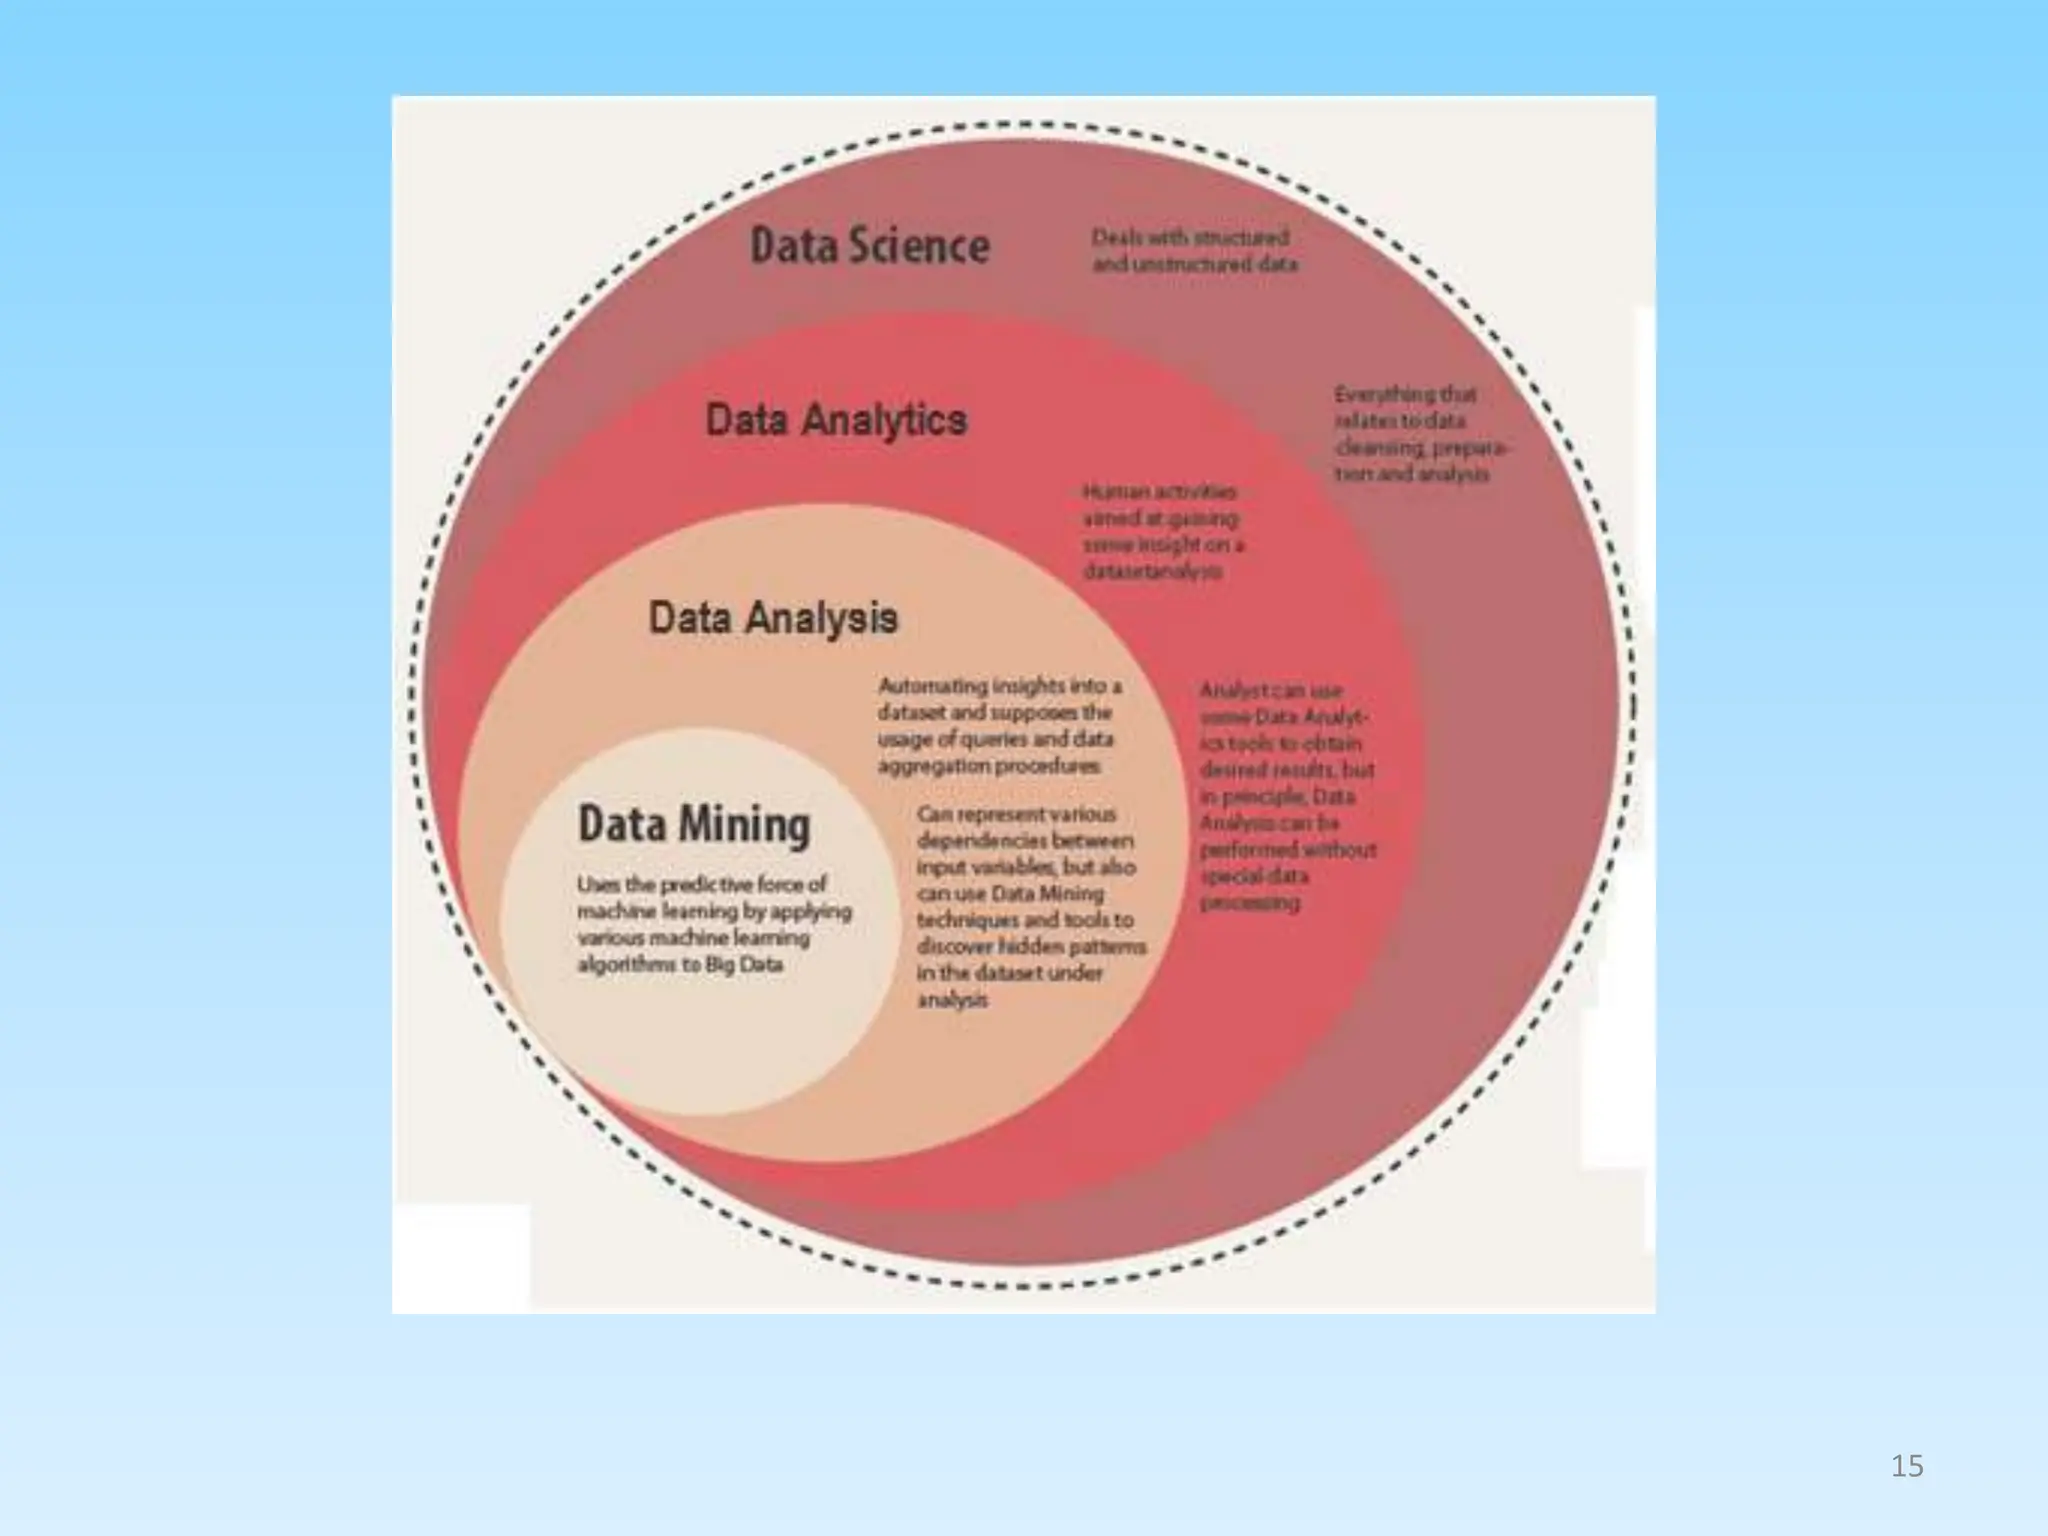
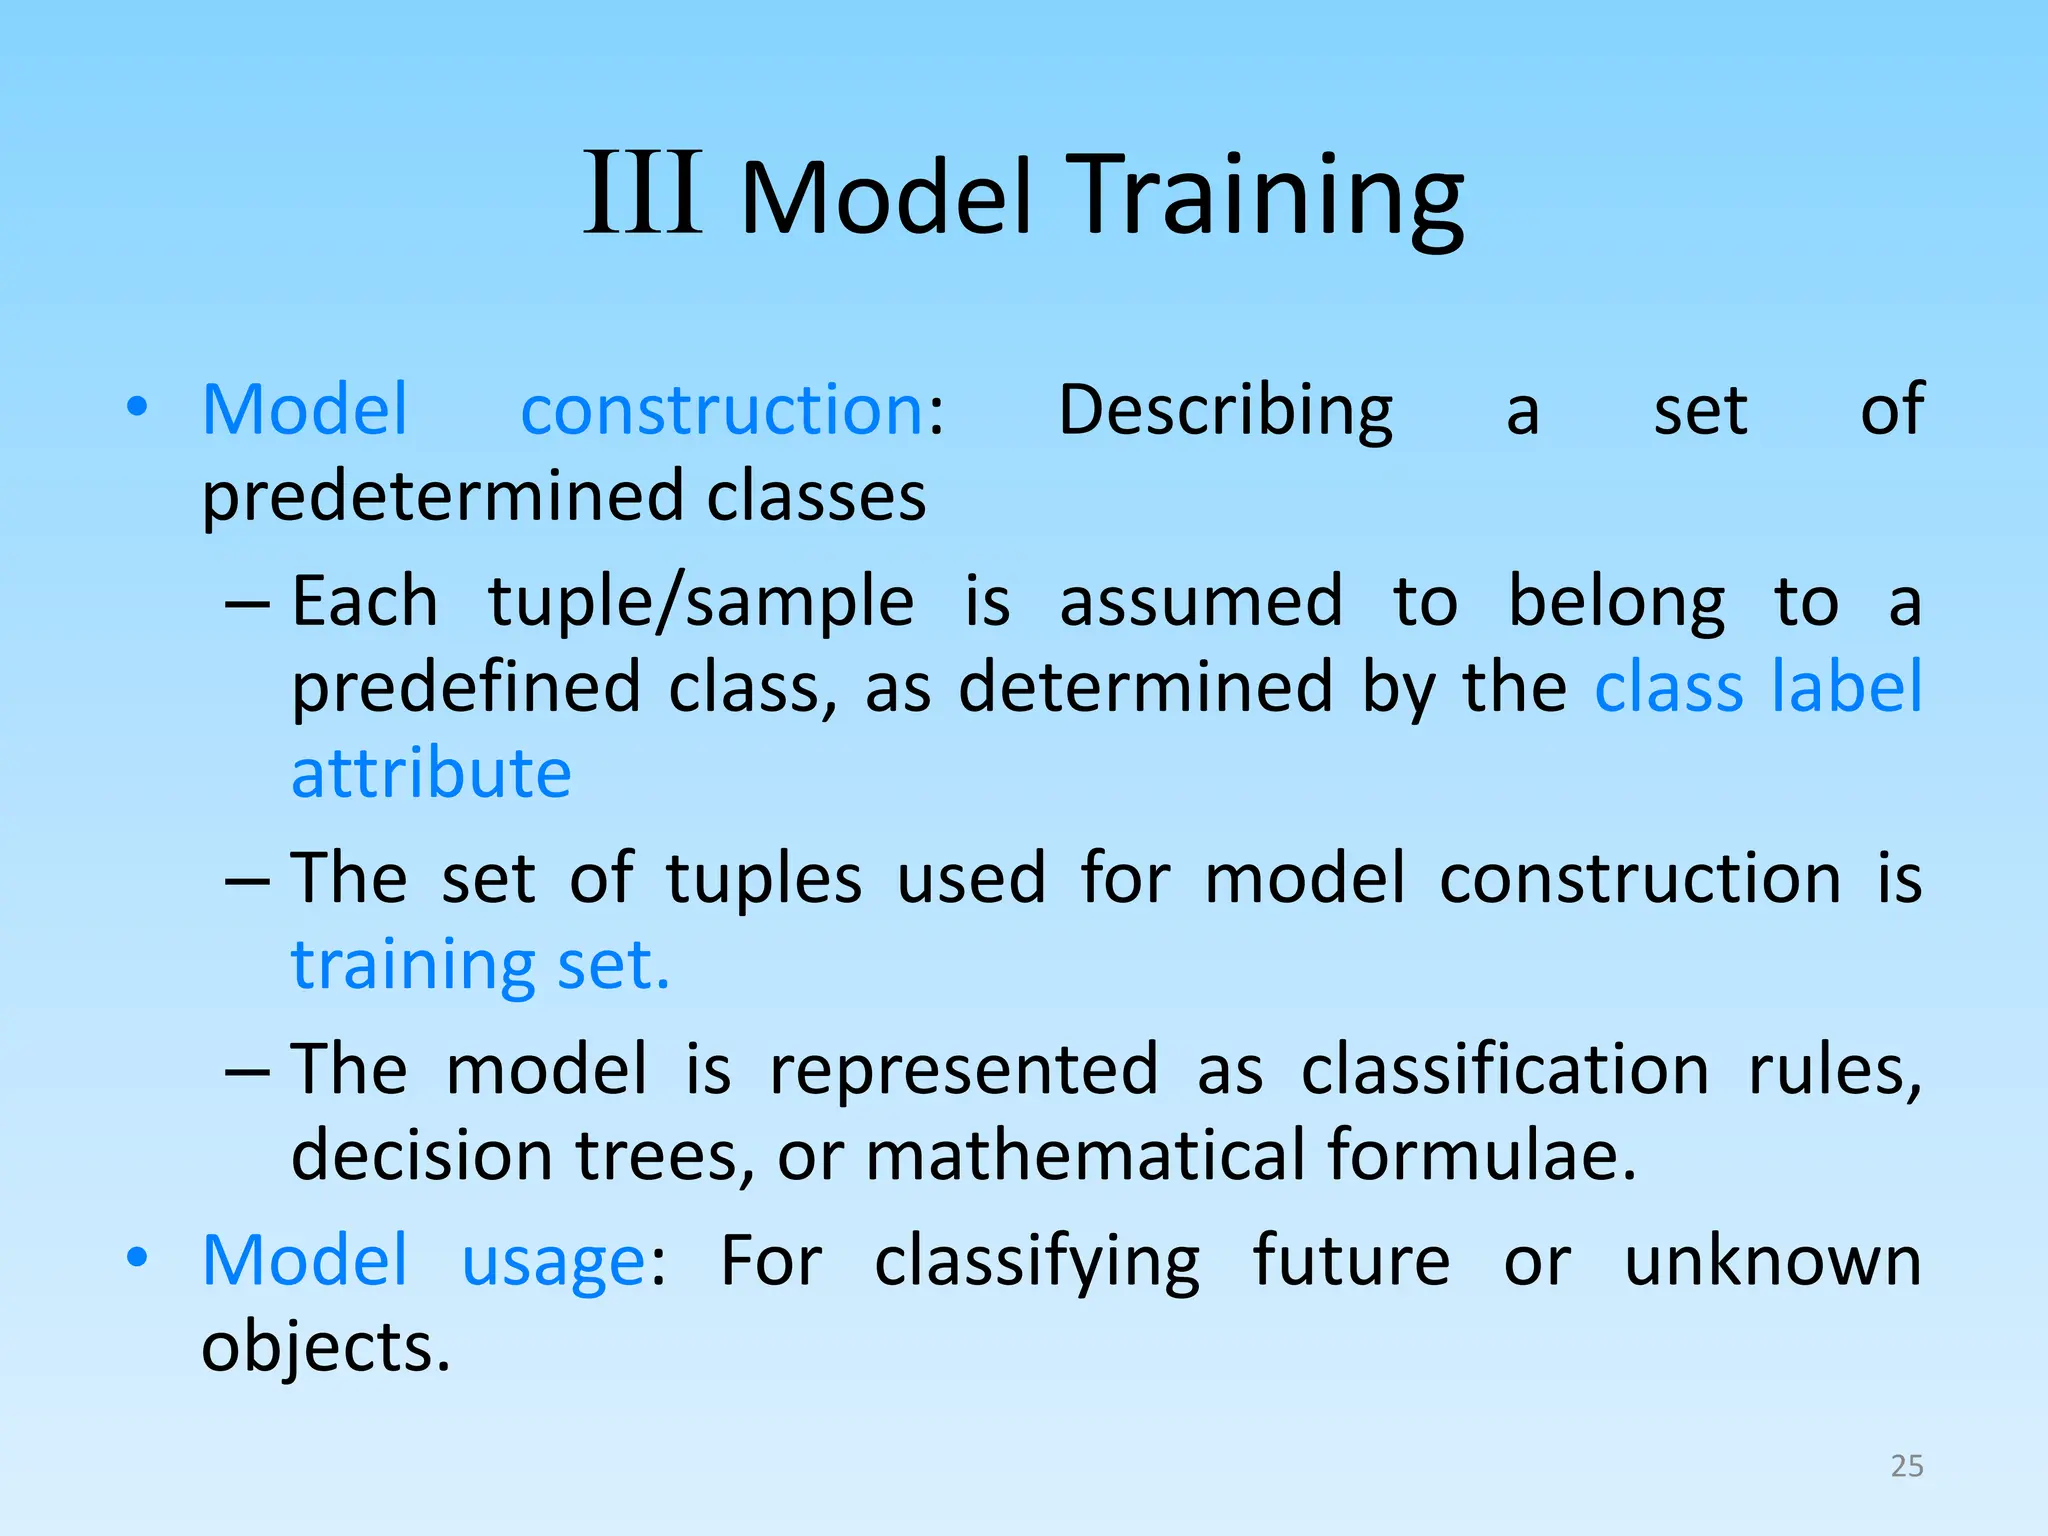
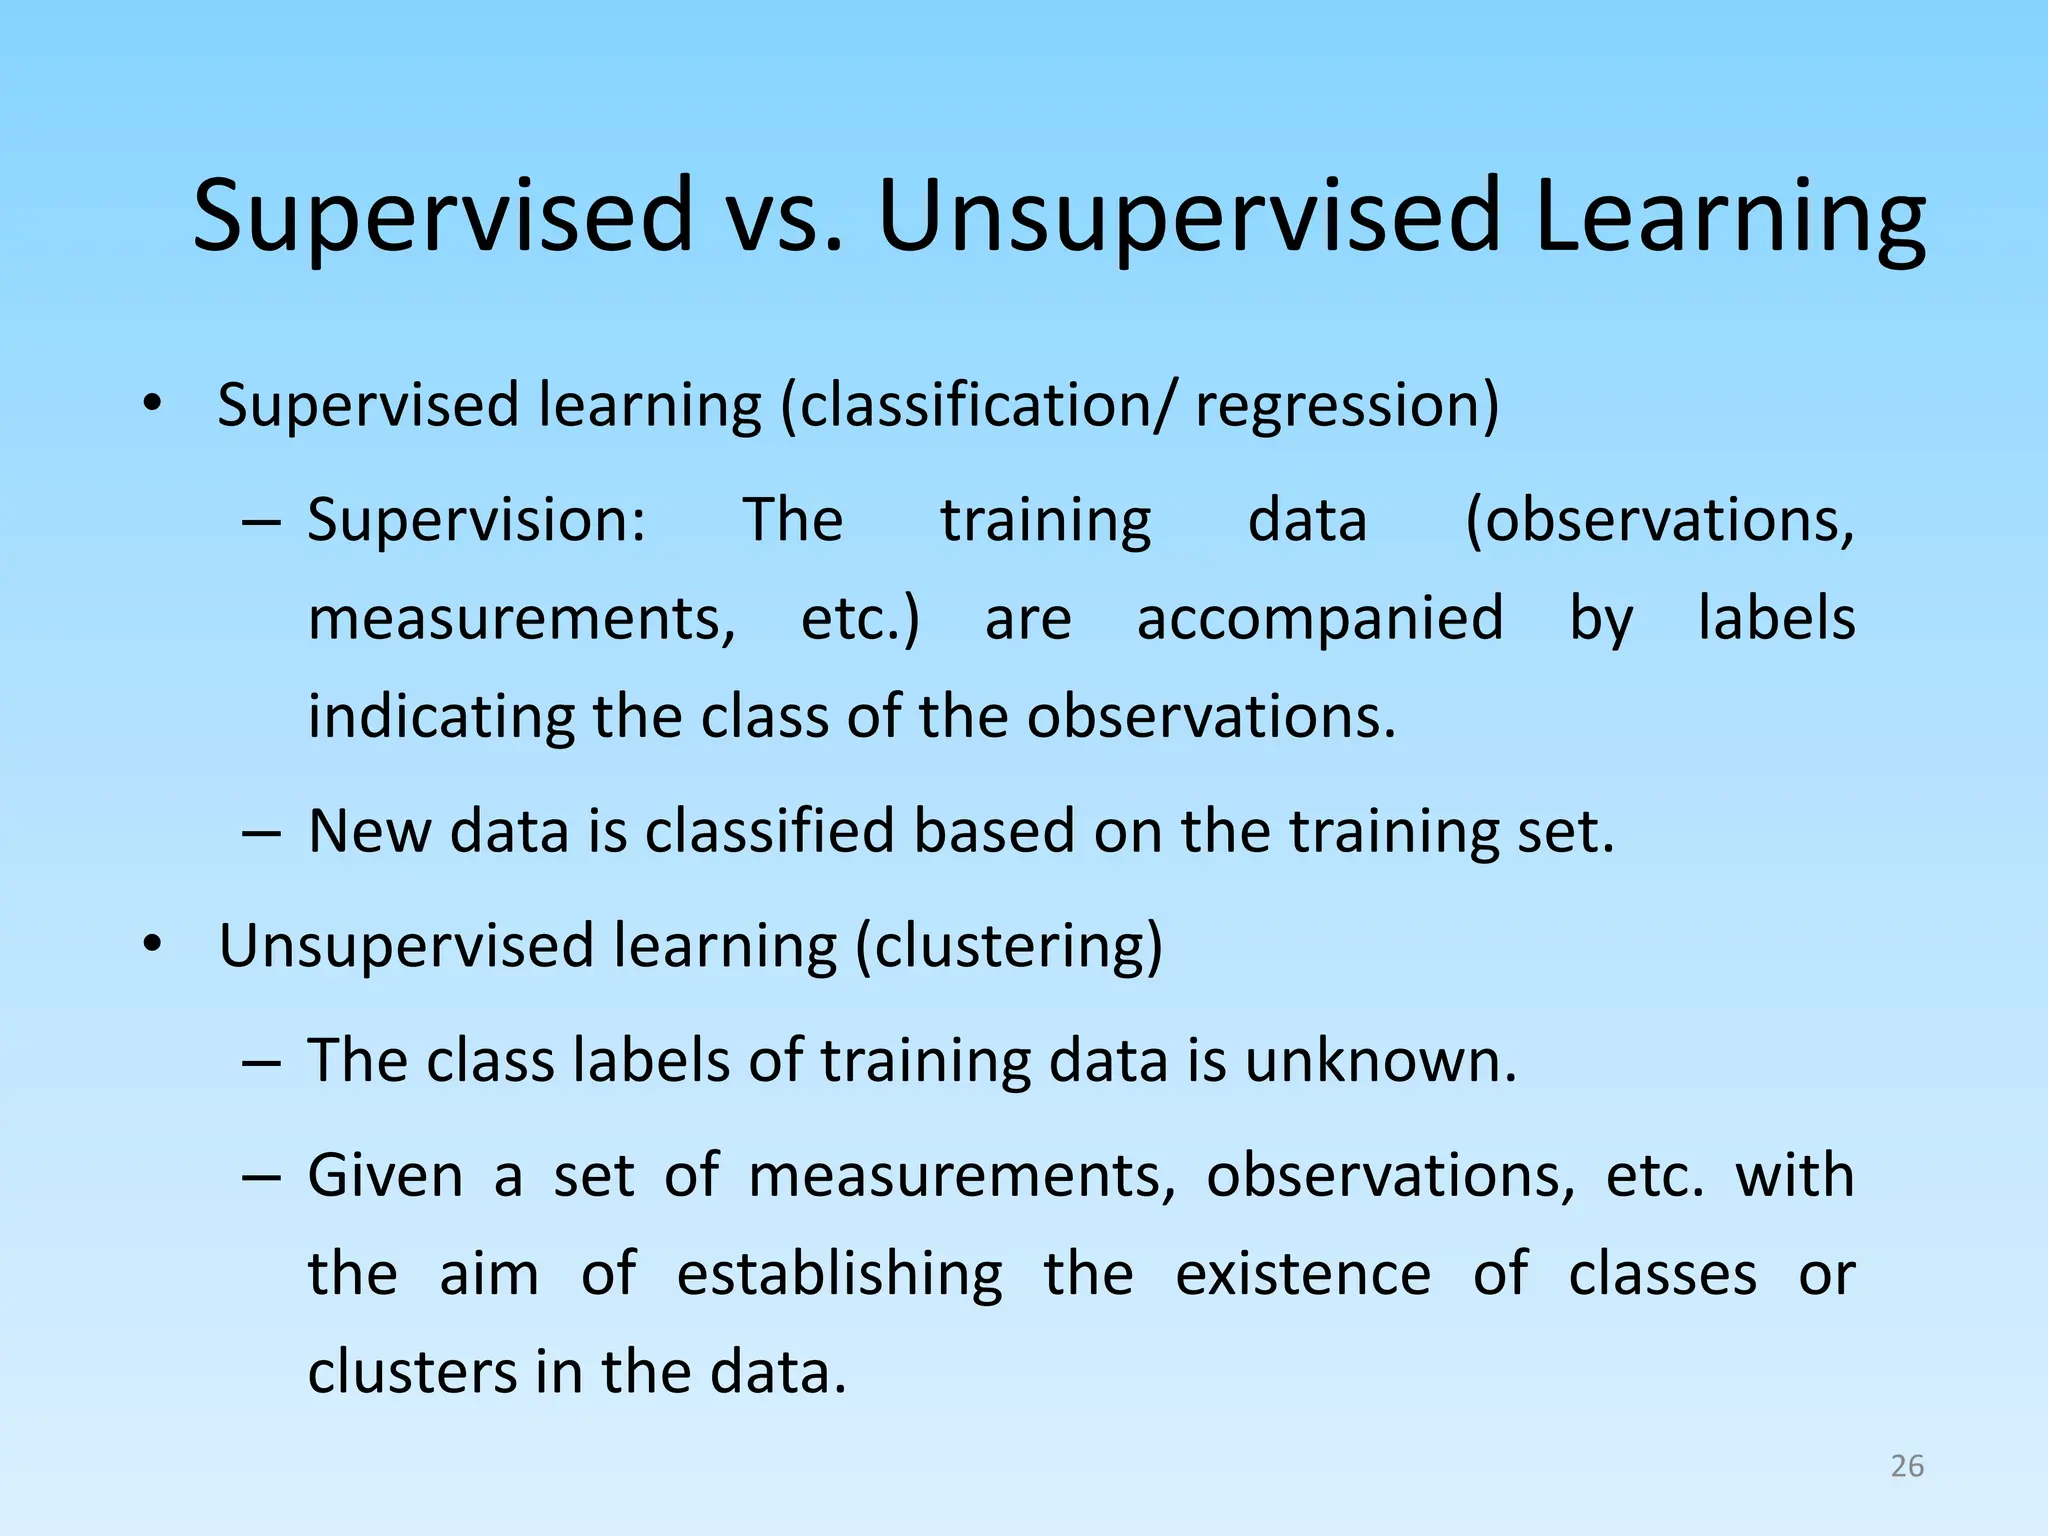
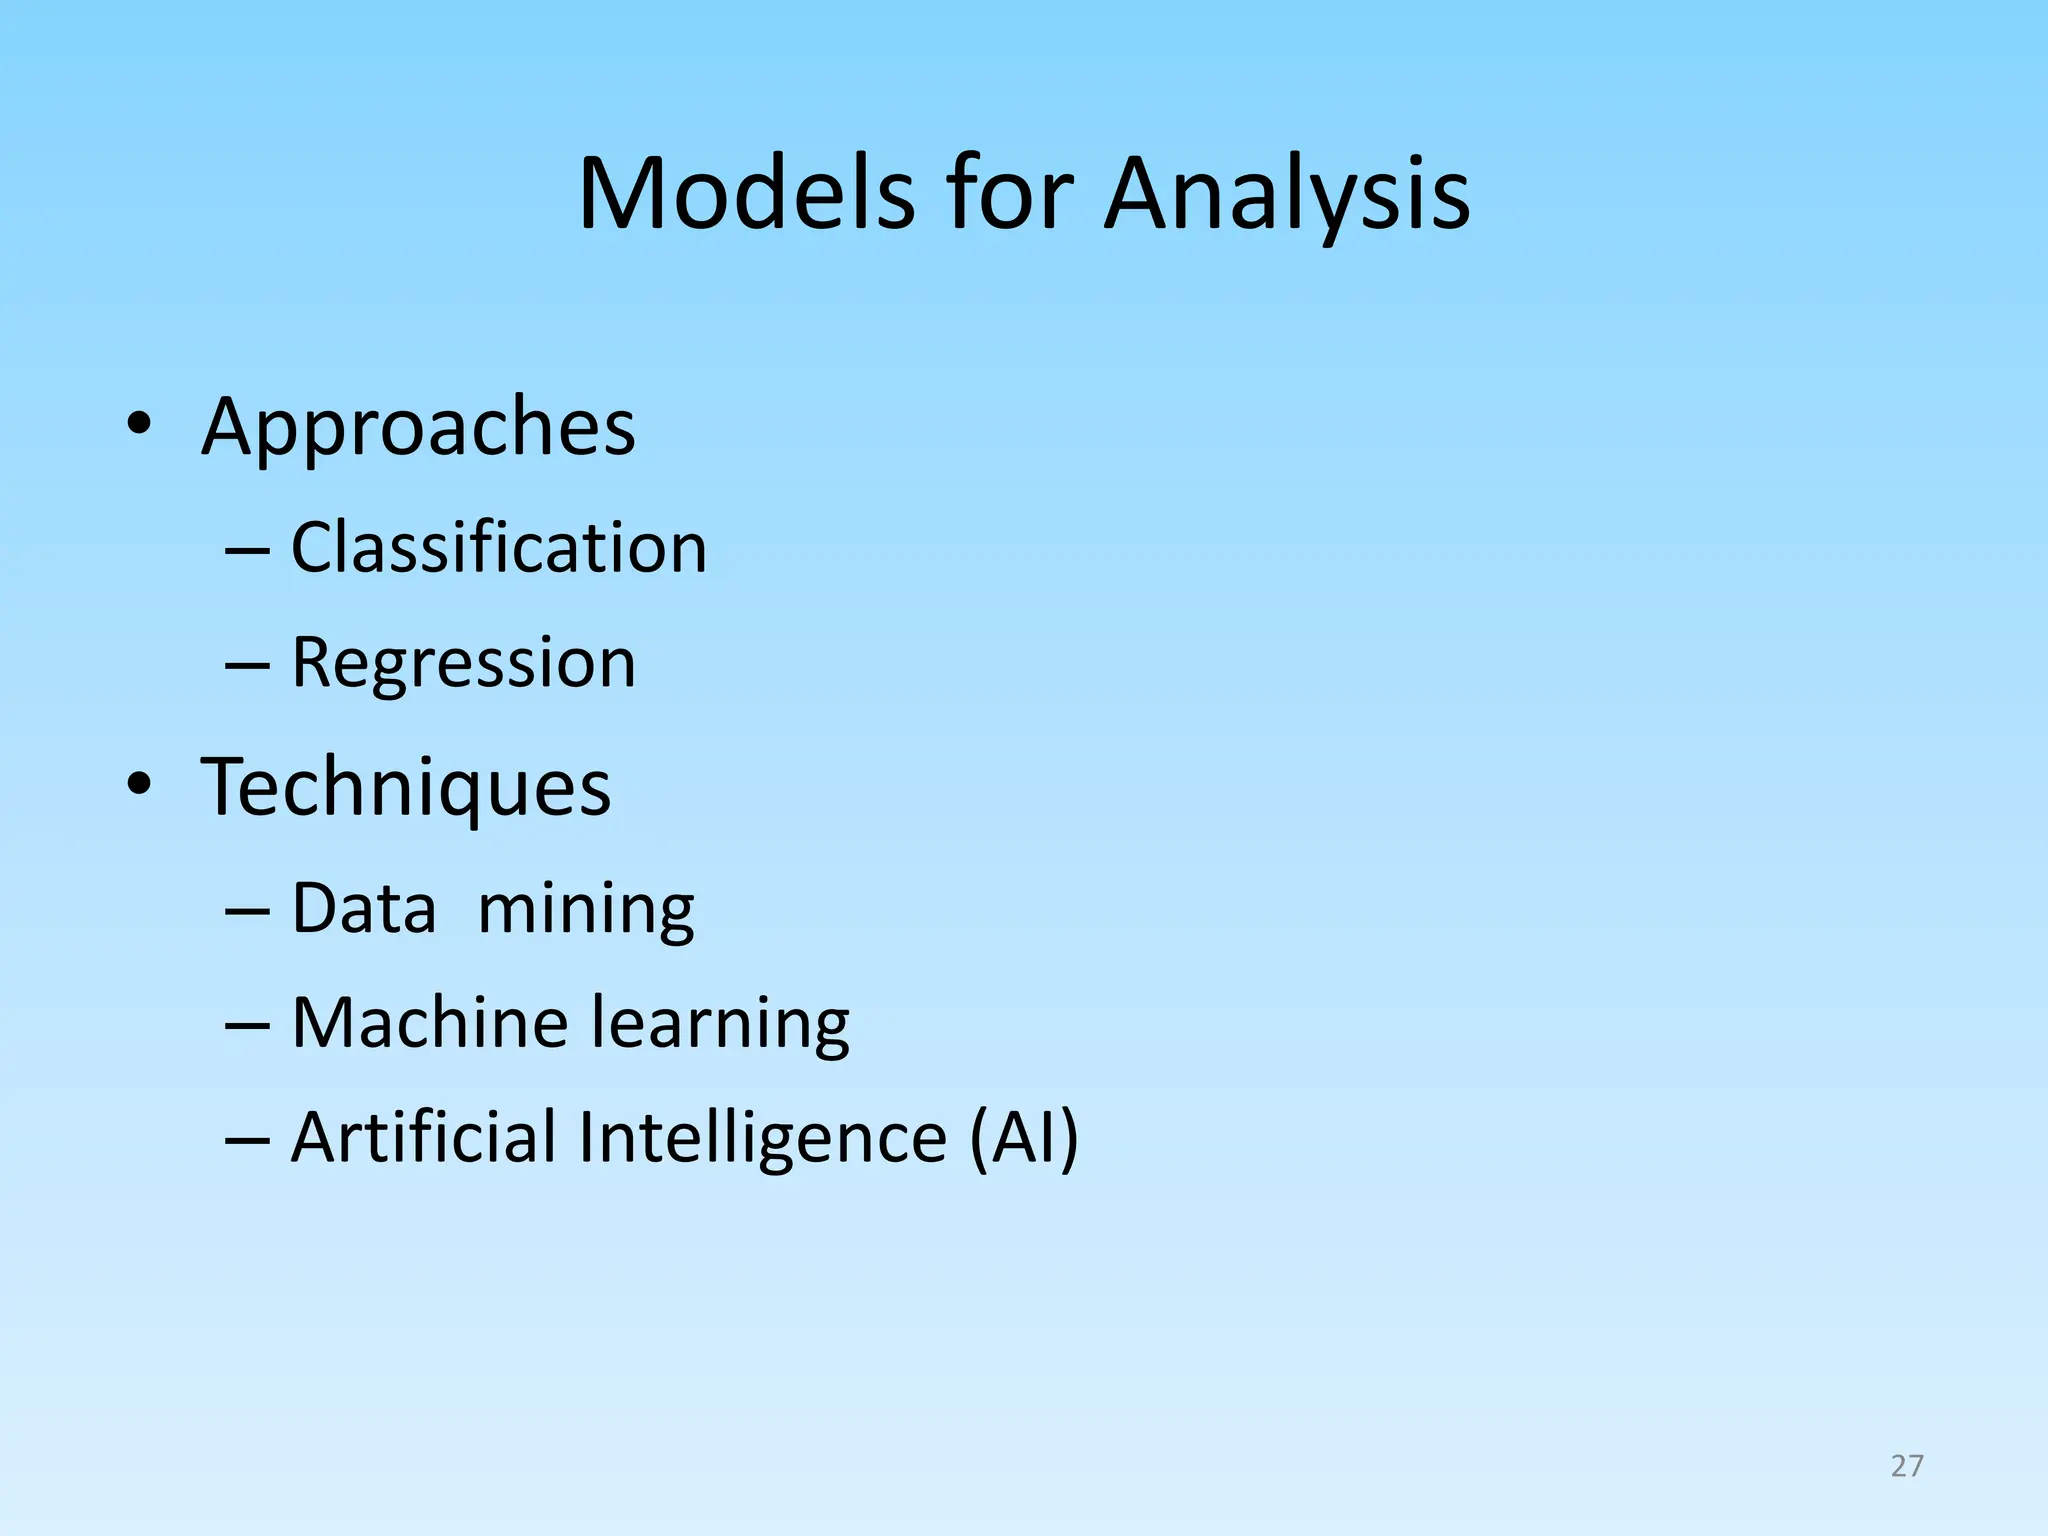
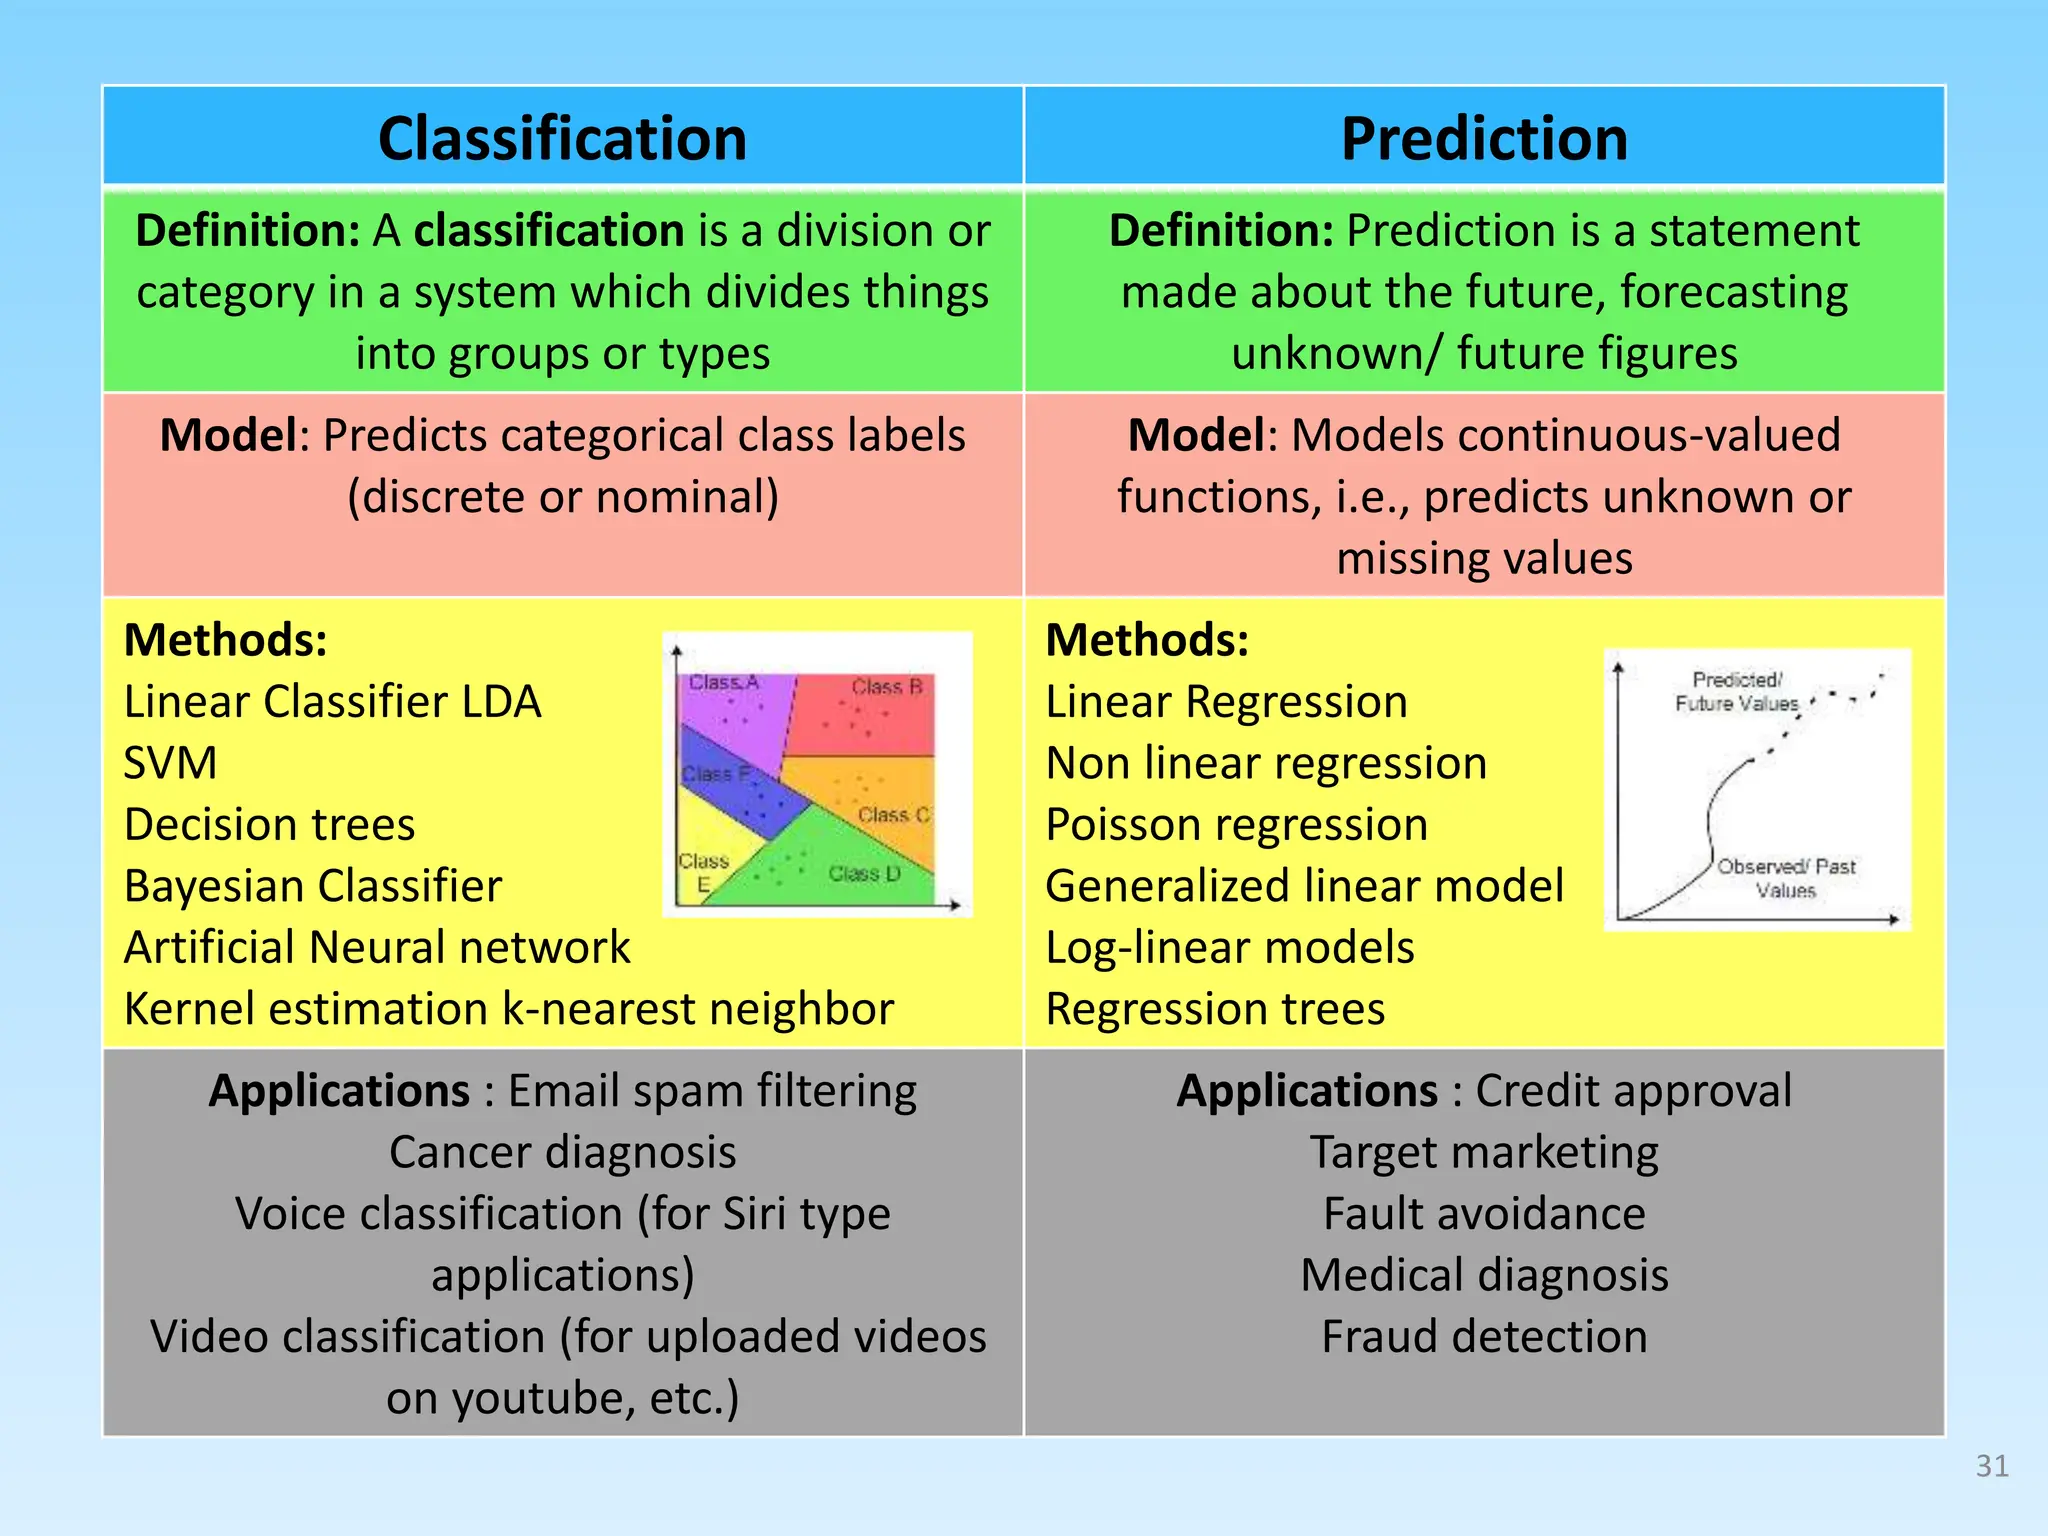
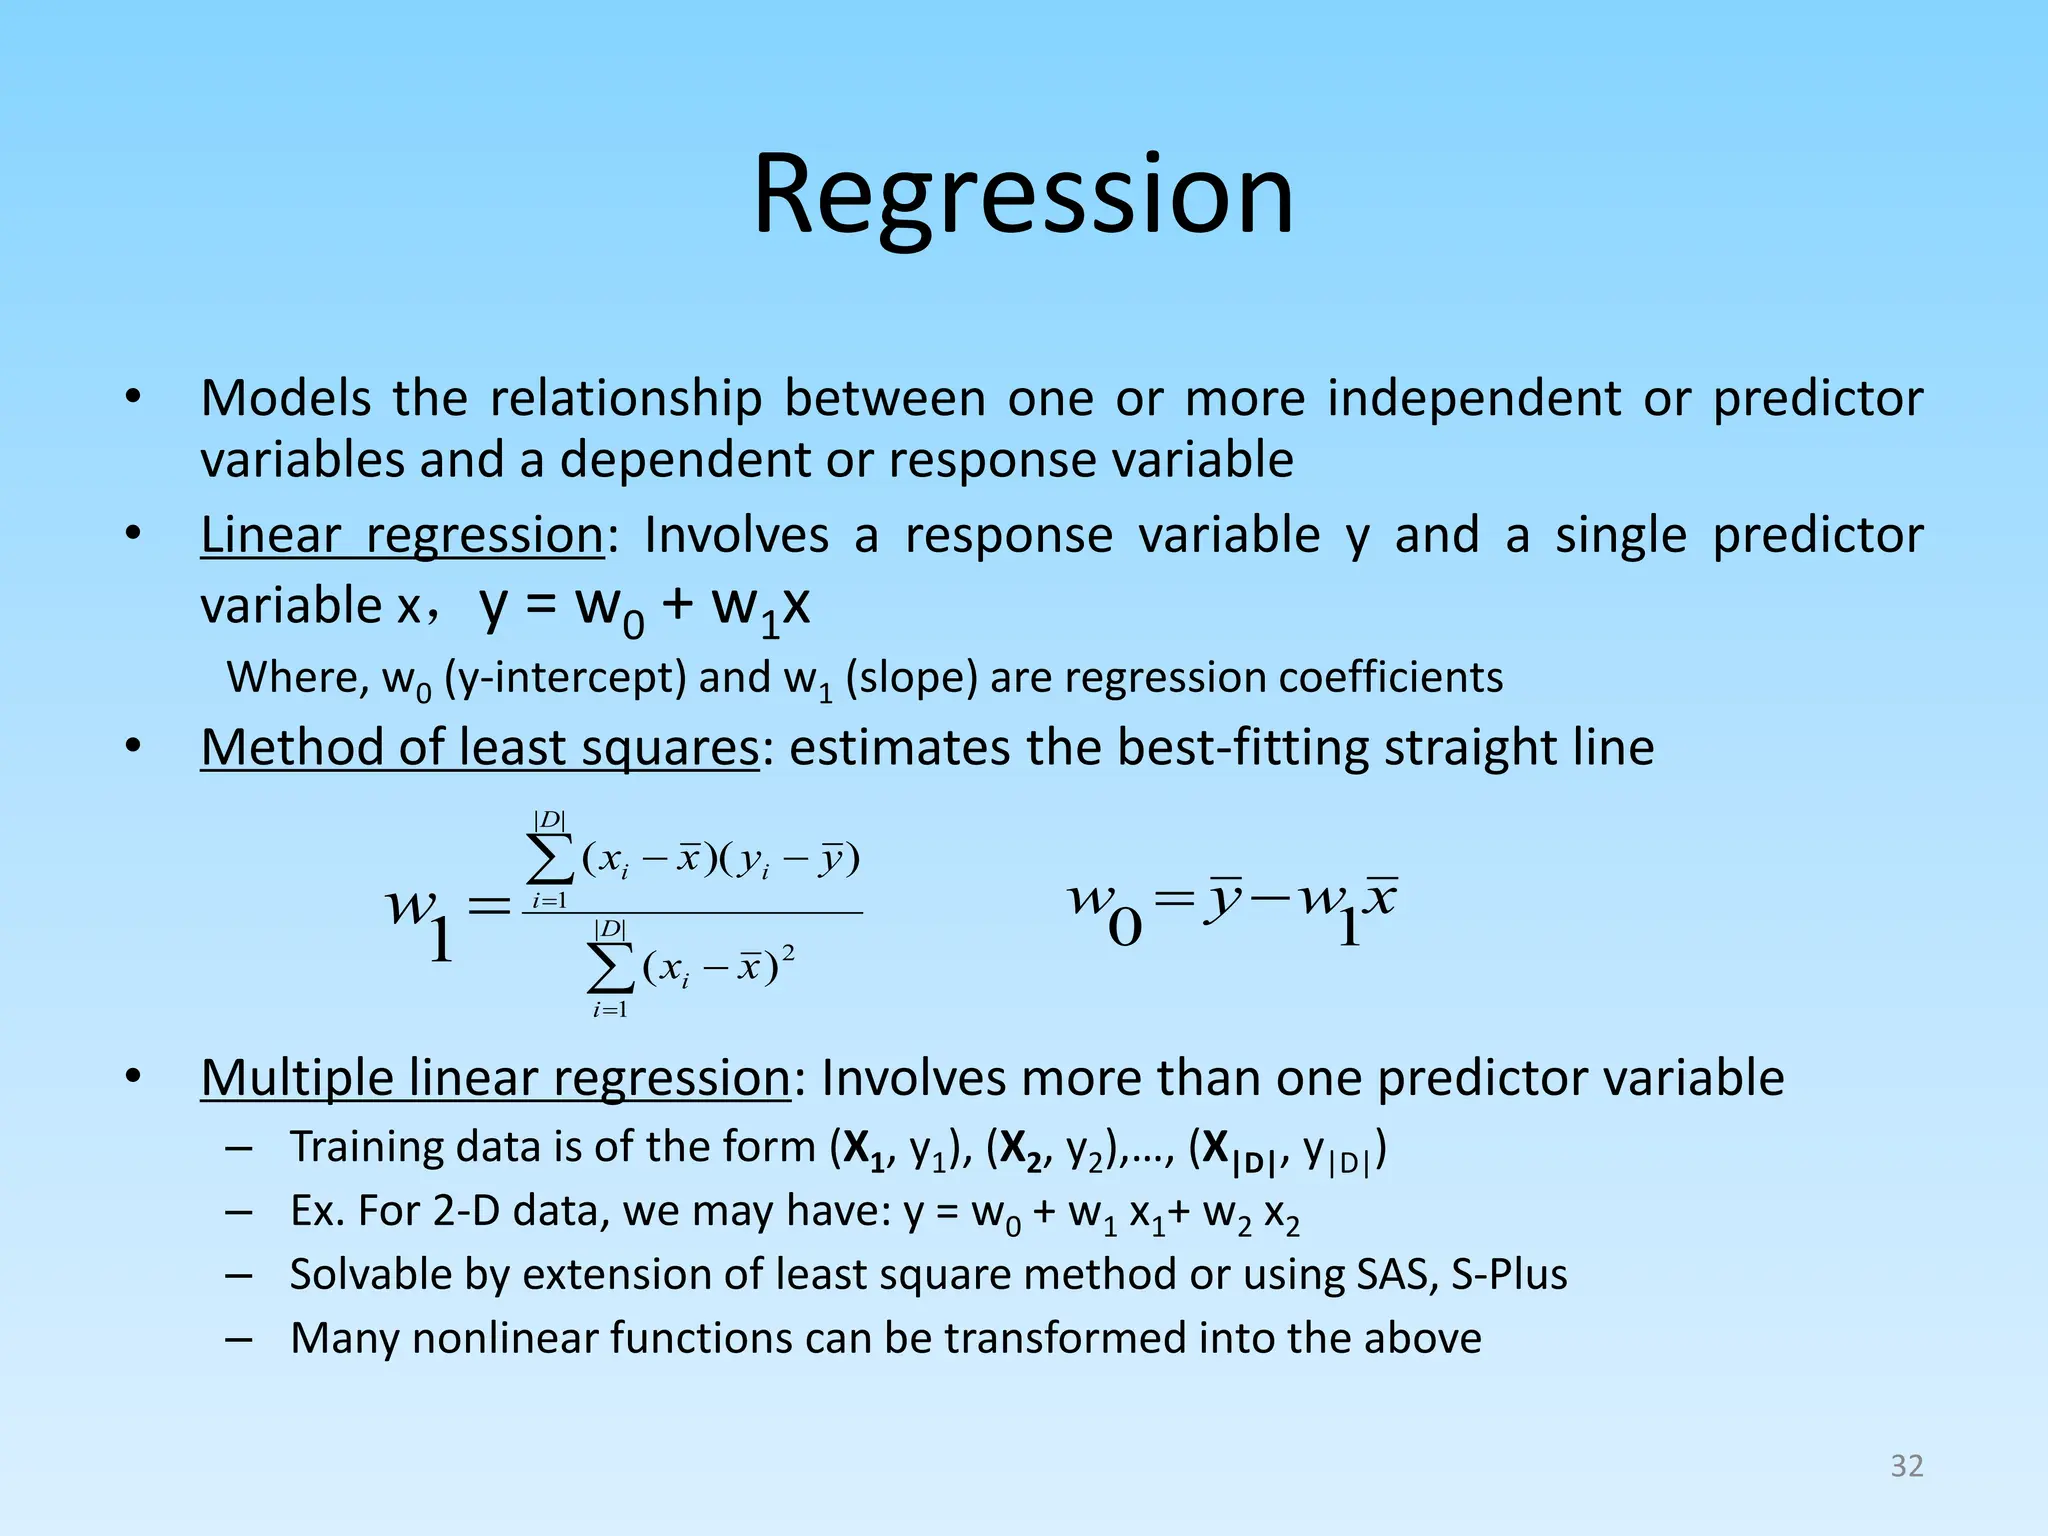
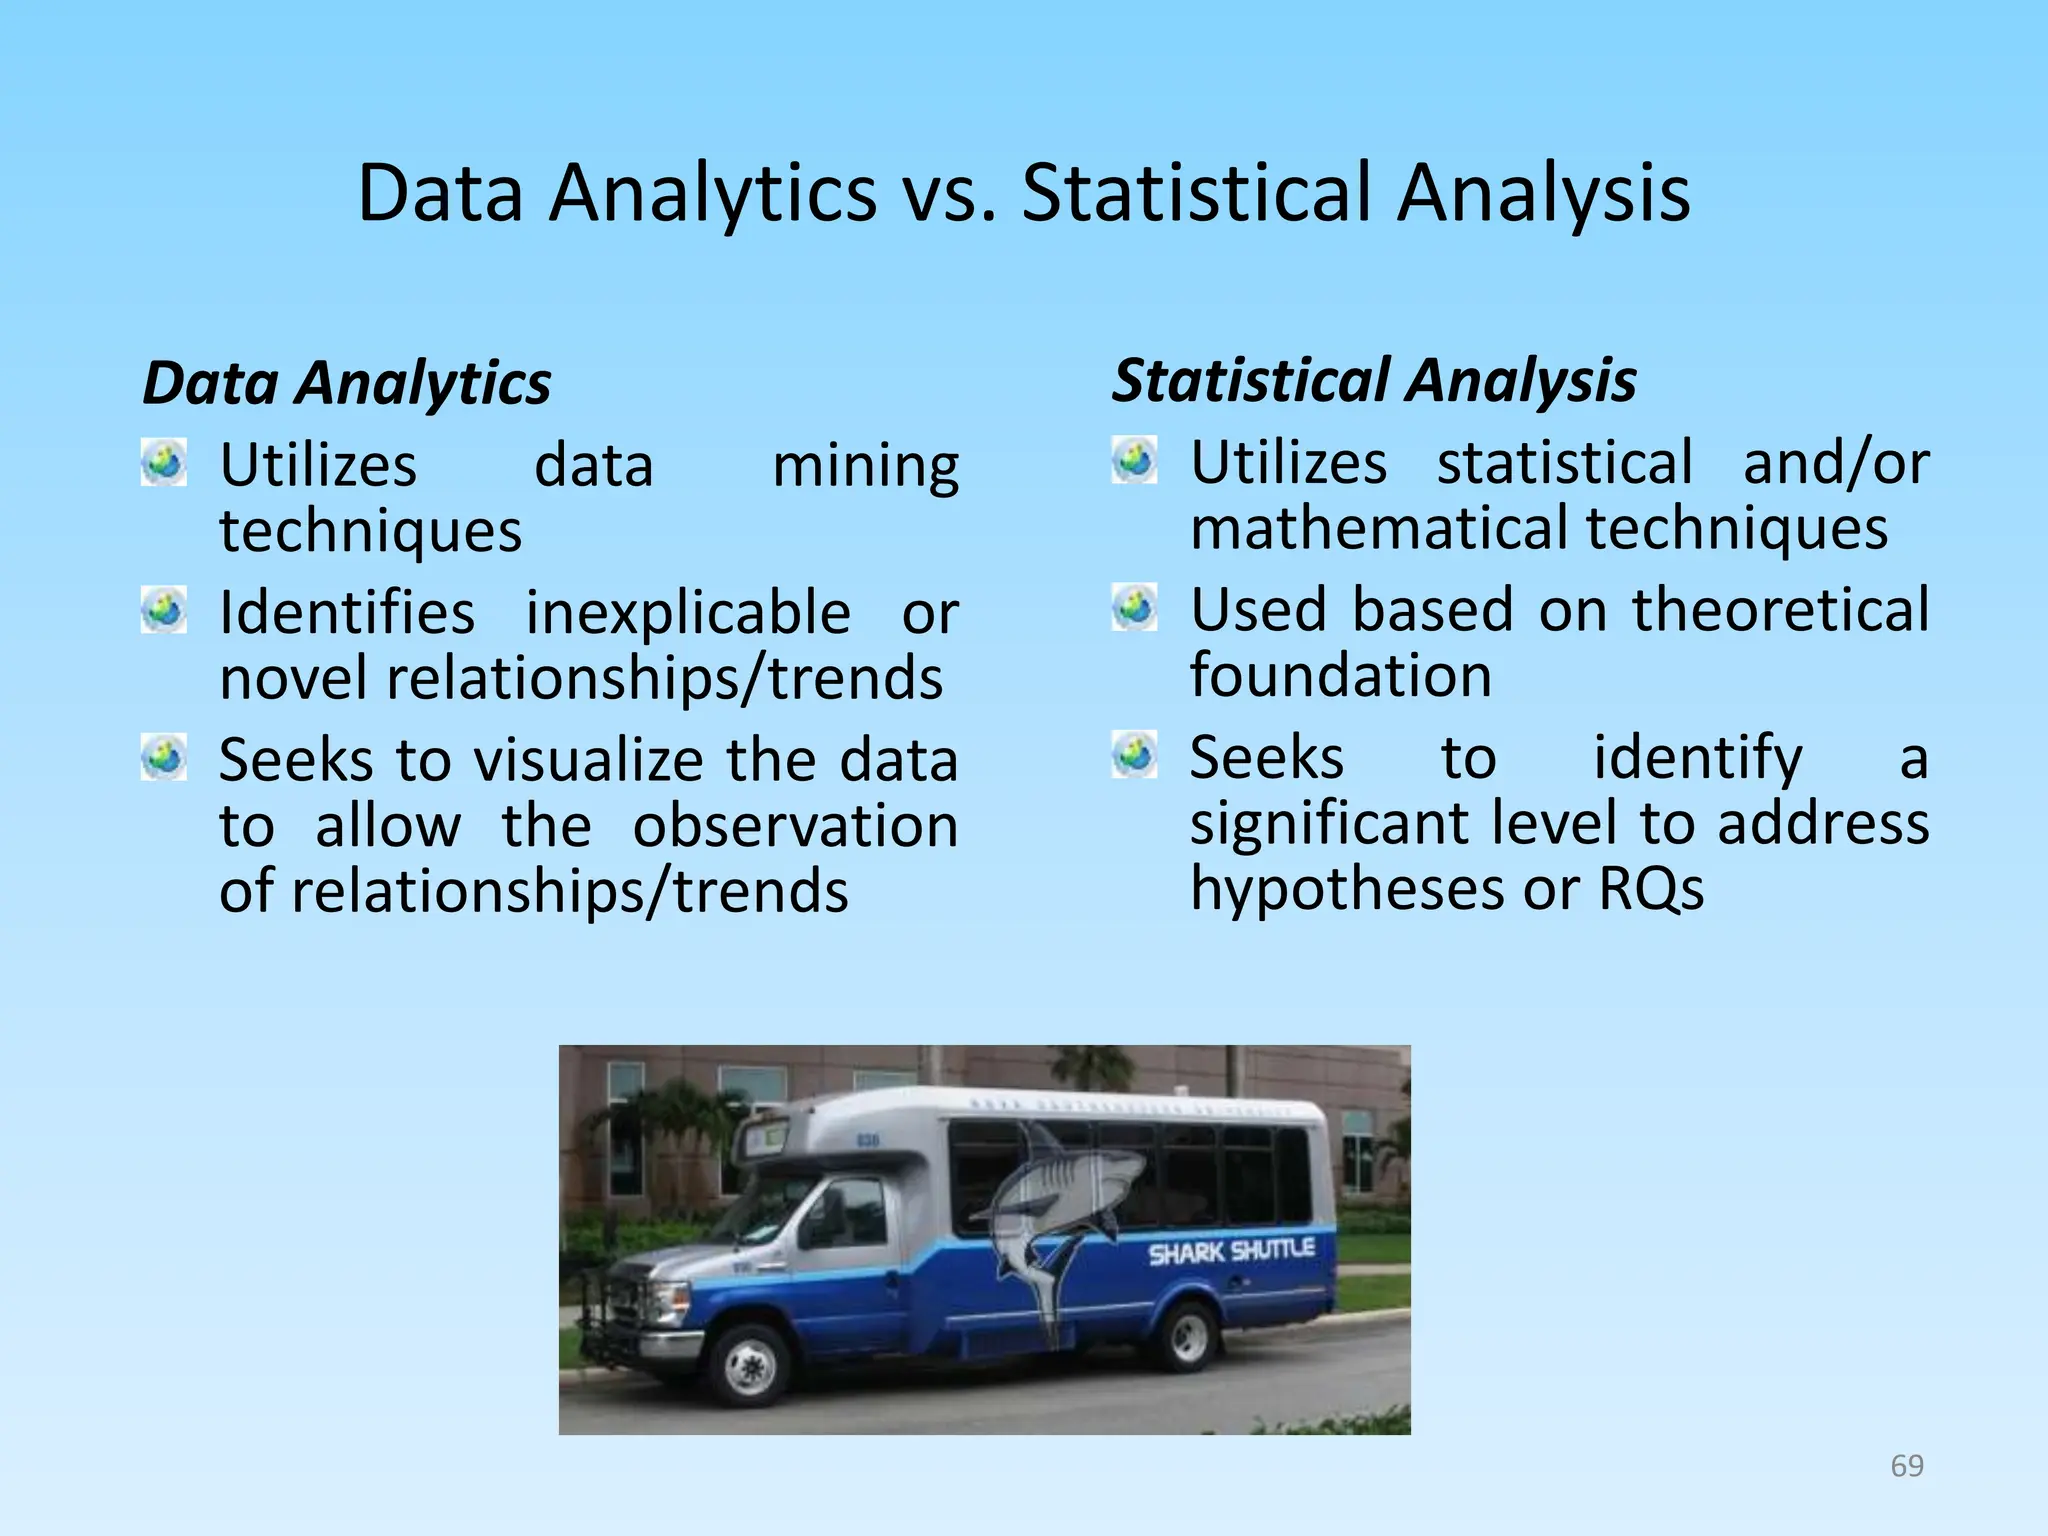
2. Describing common types of data analytics techniques like classification, regression, and different modeling approaches.
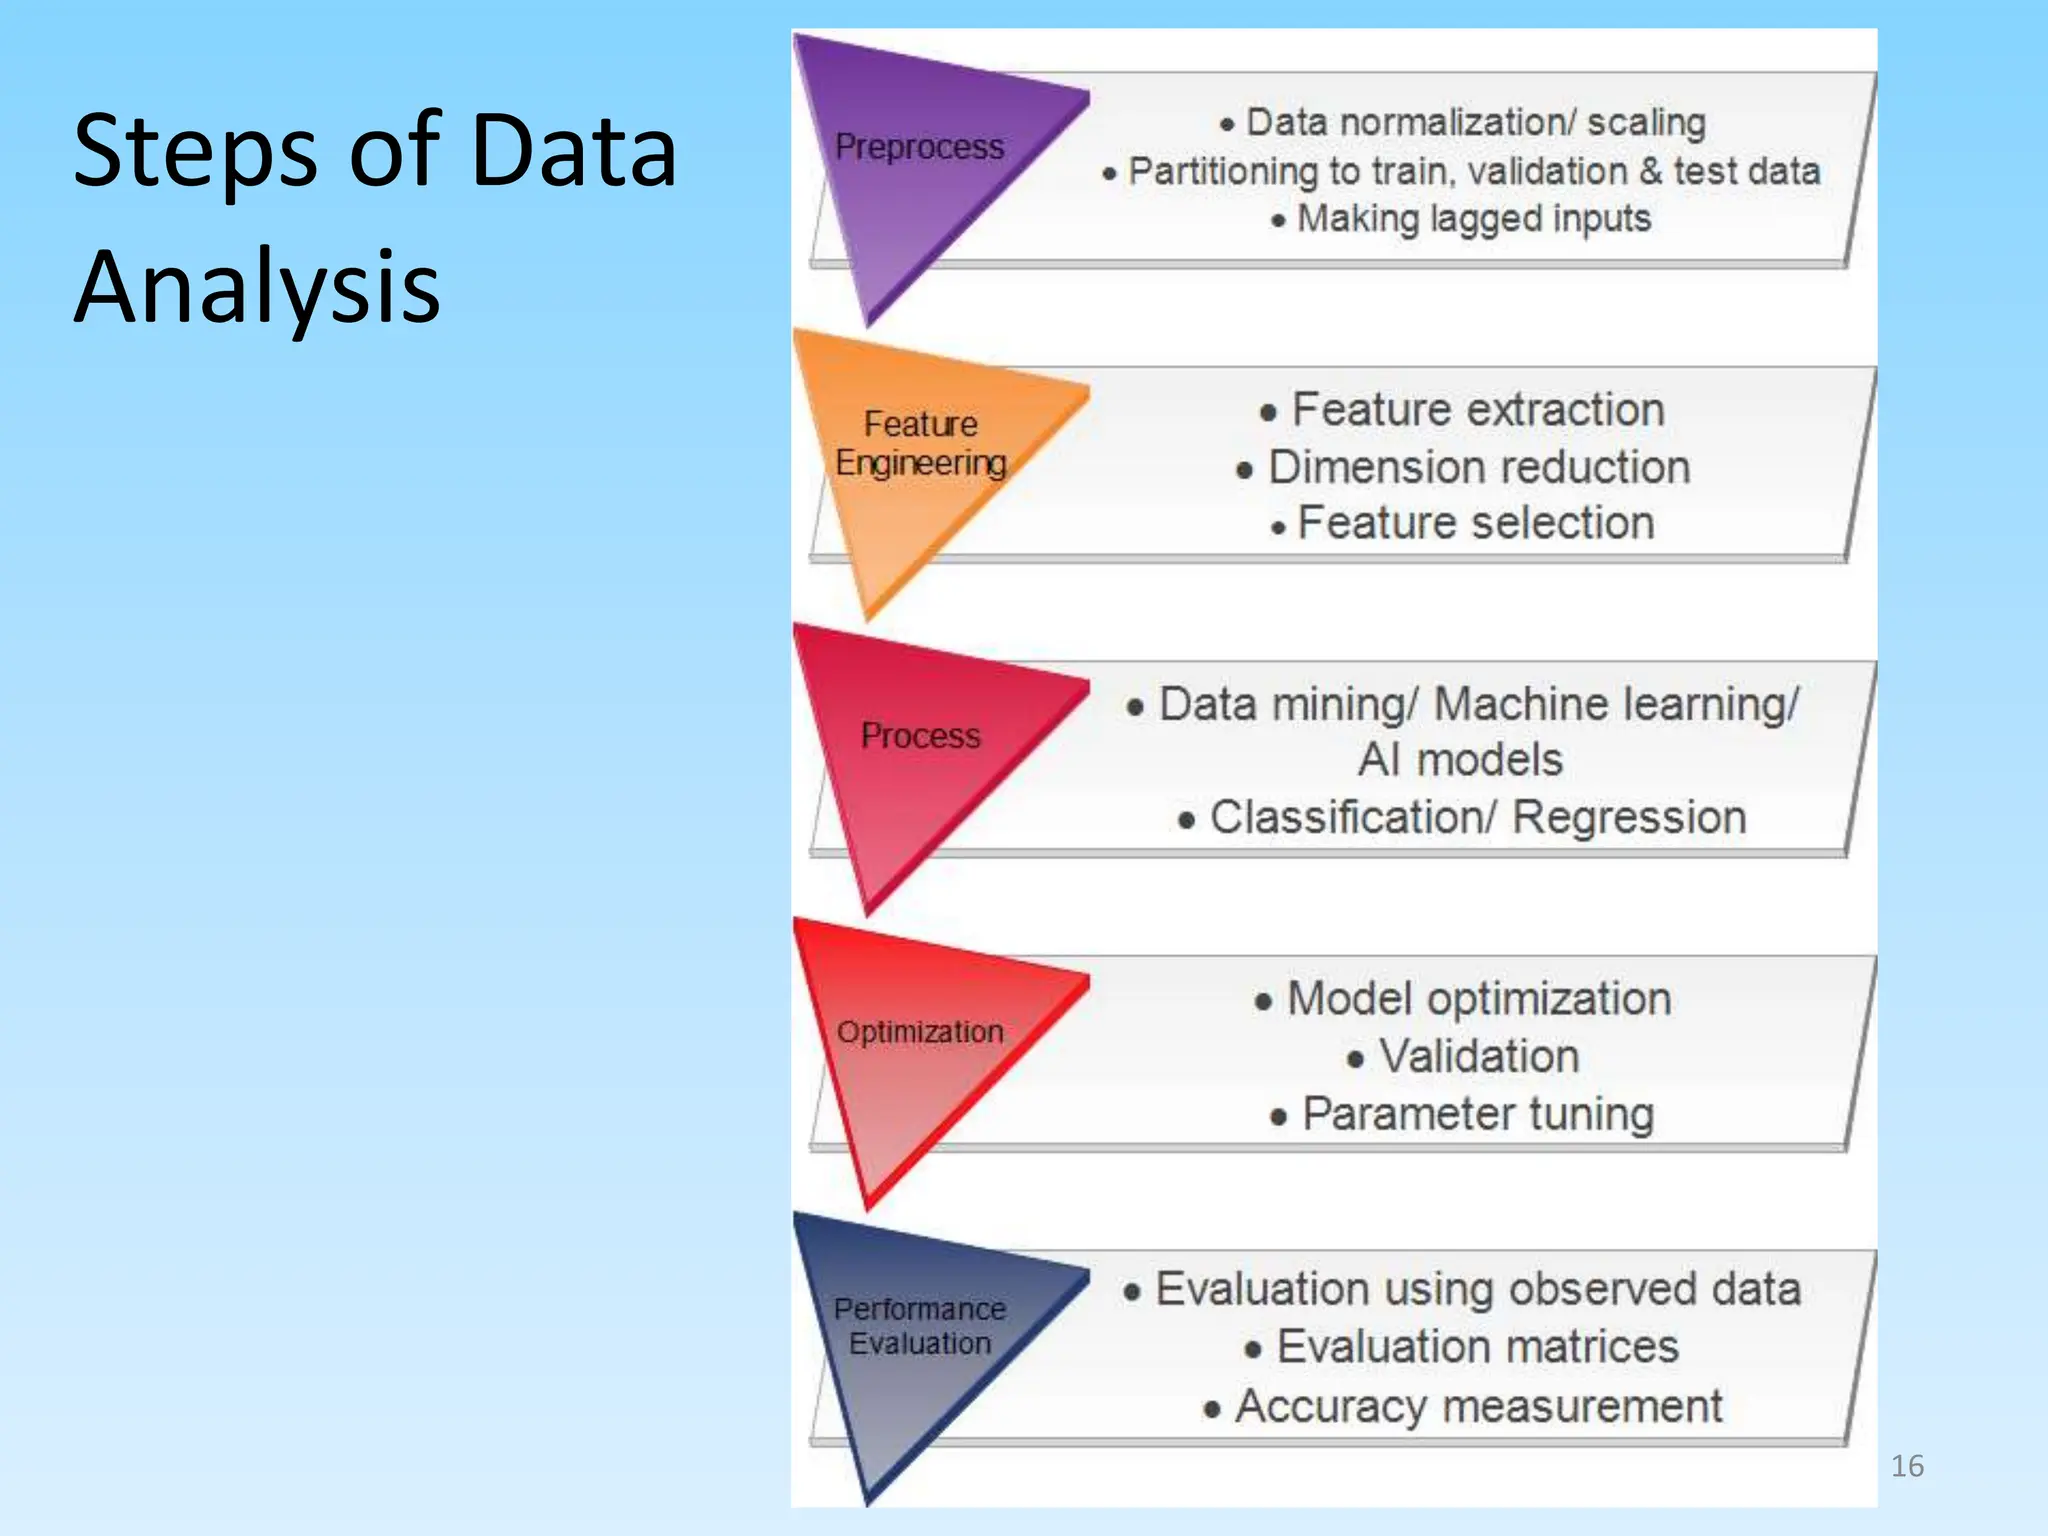
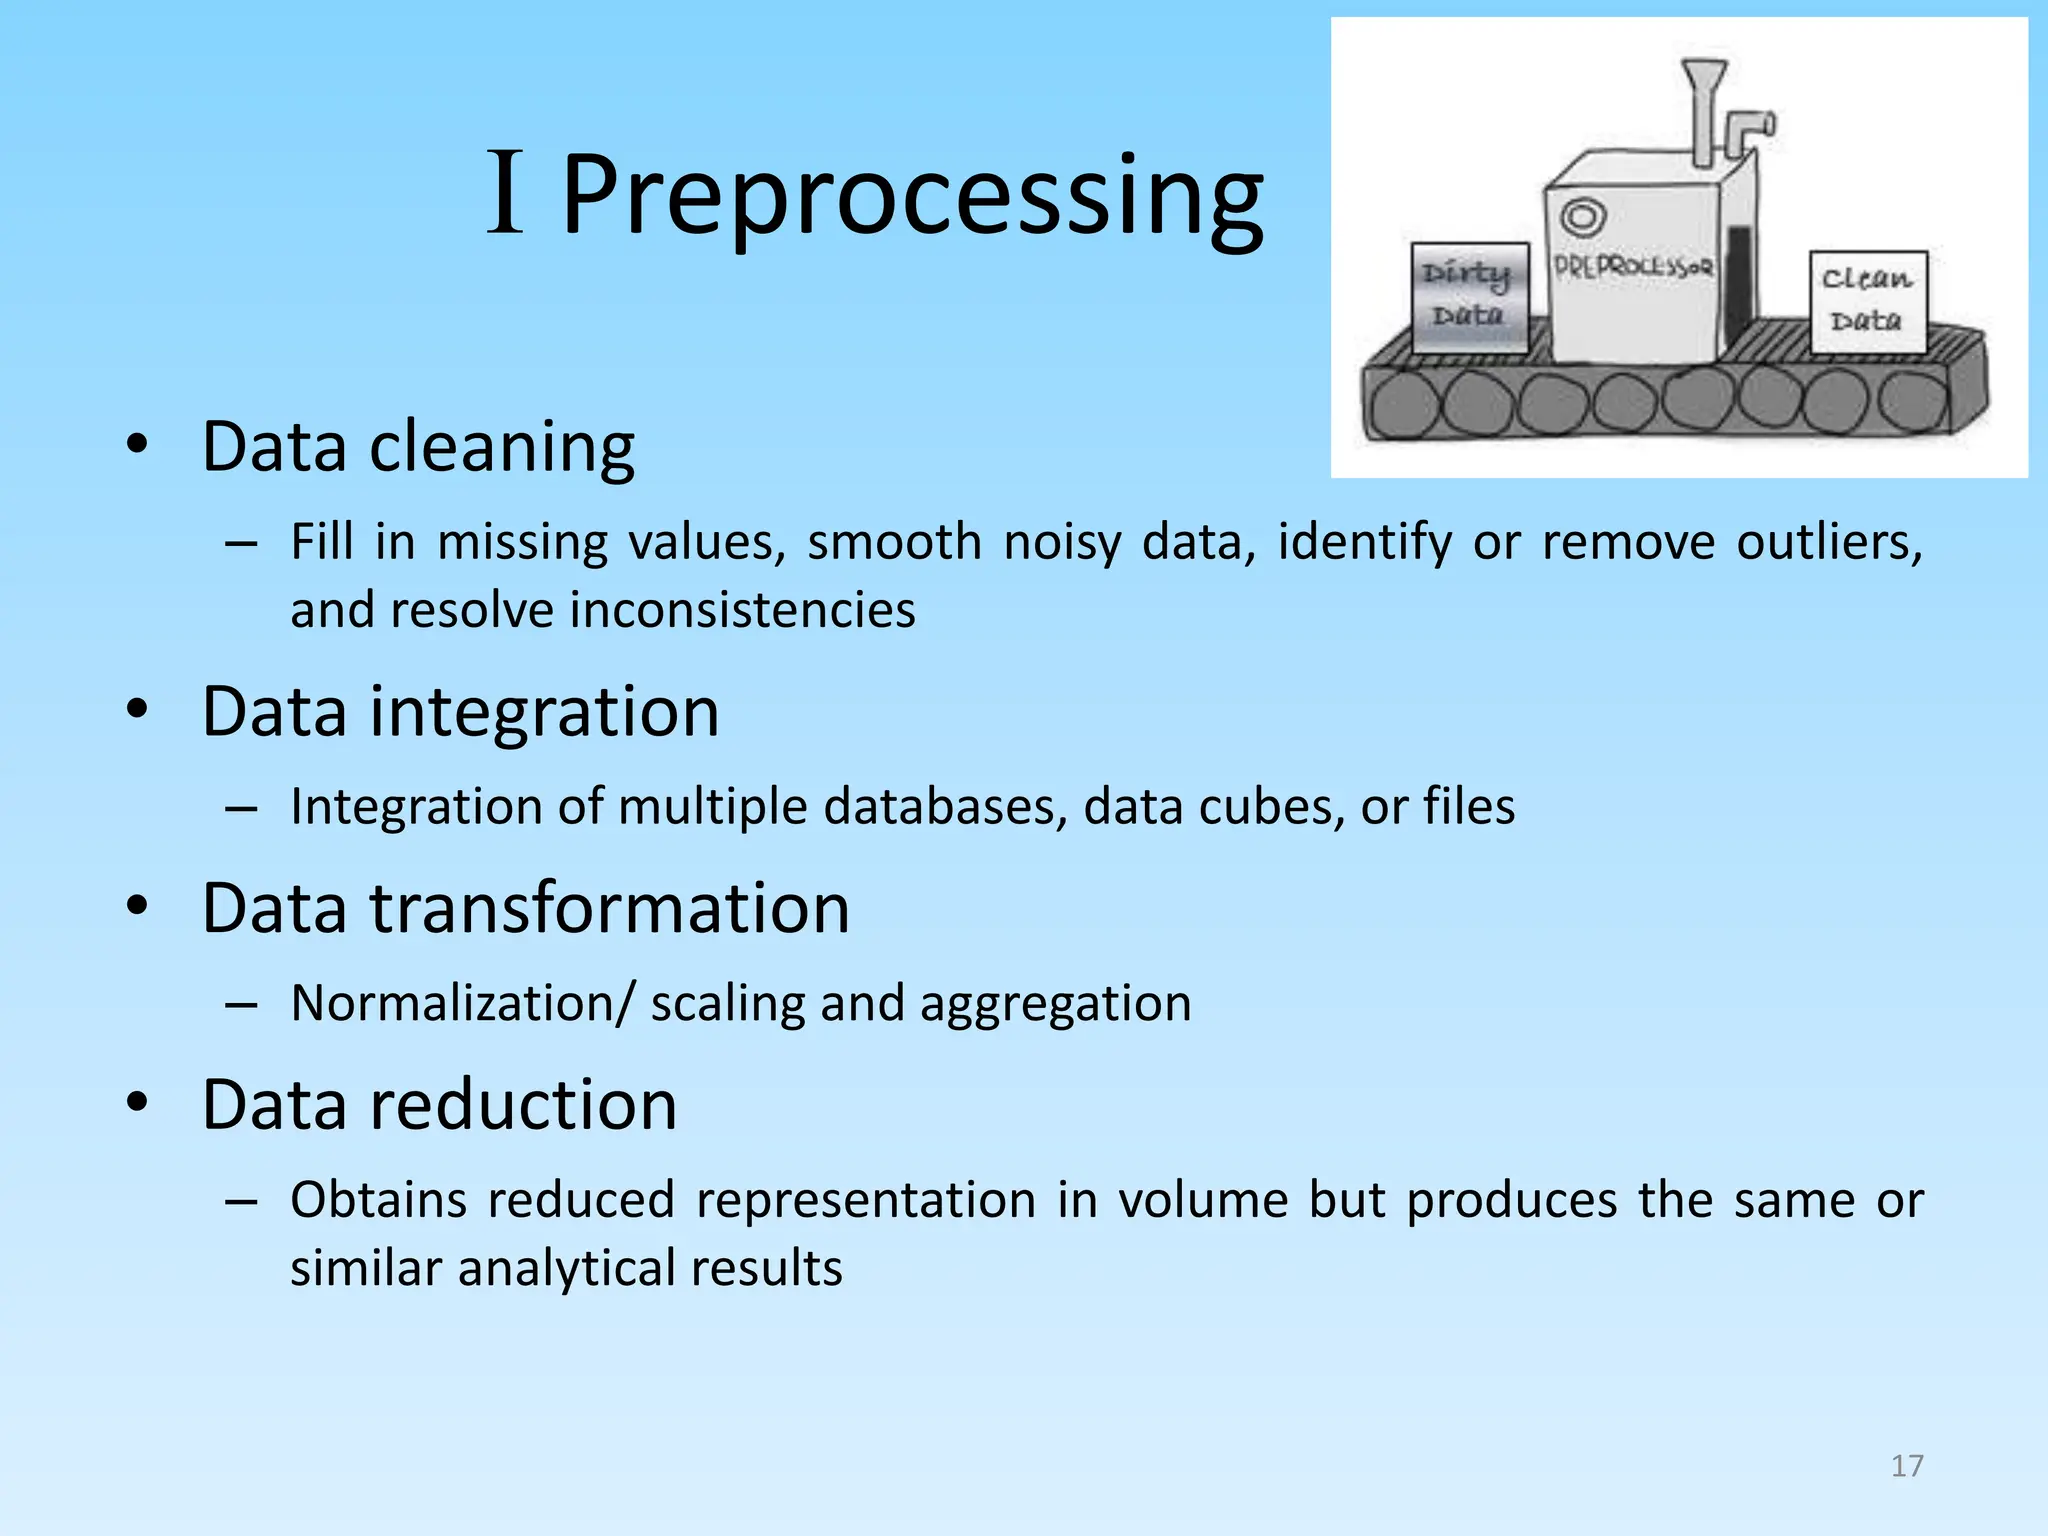
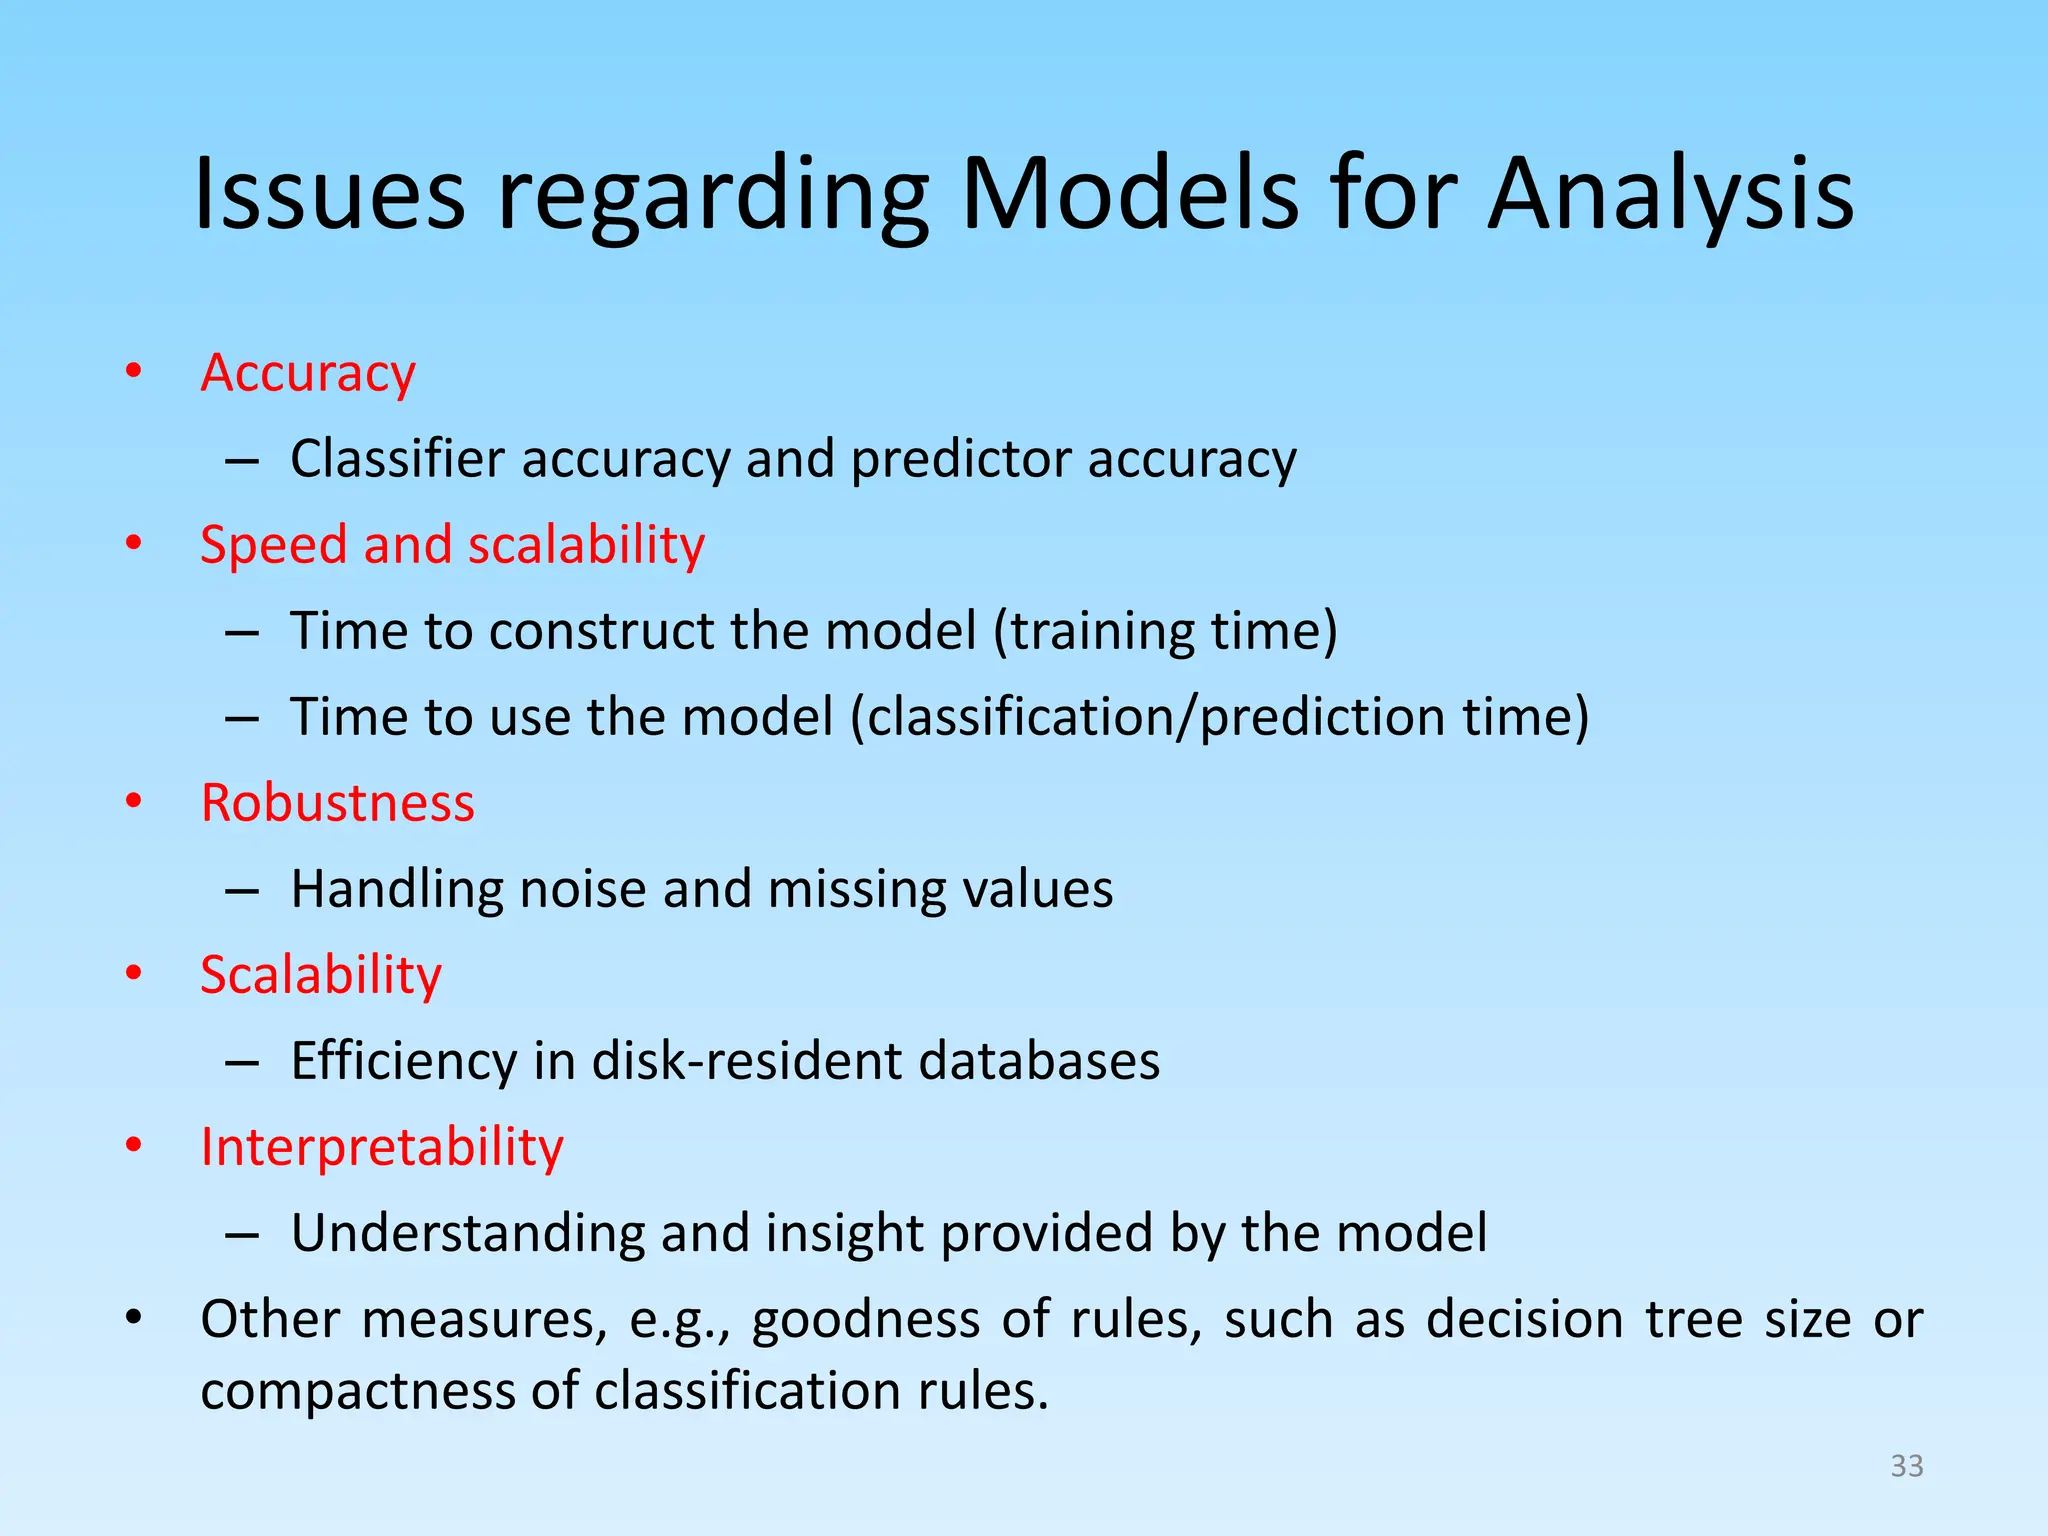
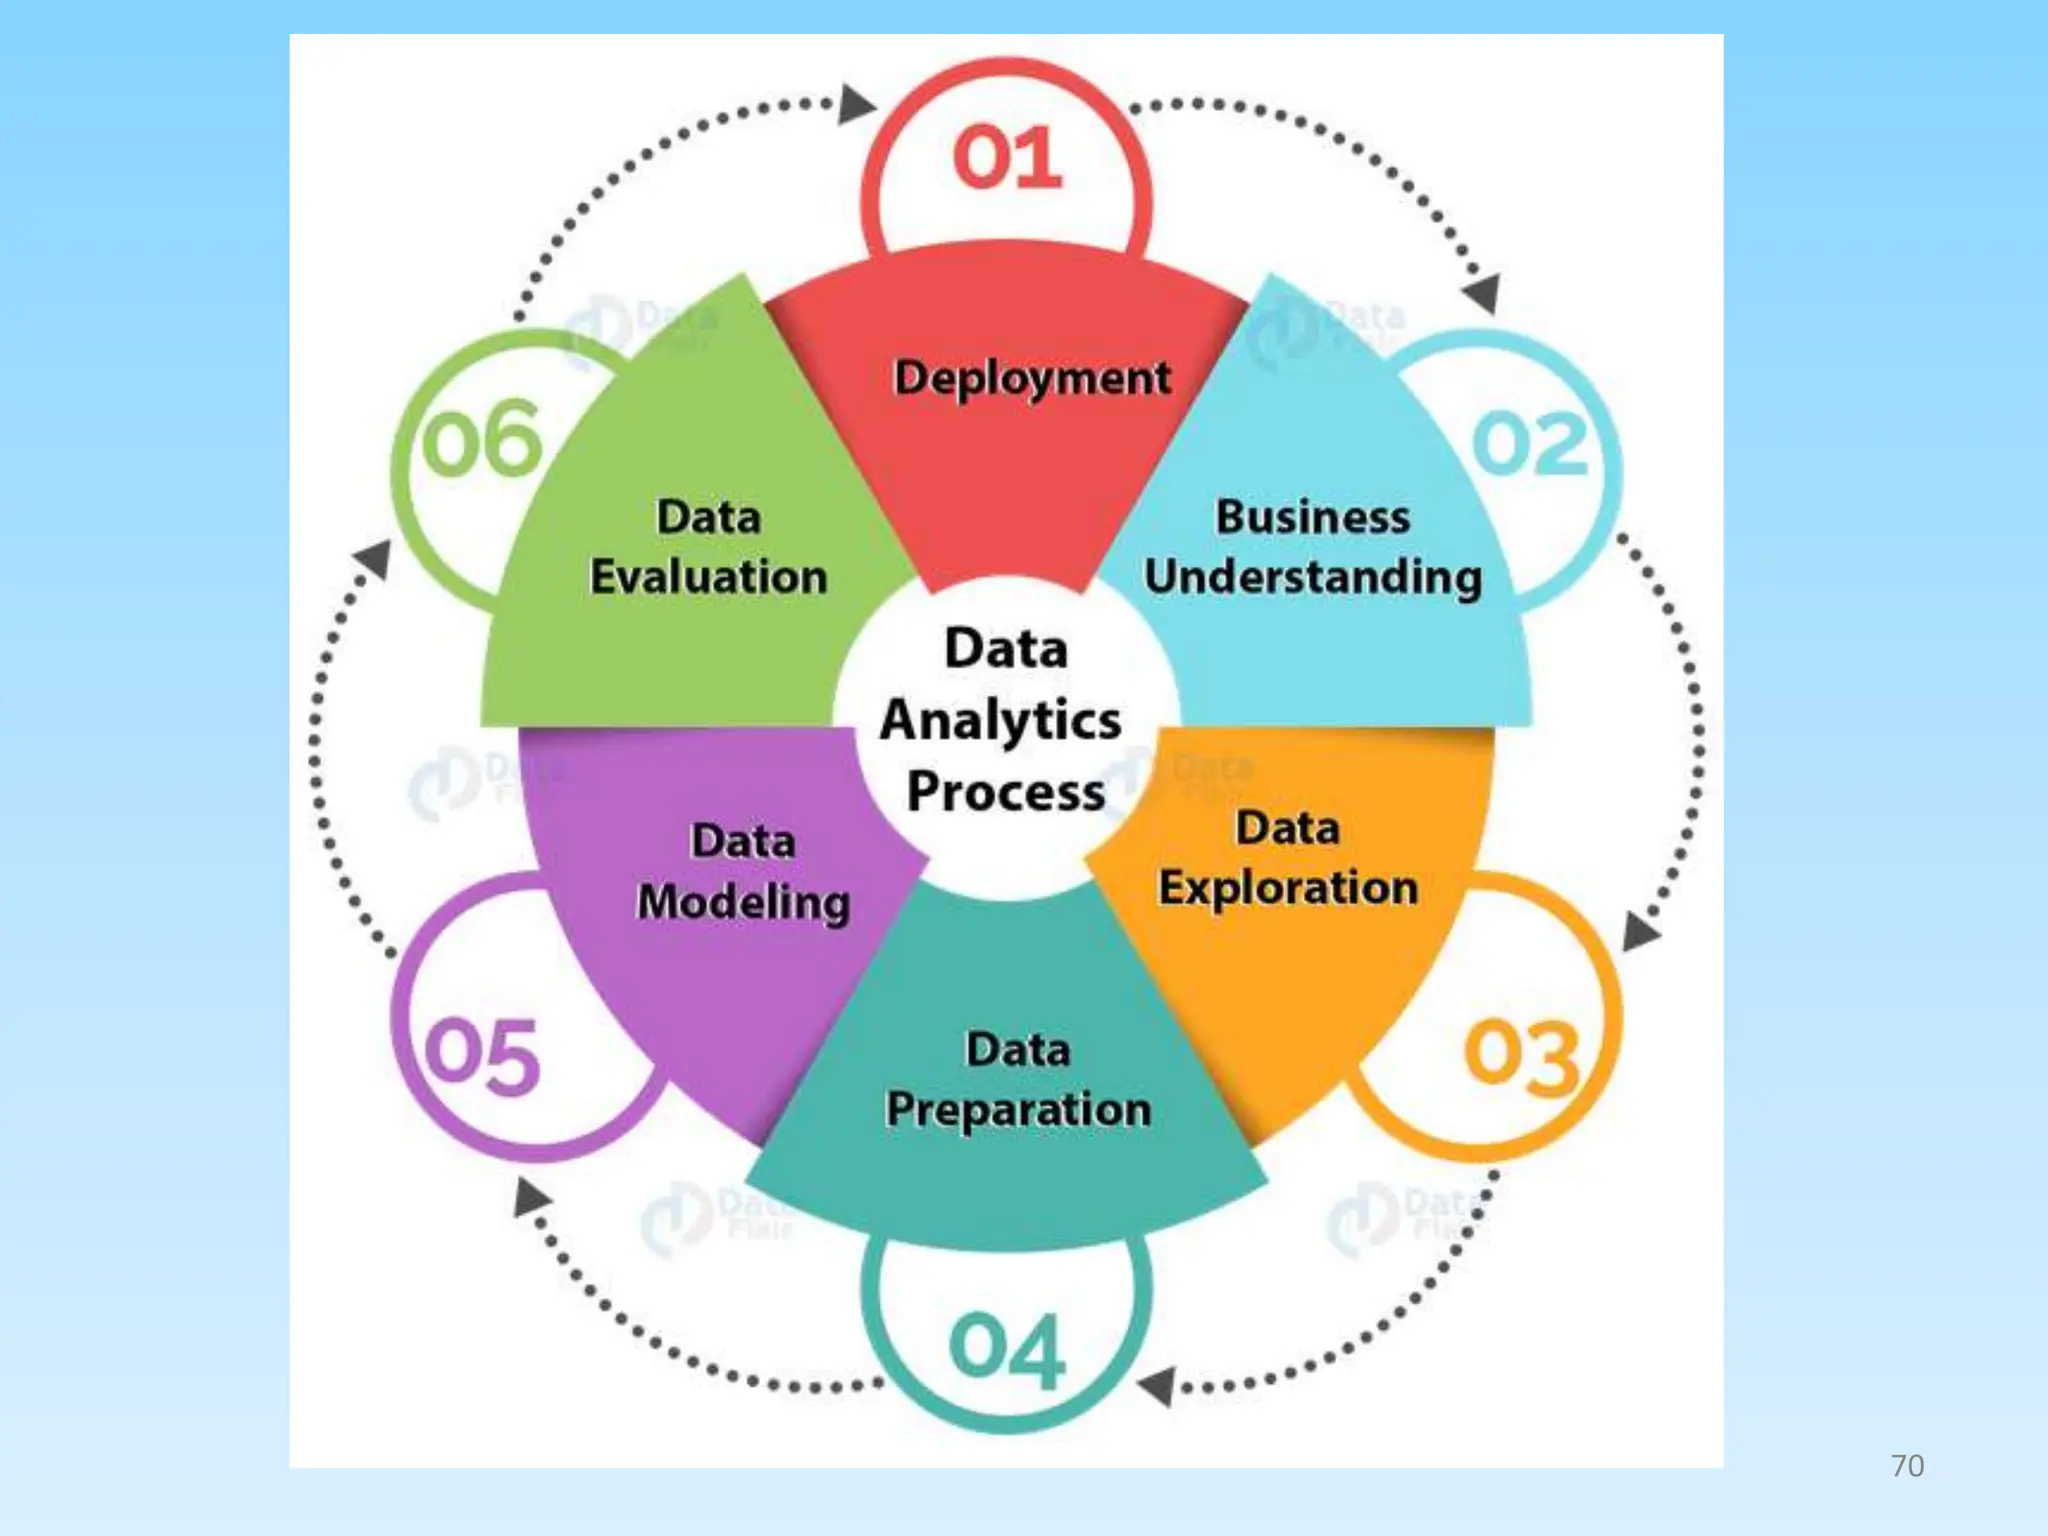
3. Explaining the data analytics process from preprocessing data, feature engineering, model training/optimization, to performance evaluation.


![Computer Networks 01[1 using all terms].pptx](https://cdn.slidesharecdn.com/ss_thumbnails/computernetworks011-251214040533-327dd9f8-thumbnail.jpg?width=640&height=640&fit=bounds)


