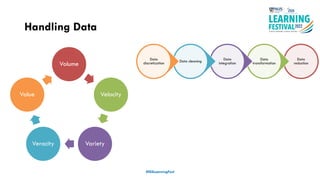
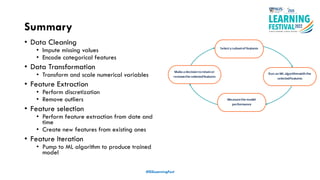
Feature Engineering for IoT
Darryl Ng
#ISSLearningFest
Rise of IoT
#ISSLearningFest
https://www.statista.com/statistics/1183457/iot-connected-devices-worldwide/
IoT Reference Architecture
#ISSLearningFest
https://docs.microsoft.com/en-us/azure/architecture/reference-architectures/iot
Sense Connect Collect Process Act
Devices generate events
•Through platform to
application
Insights based on data
•Derived by evaluating
incoming device events
Actions based on insights
•Execute processes and
workflows in the application
DATA
IoT and Cloud Providers
1. Capabilities added to the devices
a. Device side processing
• Real-time analytics, edge ML capabilities
2. Gateway to communicate with downstream, heterogeneous devices
3. Cloud services
a. Device management capabilities, i.e. device shadowing, provisioning,
OTA updates, security
a. Stream processing
b. Big data stack
• Analytics and visualization
#ISSLearningFest
Cloud-centric Device/Gateway-
centric
Handling Data
#ISSLearningFest
Volume
Velocity
Variety
Veracity
Value
Data
reduction
Data
transformation
Data
integration
Data cleaning
Data
discretization
Data Collection
• Data collection can be a significant effort
in machine learning
• Types of Data
• Historical Data (e.g. past weather)
• Generated data (e.g. weather from sensors)
• Manually collected (e.g. observe or visual
inputs at different times of the day)
• Collect data to infer its probability
distribution
• Generate more data from the probability
distribution
#ISSLearningFest
Feature Engineering
• Extracting features out of data and transforming them into something
that can be used as a learning model in machine learning algorithm
• Accuracy of machine learning model depends on the quality of data
used for learning
• Good Features => Model learns quickly
• Bad Features => Model doesn’t learn
#ISSLearningFest
Features, Samples and Label
date precipitation temp_max temp_min wind weather
1/1/2012 0 12.8 5 4.7drizzle
1/2/2012 10.9 10.6 2.8 4.5rain
1/3/2012 0.8 11.7 7.2 2.3rain
1/4/2012 20.3 12.2 5.6 4.7rain
1/5/2012 1.3 8.9 2.8 6.1rain
1/6/2012 2.5 4.4 2.2 2.2rain
1/7/2012 0 7.2 2.8 2.3rain
1/8/2012 0 10 2.8 2sun
1/9/2012 4.3 9.4 5 3.4rain
1/10/2012 1 6.1 0.6 3.4rain
1/11/2012 0 6.1 -1.1 5.1sun
1/12/2012 0 6.1 -1.7 1.9sun
1/13/2012 0 5 -2.8 1.3sun
1/14/2012 0 16.1 1.7 4.3sun
1/15/2012 0 21.1 7.2 4.1sun
1/16/2012 0 20 6.1 2.1sun
1/17/2012 0 14.4 3.9 3sun
1/18/2012 0 18.3 4.4 4.3sun
1/19/2012 0 25.6 12.8 2.2drizzle
1/20/2012 0 18.9 13.9 2.8drizzle
1/21/2012 0 22.2 13.3 1.7drizzle
#ISSLearningFest
sample
features label
Imputation
Categories of missing data:
1. Missing at Random (MAR)
• More data available on a different sample.
2. Missing Completely at Random
• No relationship exists between missing values and
other observations.
3. Missing Not at Random
• There’s a reason why the values are missing and
records should be flagged.
• Numerical
• Categorical
#ISSLearningFest
date precipitation temp_max temp_min wind
1/1/2012 0 12.8 5 4.7
1/2/2012 10.9 10.6 2.8 4.5
1/3/2012 0.8 11.7 7.2 2.3
1/4/2012 20.3 12.2 5.6 4.7
1/5/2012 1.3 8.9 2.8 6.1
1/6/2012 2.5 4.4 2.2 2.2
1/7/2012 0 7.2 2.8 2.3
1/8/2012 0 10 2.8 2
1/9/2012 4.3 9.4 5 3.4
1/10/2012 1 6.1 0.6 3.4
1/11/2012 0 6.1 -1.1 5.1
1/12/2012 0 6.1 -1.7 1.9
1/13/2012 0 5 -2.8 1.3
1/14/2012 0 16.1 1.7 4.3
1/15/2012 0 21.1 7.2 4.1
1/16/2012 20 6.1 2.1
1/17/2012 14.4 3.9 3
1/18/2012 18.3 4.4 4.3
1/19/2012 0 25.6 12.8 2.2
1/20/2012 0 18.9 13.9 2.8
1/21/2012 0 22.2 13.3 1.7
date precipitation temp_max temp_min wind
1/1/2012 0 12.8 5 4.7
1/2/2012 10.9 10.6 2.8 4.5
1/3/2012 0.8 11.7 7.2 2.3
1/4/2012 20.3 12.2 5.6 4.7
1/5/2012 1.3 8.9 2.8 6.1
1/6/2012 2.5 4.4 2.2 2.2
1/7/2012 0 7.2 2.8 2.3
1/8/2012 0 10 2.8 2
1/9/2012 4.3 9.4 5 3.4
1/10/2012 1 6.1 0.6 3.4
1/11/2012 0 6.1 -1.1 5.1
1/12/2012 0 6.1 -1.7 1.9
1/13/2012 0 5 -2.8 1.3
1/14/2012 0 16.1 1.7 4.3
1/15/2012 0 21.1 7.2 4.1
1/16/2012 0 20 6.1 2.1
1/17/2012 0 14.4 3.9 3
1/18/2012 0 18.3 4.4 4.3
1/19/2012 0 25.6 12.8 2.2
1/20/2012 0 18.9 13.9 2.8
1/21/2012 0 22.2 13.3 1.7
Handling Outliers
• Removal
• Replacing values
• Capping
• Discretization
• Binning
#ISSLearningFest
date precipitation temp_max temp_min wind
1/1/2012 0 12.8 5 4.7
1/2/2012 10.9 10.6 2.8 4.5
1/3/2012 0.8 11.7 7.2 2.3
1/4/2012 20.3 12.2 5.6 4.7
1/5/2012 1.3 8.9 2.8 6.1
1/6/2012 2.5 4.4 2.2 2.2
1/7/2012 0 7.2 2.8 2.3
1/8/2012 0 10 2.8 2
1/9/2012 4.3 9.4 5 3.4
1/10/2012 1 6.1 0.6 3.4
1/11/2012 0 6.1 -1.1 5.1
1/12/2012 0 6.1 -1.7 1.9
1/13/2012 0 5 -2.8 1.3
1/14/2012 0 16.1 1.7 4.3
1/15/2012 0 21.1 7.2 4.1
1/16/2012 0 20 6.1 2.1
1/17/2012 0 14.4 3.9 3
1/18/2012 0 18.3 4.4 4.3
1/19/2012 0 25.6 12.8 2.2
1/20/2012 0 18.9 13.9 2.8
1/21/2012 0 22.2 13.3 1.7
Feature Selection
• Select features that are highly correlated
to target
• Pick the most representative features from
existing features
• For selected features, look for sets of
features that are highly correlated with
each other
• In each set, select feature with highest
correlation to target
• Use final selected features to train the
model
#ISSLearningFest
date precipitation temp_max temp_min wind weather
1/1/2012 0 12.8 5 4.7 drizzle
1/2/2012 10.9 10.6 2.8 4.5 rain
1/3/2012 0.8 11.7 7.2 2.3 rain
1/4/2012 20.3 12.2 5.6 4.7 rain
1/5/2012 1.3 8.9 2.8 6.1 rain
1/6/2012 2.5 4.4 2.2 2.2 rain
1/7/2012 0 7.2 2.8 2.3 rain
1/8/2012 0 10 2.8 2 sun
1/9/2012 4.3 9.4 5 3.4 rain
1/10/2012 1 6.1 0.6 3.4 rain
1/11/2012 0 6.1 -1.1 5.1 sun
1/12/2012 0 6.1 -1.7 1.9 sun
1/13/2012 0 5 -2.8 1.3 sun
1/14/2012 0 16.1 1.7 4.3 sun
1/15/2012 0 21.1 7.2 4.1 sun
1/16/2012 0 20 6.1 2.1 sun
1/17/2012 0 14.4 3.9 3 sun
1/18/2012 0 18.3 4.4 4.3 sun
1/19/2012 0 25.6 12.8 2.2 drizzle
1/20/2012 0 18.9 13.9 2.8 drizzle
1/21/2012 0 22.2 13.3 1.7 drizzle
Selected features implies state
Pearson Correlation
• Measure of the extend to which two random variables change in
tandem
• Value between -1 to +1
• -1 indicates strong negative linear correlation
• 0 indicates no correlation
• +1 indicates strong positive correlation
#ISSLearningFest
Correlation between variables
#ISSLearningFest
Feature Extraction
• Analyse existing features to generate new features
• Dimension Reduction
• Reducing a 4D/3D space  2D space
#ISSLearningFest
date precipitation temp_max temp_min wind weather
1/1/2012 0 12.8 5 4.7 drizzle
1/2/2012 10.9 10.6 2.8 4.5 rain
1/3/2012 0.8 11.7 7.2 2.3 rain
1/4/2012 20.3 12.2 5.6 4.7 rain
1/5/2012 1.3 8.9 2.8 6.1 rain
1/6/2012 2.5 4.4 2.2 2.2 rain
1/7/2012 0 7.2 2.8 2.3 rain
1/8/2012 0 10 2.8 2 sun
1/9/2012 4.3 9.4 5 3.4 rain
1/10/2012 1 6.1 0.6 3.4 rain
1/11/2012 0 6.1 -1.1 5.1 sun
1/12/2012 0 6.1 -1.7 1.9 sun
1/13/2012 0 5 -2.8 1.3 sun
1/14/2012 0 16.1 1.7 4.3 sun
1/15/2012 0 21.1 7.2 4.1 sun
1/16/2012 0 20 6.1 2.1 sun
1/17/2012 0 14.4 3.9 3 sun
1/18/2012 0 18.3 4.4 4.3 sun
1/19/2012 0 25.6 12.8 2.2 drizzle
1/20/2012 0 18.9 13.9 2.8 drizzle
1/21/2012 0 22.2 13.3 1.7 drizzle
PCA Analysis
precipitation temp_max weather
0 12.8 drizzle
10.9 10.6 rain
0.8 11.7 rain
20.3 12.2 rain
1.3 8.9 rain
2.5 4.4 rain
0 7.2 rain
0 10 sun
4.3 9.4 rain
1 6.1 rain
0 6.1 sun
0 6.1 sun
0 5 sun
0 16.1 sun
0 21.1 sun
0 20 sun
0 14.4 sun
0 18.3 sun
0 25.6 drizzle
0 18.9 drizzle
0 22.2 drizzle
Feature Scaling
• Different scales in our dataset
• Different techniques
• Normalization: min-max scaling
• Values in column bounded between fixed range 0 and 1
• Standardization: Z-score normalization
• Values in column rescale to Gaussian distribution, i.e. show
mean and variance
• Standardization
• Reduces each feature to similar scale for ease of
comparison
• Performed within each feature, not across features
• Shift dataset to origin allows learning models to learn
faster and better
#ISSLearningFest
date precipitation temp_max temp_min wind weather
1/1/2012 0 12.8 5 4.7 drizzle
1/2/2012 10.9 10.6 2.8 4.5 rain
1/3/2012 0.8 11.7 7.2 2.3 rain
1/4/2012 20.3 12.2 5.6 4.7 rain
1/5/2012 1.3 8.9 2.8 6.1 rain
1/6/2012 2.5 4.4 2.2 2.2 rain
1/7/2012 0 7.2 2.8 2.3 rain
1/8/2012 0 10 2.8 2 sun
1/9/2012 4.3 9.4 5 3.4 rain
1/10/2012 1 6.1 0.6 3.4 rain
1/11/2012 0 6.1 -1.1 5.1 sun
1/12/2012 0 6.1 -1.7 1.9 sun
1/13/2012 0 5 -2.8 1.3 sun
1/14/2012 0 16.1 1.7 4.3 sun
1/15/2012 0 21.1 7.2 4.1 sun
1/16/2012 0 20 6.1 2.1 sun
1/17/2012 0 14.4 3.9 3 sun
1/18/2012 0 18.3 4.4 4.3 sun
1/19/2012 0 25.6 12.8 2.2 drizzle
1/20/2012 0 18.9 13.9 2.8 drizzle
1/21/2012 0 22.2 13.3 1.7 drizzle
Small scale
Implementing ML algorithm for IoT solution
• Sampling
• Split dataset into training dataset
(80%) and test dataset (20%)
• Build ML model
• Put training dataset to ML algorithm for
training
• Output: Trained model/Predictor
generated
• Test ML model
• Use test dataset passed to
predictor/model
• Evaluate model
• determine the accuracy of our model
#ISSLearningFest
Summary
• Data Cleaning
• Impute missing values
• Encode categorical features
• Data Transformation
• Transform and scale numerical variables
• Feature Extraction
• Perform discretization
• Remove outliers
• Feature selection
• Perform feature extraction from date and
time
• Create new features from existing ones
• Feature Iteration
• Pump to ML algorithm to produce trained
model
#ISSLearningFest
Give Us Your Feedback
#ISSLearningFest
Day 2 Programme
Question & Answer
#ISSLearningFest
Thank You!
darrylng@nus.edu.sg
#ISSLearningFest

Feature Engineering for IoT

  • 1.
    Feature Engineering forIoT Darryl Ng #ISSLearningFest
  • 2.
  • 3.
    IoT Reference Architecture #ISSLearningFest https://docs.microsoft.com/en-us/azure/architecture/reference-architectures/iot SenseConnect Collect Process Act Devices generate events •Through platform to application Insights based on data •Derived by evaluating incoming device events Actions based on insights •Execute processes and workflows in the application DATA
  • 4.
    IoT and CloudProviders 1. Capabilities added to the devices a. Device side processing • Real-time analytics, edge ML capabilities 2. Gateway to communicate with downstream, heterogeneous devices 3. Cloud services a. Device management capabilities, i.e. device shadowing, provisioning, OTA updates, security a. Stream processing b. Big data stack • Analytics and visualization #ISSLearningFest Cloud-centric Device/Gateway- centric
  • 5.
  • 6.
    Data Collection • Datacollection can be a significant effort in machine learning • Types of Data • Historical Data (e.g. past weather) • Generated data (e.g. weather from sensors) • Manually collected (e.g. observe or visual inputs at different times of the day) • Collect data to infer its probability distribution • Generate more data from the probability distribution #ISSLearningFest
  • 7.
    Feature Engineering • Extractingfeatures out of data and transforming them into something that can be used as a learning model in machine learning algorithm • Accuracy of machine learning model depends on the quality of data used for learning • Good Features => Model learns quickly • Bad Features => Model doesn’t learn #ISSLearningFest
  • 8.
    Features, Samples andLabel date precipitation temp_max temp_min wind weather 1/1/2012 0 12.8 5 4.7drizzle 1/2/2012 10.9 10.6 2.8 4.5rain 1/3/2012 0.8 11.7 7.2 2.3rain 1/4/2012 20.3 12.2 5.6 4.7rain 1/5/2012 1.3 8.9 2.8 6.1rain 1/6/2012 2.5 4.4 2.2 2.2rain 1/7/2012 0 7.2 2.8 2.3rain 1/8/2012 0 10 2.8 2sun 1/9/2012 4.3 9.4 5 3.4rain 1/10/2012 1 6.1 0.6 3.4rain 1/11/2012 0 6.1 -1.1 5.1sun 1/12/2012 0 6.1 -1.7 1.9sun 1/13/2012 0 5 -2.8 1.3sun 1/14/2012 0 16.1 1.7 4.3sun 1/15/2012 0 21.1 7.2 4.1sun 1/16/2012 0 20 6.1 2.1sun 1/17/2012 0 14.4 3.9 3sun 1/18/2012 0 18.3 4.4 4.3sun 1/19/2012 0 25.6 12.8 2.2drizzle 1/20/2012 0 18.9 13.9 2.8drizzle 1/21/2012 0 22.2 13.3 1.7drizzle #ISSLearningFest sample features label
  • 9.
    Imputation Categories of missingdata: 1. Missing at Random (MAR) • More data available on a different sample. 2. Missing Completely at Random • No relationship exists between missing values and other observations. 3. Missing Not at Random • There’s a reason why the values are missing and records should be flagged. • Numerical • Categorical #ISSLearningFest date precipitation temp_max temp_min wind 1/1/2012 0 12.8 5 4.7 1/2/2012 10.9 10.6 2.8 4.5 1/3/2012 0.8 11.7 7.2 2.3 1/4/2012 20.3 12.2 5.6 4.7 1/5/2012 1.3 8.9 2.8 6.1 1/6/2012 2.5 4.4 2.2 2.2 1/7/2012 0 7.2 2.8 2.3 1/8/2012 0 10 2.8 2 1/9/2012 4.3 9.4 5 3.4 1/10/2012 1 6.1 0.6 3.4 1/11/2012 0 6.1 -1.1 5.1 1/12/2012 0 6.1 -1.7 1.9 1/13/2012 0 5 -2.8 1.3 1/14/2012 0 16.1 1.7 4.3 1/15/2012 0 21.1 7.2 4.1 1/16/2012 20 6.1 2.1 1/17/2012 14.4 3.9 3 1/18/2012 18.3 4.4 4.3 1/19/2012 0 25.6 12.8 2.2 1/20/2012 0 18.9 13.9 2.8 1/21/2012 0 22.2 13.3 1.7 date precipitation temp_max temp_min wind 1/1/2012 0 12.8 5 4.7 1/2/2012 10.9 10.6 2.8 4.5 1/3/2012 0.8 11.7 7.2 2.3 1/4/2012 20.3 12.2 5.6 4.7 1/5/2012 1.3 8.9 2.8 6.1 1/6/2012 2.5 4.4 2.2 2.2 1/7/2012 0 7.2 2.8 2.3 1/8/2012 0 10 2.8 2 1/9/2012 4.3 9.4 5 3.4 1/10/2012 1 6.1 0.6 3.4 1/11/2012 0 6.1 -1.1 5.1 1/12/2012 0 6.1 -1.7 1.9 1/13/2012 0 5 -2.8 1.3 1/14/2012 0 16.1 1.7 4.3 1/15/2012 0 21.1 7.2 4.1 1/16/2012 0 20 6.1 2.1 1/17/2012 0 14.4 3.9 3 1/18/2012 0 18.3 4.4 4.3 1/19/2012 0 25.6 12.8 2.2 1/20/2012 0 18.9 13.9 2.8 1/21/2012 0 22.2 13.3 1.7
  • 10.
    Handling Outliers • Removal •Replacing values • Capping • Discretization • Binning #ISSLearningFest date precipitation temp_max temp_min wind 1/1/2012 0 12.8 5 4.7 1/2/2012 10.9 10.6 2.8 4.5 1/3/2012 0.8 11.7 7.2 2.3 1/4/2012 20.3 12.2 5.6 4.7 1/5/2012 1.3 8.9 2.8 6.1 1/6/2012 2.5 4.4 2.2 2.2 1/7/2012 0 7.2 2.8 2.3 1/8/2012 0 10 2.8 2 1/9/2012 4.3 9.4 5 3.4 1/10/2012 1 6.1 0.6 3.4 1/11/2012 0 6.1 -1.1 5.1 1/12/2012 0 6.1 -1.7 1.9 1/13/2012 0 5 -2.8 1.3 1/14/2012 0 16.1 1.7 4.3 1/15/2012 0 21.1 7.2 4.1 1/16/2012 0 20 6.1 2.1 1/17/2012 0 14.4 3.9 3 1/18/2012 0 18.3 4.4 4.3 1/19/2012 0 25.6 12.8 2.2 1/20/2012 0 18.9 13.9 2.8 1/21/2012 0 22.2 13.3 1.7 date precipitation temp_max temp_min wind 1/1/2012 0 12.8 5 4.7 1/2/2012 10.9 10.6 2.8 4.5 1/3/2012 0.8 11.7 7.2 2.3 1/4/2012 20.3 12.2 5.6 4.7 1/5/2012 1.3 8.9 2.8 6.1 1/6/2012 2.5 4.4 2.2 2.2 1/7/2012 0 7.2 2.8 2.3 1/8/2012 0 10 2.8 2 1/9/2012 4.3 9.4 5 3.4 1/10/2012 1 6.1 0.6 3.4 1/11/2012 0 6.1 -1.1 5.1 1/12/2012 0 6.1 -1.7 1.9 1/13/2012 0 5 -2.8 1.3 1/14/2012 0 16.1 1.7 4.3 1/15/2012 0 21.1 7.2 4.1 1/16/2012 0 20 6.1 2.1 1/17/2012 0 14.4 3.9 3 1/18/2012 0 18.3 4.4 4.3 1/19/2012 0 25.6 12.8 2.2 1/20/2012 0 18.9 13.9 2.8 1/21/2012 0 22.2 13.3 1.7
  • 11.
    Feature Selection • Selectfeatures that are highly correlated to target • Pick the most representative features from existing features • For selected features, look for sets of features that are highly correlated with each other • In each set, select feature with highest correlation to target • Use final selected features to train the model #ISSLearningFest date precipitation temp_max temp_min wind weather 1/1/2012 0 12.8 5 4.7 drizzle 1/2/2012 10.9 10.6 2.8 4.5 rain 1/3/2012 0.8 11.7 7.2 2.3 rain 1/4/2012 20.3 12.2 5.6 4.7 rain 1/5/2012 1.3 8.9 2.8 6.1 rain 1/6/2012 2.5 4.4 2.2 2.2 rain 1/7/2012 0 7.2 2.8 2.3 rain 1/8/2012 0 10 2.8 2 sun 1/9/2012 4.3 9.4 5 3.4 rain 1/10/2012 1 6.1 0.6 3.4 rain 1/11/2012 0 6.1 -1.1 5.1 sun 1/12/2012 0 6.1 -1.7 1.9 sun 1/13/2012 0 5 -2.8 1.3 sun 1/14/2012 0 16.1 1.7 4.3 sun 1/15/2012 0 21.1 7.2 4.1 sun 1/16/2012 0 20 6.1 2.1 sun 1/17/2012 0 14.4 3.9 3 sun 1/18/2012 0 18.3 4.4 4.3 sun 1/19/2012 0 25.6 12.8 2.2 drizzle 1/20/2012 0 18.9 13.9 2.8 drizzle 1/21/2012 0 22.2 13.3 1.7 drizzle Selected features implies state
  • 12.
    Pearson Correlation • Measureof the extend to which two random variables change in tandem • Value between -1 to +1 • -1 indicates strong negative linear correlation • 0 indicates no correlation • +1 indicates strong positive correlation #ISSLearningFest
  • 13.
  • 14.
    Feature Extraction • Analyseexisting features to generate new features • Dimension Reduction • Reducing a 4D/3D space  2D space #ISSLearningFest date precipitation temp_max temp_min wind weather 1/1/2012 0 12.8 5 4.7 drizzle 1/2/2012 10.9 10.6 2.8 4.5 rain 1/3/2012 0.8 11.7 7.2 2.3 rain 1/4/2012 20.3 12.2 5.6 4.7 rain 1/5/2012 1.3 8.9 2.8 6.1 rain 1/6/2012 2.5 4.4 2.2 2.2 rain 1/7/2012 0 7.2 2.8 2.3 rain 1/8/2012 0 10 2.8 2 sun 1/9/2012 4.3 9.4 5 3.4 rain 1/10/2012 1 6.1 0.6 3.4 rain 1/11/2012 0 6.1 -1.1 5.1 sun 1/12/2012 0 6.1 -1.7 1.9 sun 1/13/2012 0 5 -2.8 1.3 sun 1/14/2012 0 16.1 1.7 4.3 sun 1/15/2012 0 21.1 7.2 4.1 sun 1/16/2012 0 20 6.1 2.1 sun 1/17/2012 0 14.4 3.9 3 sun 1/18/2012 0 18.3 4.4 4.3 sun 1/19/2012 0 25.6 12.8 2.2 drizzle 1/20/2012 0 18.9 13.9 2.8 drizzle 1/21/2012 0 22.2 13.3 1.7 drizzle PCA Analysis precipitation temp_max weather 0 12.8 drizzle 10.9 10.6 rain 0.8 11.7 rain 20.3 12.2 rain 1.3 8.9 rain 2.5 4.4 rain 0 7.2 rain 0 10 sun 4.3 9.4 rain 1 6.1 rain 0 6.1 sun 0 6.1 sun 0 5 sun 0 16.1 sun 0 21.1 sun 0 20 sun 0 14.4 sun 0 18.3 sun 0 25.6 drizzle 0 18.9 drizzle 0 22.2 drizzle
  • 15.
    Feature Scaling • Differentscales in our dataset • Different techniques • Normalization: min-max scaling • Values in column bounded between fixed range 0 and 1 • Standardization: Z-score normalization • Values in column rescale to Gaussian distribution, i.e. show mean and variance • Standardization • Reduces each feature to similar scale for ease of comparison • Performed within each feature, not across features • Shift dataset to origin allows learning models to learn faster and better #ISSLearningFest date precipitation temp_max temp_min wind weather 1/1/2012 0 12.8 5 4.7 drizzle 1/2/2012 10.9 10.6 2.8 4.5 rain 1/3/2012 0.8 11.7 7.2 2.3 rain 1/4/2012 20.3 12.2 5.6 4.7 rain 1/5/2012 1.3 8.9 2.8 6.1 rain 1/6/2012 2.5 4.4 2.2 2.2 rain 1/7/2012 0 7.2 2.8 2.3 rain 1/8/2012 0 10 2.8 2 sun 1/9/2012 4.3 9.4 5 3.4 rain 1/10/2012 1 6.1 0.6 3.4 rain 1/11/2012 0 6.1 -1.1 5.1 sun 1/12/2012 0 6.1 -1.7 1.9 sun 1/13/2012 0 5 -2.8 1.3 sun 1/14/2012 0 16.1 1.7 4.3 sun 1/15/2012 0 21.1 7.2 4.1 sun 1/16/2012 0 20 6.1 2.1 sun 1/17/2012 0 14.4 3.9 3 sun 1/18/2012 0 18.3 4.4 4.3 sun 1/19/2012 0 25.6 12.8 2.2 drizzle 1/20/2012 0 18.9 13.9 2.8 drizzle 1/21/2012 0 22.2 13.3 1.7 drizzle Small scale
  • 16.
    Implementing ML algorithmfor IoT solution • Sampling • Split dataset into training dataset (80%) and test dataset (20%) • Build ML model • Put training dataset to ML algorithm for training • Output: Trained model/Predictor generated • Test ML model • Use test dataset passed to predictor/model • Evaluate model • determine the accuracy of our model #ISSLearningFest
  • 17.
    Summary • Data Cleaning •Impute missing values • Encode categorical features • Data Transformation • Transform and scale numerical variables • Feature Extraction • Perform discretization • Remove outliers • Feature selection • Perform feature extraction from date and time • Create new features from existing ones • Feature Iteration • Pump to ML algorithm to produce trained model #ISSLearningFest
  • 18.
    Give Us YourFeedback #ISSLearningFest Day 2 Programme
  • 19.
  • 20.