Downloaded 111 times
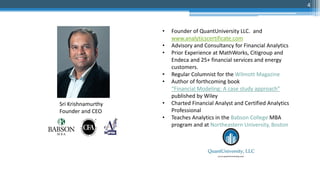

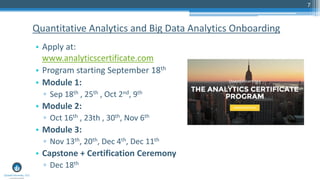
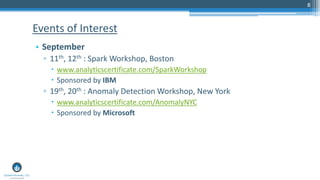


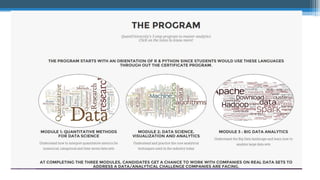
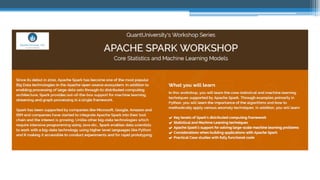
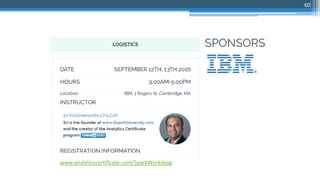

The document outlines a presentation by Sri Krishnamurthy at a QuantUniversity meetup in Boston on machine learning basics, focusing on analytics education and upcoming training programs. It covers essential topics such as data types, descriptive and predictive analytics, machine learning algorithms, and evaluation methods. Additionally, it promotes various workshops and courses related to analytics, starting in September 2016.