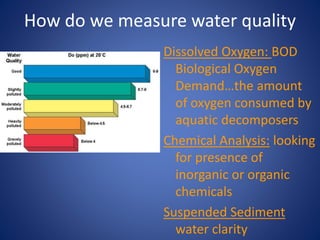
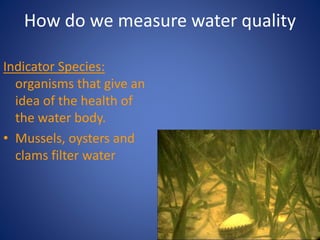
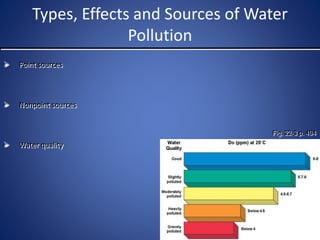
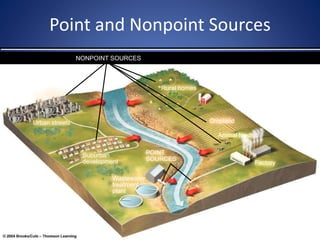
Downloaded 646 times
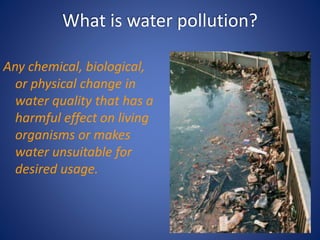
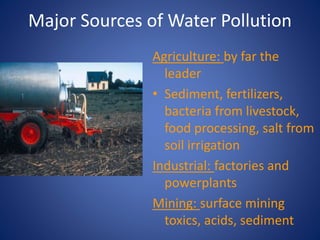
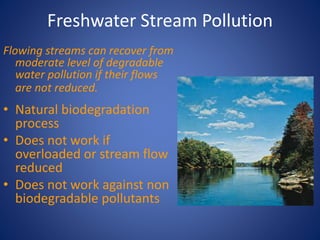
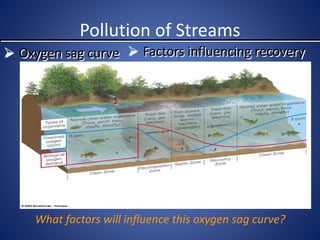
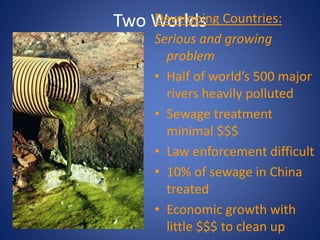
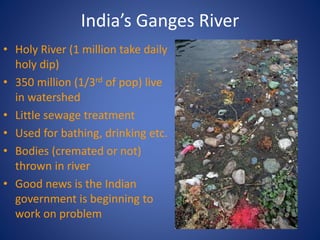
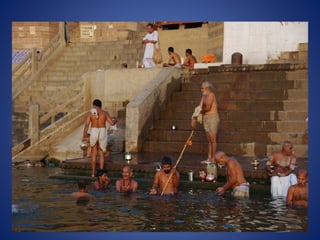
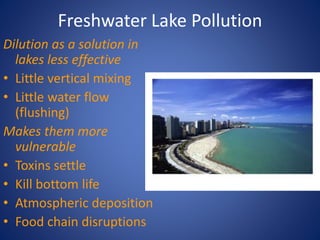
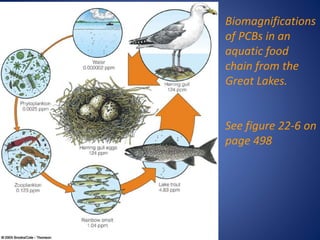
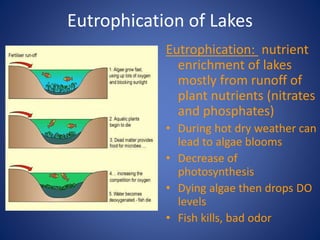
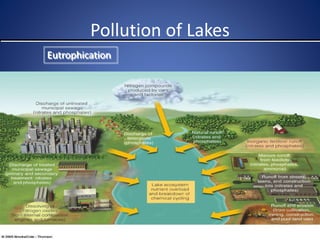
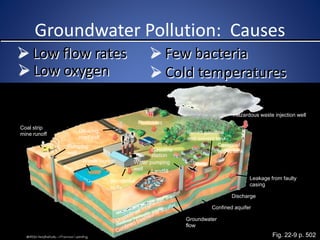
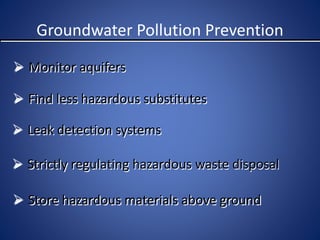
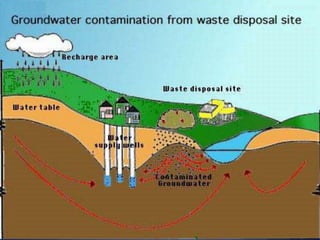
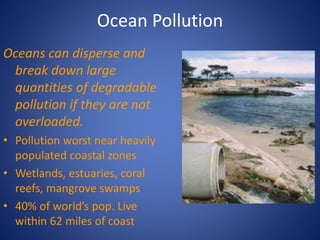
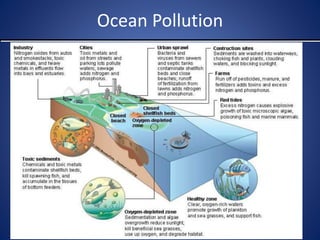
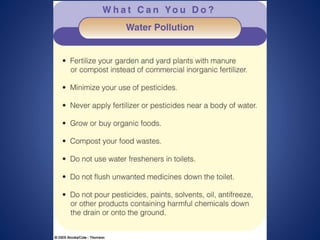


This presentation discusses various types and sources of water pollution. It defines water pollution as any change in water quality that harms living organisms or makes the water unsuitable for use. Major sources of water pollution include agriculture, industry, mining, urban and suburban runoff. The presentation covers how water pollution is measured, the differences between point and nonpoint sources, and the effects of pollution on freshwater streams, lakes, groundwater, and oceans. Key impacts include eutrophication of lakes from excess nutrients, and biomagnification of toxins up the aquatic food chain. Developing countries face serious water pollution problems from lack of sewage treatment and enforcement of environmental laws.


