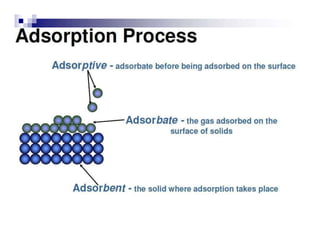
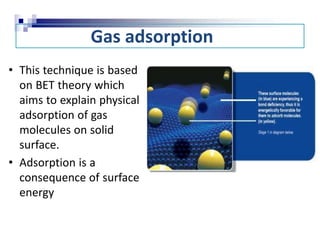
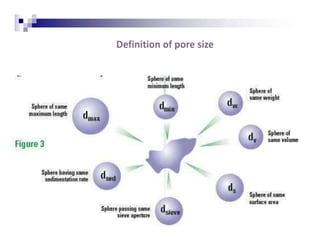
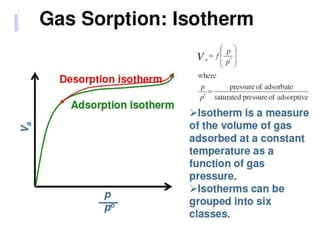
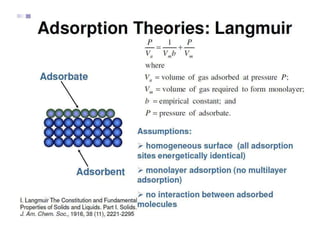
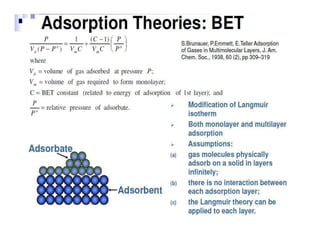
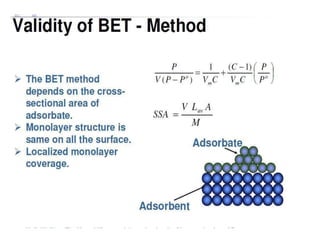
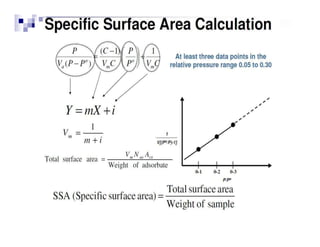
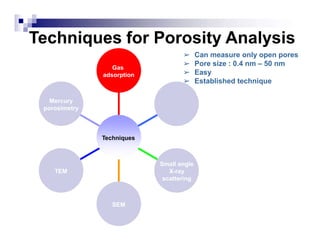
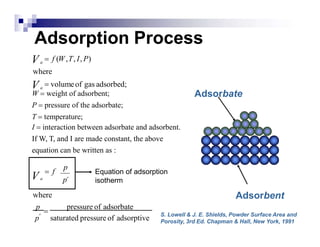
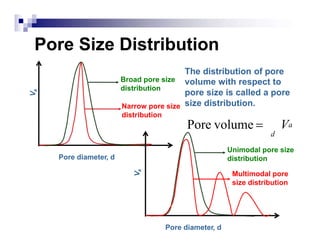
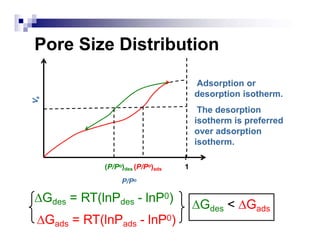
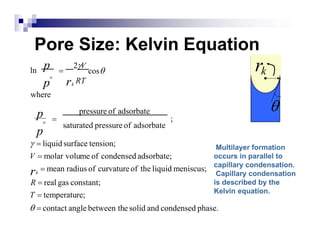
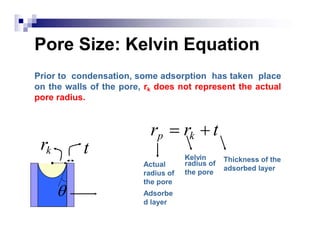
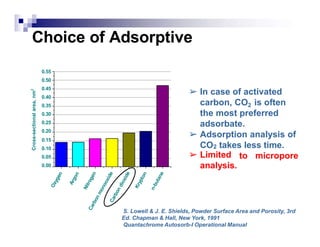
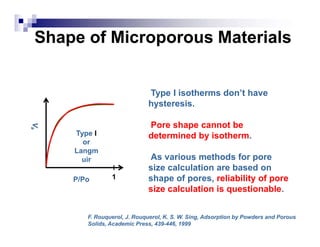
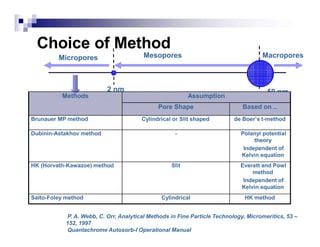
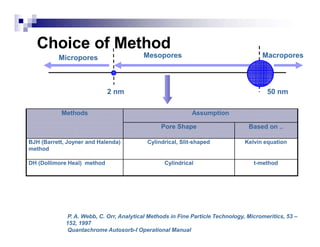
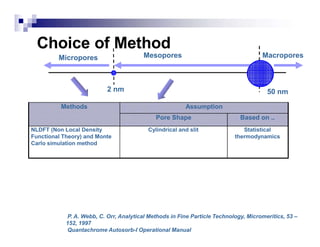
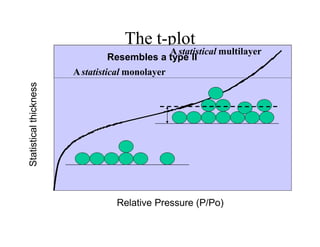
GAS ADSORPTION
TECHNIQUE
Gas adsorption
• This technique is based
on BET theory which
aims to explain physical
adsorption of gas
molecules on solid
surface.
• Adsorption is a
consequence of surface
energy
c
ov
er
ageofthesolid
Why BET is preferred?
Can measure only open pores
Pore size : 0.4 nm – 50 nm
Easy
Established technique
• Solid pretreated by applying heat, vacuum or
flowing gas to remove adsorbed contaminants
(water, CO2)
• Then solid cooled under vacuum usually to
cryogenic temperature(77k or -195 deg C)
• Specific dose of adsorptive gas( such as
nitrogen, argon, CO2 etc.) is passed on solid
surface on regular increments.
• After each dose of adsorbate , pressure is
allowed to equilibrate & quantity adsorbed is
calculated.
• The quantity adsorbed at each pressure
defines adsorption/sorption isotherm
• From this isotherm quantity of gas required
for monolayer formation is determined
• Then area covered by each adsorbed gas
molecule is known
• Finally surface area is determined.
• Using gas adsorption technique porosity and
pore size can also be calculated.
Main Characteristics of Powders
and Porous Solids
■ Particle size
■ Surface area
■ Porosity
Why We Care About Particle Size
and Surface Area
■ These characteristics control many properties of
materials:
□ Flowability;
□ “Filter-ability”
□ Viscosity-Reology;
□ Agglomeration;
□ Dusting tendency;
□ Settling rate;
□ Activity/Reactivity rate (e.g. of catalyst);
□ Dissolution rate (of pharmaceutical);
□ Gas absorption;
□ Hydration rate (of cement);
□ Moisture absorption;
□ Entry into lungs (shape dependency too);
□ Combustion rate (of fuel)
□ Etc…
What is Particle Size?
SEM of real ibuprofen particles
A Concept of Equivalent Sphere
■ Due to symmetry, size of sphere is
completely determined by only
one parameter – it’s diameter
(radius)
■ Other properties of sphere are
easily computed from its size:
■ Sphere is just a convenient model!
This is why it is found throughout the
particle size analysis
V 
1
d3
6
S  d 2
m 
 d
3
6
Particle Size Measurement
Techniques
■ Direct observation (image analysis)
■ Sieving;
■ Sedimentation – settling rate;
■ Coulter counter – electrozone sensing;
■ Gas adsorption – BET (SSA back extrapolation
to size);
■ Permeability (gas or liquid) e.g. Blaine, FSSS
■ Light scattering – laser diffraction and Photon
Correlation Spectroscopy / Dynamic Light
Scattering
Measurement of Porosity and
Specific Surface Area by
Gas Adsorption
Name 2 methods to measure
particle size
- Laser scattering
- Optical ( microscopy)
?
? ?
?
?
?
?
Porous materials have highly developed internal surface area that can be
used to perform specific function.
Almost all solids are porous except for ceramics fired at extremely high
temperatures
F. Rouquerol, J. Rouquerol, K. S. W. Sing, Adsorption by Powders and Porous Solids,
Academic Press, 1-25, 1999
What are Porous Materials?
Non-porous solid
➢ Low specific surface area
➢ Low specific pore volume
Porous solid
➢High specific surface area
➢High specific pore volume
Looking at the diagram, how
to tell if a particle is porous?
Porous if and only if value of
pore depth is larger than value
of pore width
?
? ?
?
?
?
?
Measure of Porosity
Pore size and
its distribution
Specific Surface Area, m2/g =
Porosity
There are three parameters used as a measure of porosity; specific surface
area, specific pore volume or porosity, and pore size and its distribution.
Mass of the solid, g
Porosity, % =
Volume of pores
Total surface area, m2
Specific Pore volume, cm3/g
Total pore volume, cm3
=
Mass of the solid, g
Volume of solid (including pores)
X 100
Concept of Porosity: Open vs.
Closed Pores
Dead end
(open)
Closed
Inter-connected
(open)
Passing
(open)
F. Rouquerol, J. Rouquerol, K. S. W. Sing, Adsorption by Powders and Porous
Solids, Academic Press, 1-25, 1999
Open pores are accessible
whereas closed pores are
inaccessible pores. Open pores
can be inter-connected, passing
or dead end.
Size of Pores (IUPAC Standard)
50 nm
Zeolite, Activated
carbon,
Metal organic
framework
2 nm
Micropores Mesopores Macropores
Mesoporous silica,
Activated carbon
Sintered metals
and ceramics
Porous material are classified according to the size of pores: material with
pores less than 2 nm are called micropores, materials with pores between 2
and 50 nm are called mesopores, and material with pores greater than 50 nm
are macrospores
Sing, K. S. W. et al. Reporting Physisorption Data for Gas/Solid Systems. Pure & Appl. Chem. 57,
603-619 (1985).
Shapes of Pores
Conical
Interstices
Slits
Cylindrical
Spherical or
Ink Bottle
Pore
Shapes
F. Rouquerol, J. Rouquerol, K. S. W. Sing, Adsorption by Powders and Porous Solids, Academic
Press, 1-25, 1999
Will pore size be the same as
particle size ?
Particle size measures external
cross-sectional diameter, while
pore size measures measures
mean internal pore diameter
?
? ?
?
?
?
?
Techniques for Porosity Analysis
Mercury
porosimetry
TEM
SEM
Small angle
X-ray
scattering
Small
Angle
Neutron
scattering
Gas
adsorption
Techniques
Mercury
porosimetry
TEM
SEM
Small angle
X-ray
scattering
Gas
adsorption
➢ Can measure only open pores
➢ Pore size : 0.4 nm – 50 nm
➢ Easy
➢ Established technique
Small Angle Neutron scattering
Techniques
Techniques for Porosity Analysis
Mercury
porosimetry
TEM
SEM
Small angle
X-ray
scattering
Small
Angle
Neutron
scattering
Gas
adsorption
Techniques
➢ Similar to gas
adsorption
➢ Can measure only
open pores
➢ Pore size >1.5 nm
➢ Easy
➢ Established technique
Techniques for Porosity Analysis
Mercury
porosimetry
TEM
SEM
Small angle
X-ray
scattering
Small
Angle
Neutron
scattering
Gas
adsorption
Techniques
➢ Provide information
regarding pore
connectivity
➢ Pore size can be
measured if the
materials contains
ordered pores
➢ Rarely used for pore
analysis
Techniques for Porosity Analysis
Mercury
porosimetry
TEM
SEM
Small angle
X-ray
scattering
Small
Angle
Neutron
scattering
Gas
adsorption
Techniques
➢ Pore size > 5nm
➢ Rarely used for pore
analysis
Techniques for Porosity Analysis
Mercury
porosimetry
TEM
SEM
Small angle
X-ray
scattering
Small
Angle
Neutron
scattering
Gas
adsorption
Techniques
➢ Any pore size
➢ Open + Close
porosity
Techniques for Porosity Analysis
Mercury
porosimetry
TEM
SEM
Small angle
X-ray
scattering
Small
Angle
Neutron
scattering
Gas
adsorption
Techniques
➢ Any pore size
➢ Open & Close
porosity
➢ Costly
Techniques for Porosity Analysis
Physisorption vs Chemisorption
http://www.soton.ac.uk
PHYSISORPTION CHEMISORPTION
WEAK, LONG RANGE BONDING
Van der Waals interactions
STRONG, SHORT RANGE BONDING
Chemical bonding involved.
NOT SURFACE SPECIFIC
Physisorption takes place between all molecules
on any surface providing the temperature is low
enough.
SURFACE SPECIFIC
E.g. Chemisorption of hydrogen
takes place on transition metals
but not on gold or mercury.
Hads = 5 ….. 50 kJ mol-1 Hads = 50 ….. 500 kJ mol-1
Non activated with equilibrium achieved
relatively quickly. Increasing temperature
always reduces surface coverage.
Can be activated, in which case equilibrium can
be slow and increasing temperature can favour
adsorption.
No surface reactions. Surface reactions may take place:- Dissociation,
reconstruction, catalysis.
MULTILAYER ADSORPTION
BET Isotherm used to model adsorption
equilibrium.
MONOLAYER ADSORPTION
Langmuir Isotherm is used to model adsorption
equilibrium.
Adsorption Process
Adsorbent
Adsorbate
p saturated pressure of adsorptive
p

pressure of adsorbate
where
W  weight of adsorbent;
P  pressure of the adsorbate;
T  temperature;
I  interaction between adsorbate and adsorbent.
If W, T, and I are made constant, the above
equation can be written as :
Va
 f (W,T, I, P)
where
Va
 volumeof gas adsorbed;
po
 f
p
o
Va
Equation of adsorption
isotherm
S. Lowell & J. E. Shields, Powder Surface Area and
Porosity, 3rd Ed. Chapman & Hall, New York, 1991
Gas Sorption: Hysteresis
Hysteresis indicates the presence of mesopores.
Hysteresis gives information regarding pore shapes .
Types I, II and III isotherms are generally reversible but type I
can have a hysteresis. Types IV and V exhibit hysteresis.
1
P/Po
Hysteresis
V
a
S. Lowell & J. E. Shields, Powder Surface Area and Porosity, 3rd Ed.
Chapman & Hall, New York, 1991
Gas Sorption: Hysteresis
V
a
1
P/Po
Cylindrical Slits
Type A Type B Type C Type D
1
P/Po 1
P/Po 1
P/Po
Type E
1
P/Po
Conical Bottle neck
Single Point BET
Single-point method offers the advantage of simplicity and
speed, often with little loss in accuracy.
V V 
1 P P 
o
m a i.e. V = 1/slope
m
A relative pressure of 0.3 gives good general agreement with the
multi-point method.
➢Correction of single point “error” at P/P0 = 0.3 by multiplying the
single point BET value by C/C-2 decreases the difference.
Sample
No.
Multi-point
BET
(m2/g)
Uncorrected
single-point
(m2/g)
Uncorrected
difference (%)
Corrected
single –
point (m2/g)
Corrected
difference
(%)
1 4.923 4.241 -13.9 4.948 0.51
2 4.286 3.664 -14.5 4.275 -0.26
3 8.056 6.867 -14.8 8.011 -0.56
4 5.957 5.194 -12.8 6.060 +1.73
Pore Size Distribution
V
a
Pore diameter, d
Narrow pore size
distribution
Broad pore size
distribution
Unimodal pore size
distribution
Pore diameter, d
Multimodal pore
size distribution
The distribution of pore
volume with respect to
pore size is called a pore
size distribution.
V
a
Pore volume  V
d
a
Pore Size Distribution
Gdes = RT(lnPdes - lnP0)
Gads = RT(lnPads - lnP0)
Gdes < Gads
1
(P/Po)des (P/Po)ads
P/Po
Adsorption or
desorption isotherm.
The desorption
isotherm is preferred
over adsorption
isotherm.
V
a
Pore Size: Kelvin Equation
Multilayer formation
occurs in parallel to
capillary condensation.
Capillary condensation
is described by the
Kelvin equation.
  contact angle between the solid and condensed phase.
R  real gas constant;
T  temperature;
 mean radius of curvatureof the liquid meniscus;
  liquid surface tension;
V  molar volume of condensed adsorbate;
pressure of adsorbate
 ;
saturated pressure of adsorbate
where
cos
2V
ln
p
p

o
p
p rk
RT
rk
o

k
r
Pore Size: Kelvin Equation
rp  rk  t
Kelvin
Actual
radius of
the pore
Adsorbe
d layer
radius of
the pore
Thickness of the
adsorbed layer
Prior to condensation, some adsorption has taken place
on the walls of the pore, rk does not represent the actual
pore radius.

t
rk
Methods for Calculation of
Pore Size Distribution
BJH (Barrett, Joyner and
Halenda) method
DH (Dollimore Heal) method
Dubinin-Astakhov method
HK (Horvath-Kawazoe) method
Saito-Foley method
Mesoporous solids
Microporous solids
NLDFT (Non Local Density
Functional Theory) and Monte
Carlo simulation method
Microporous and
Mesoporous solids
Interpretation
Weight of sample
Pore shape
Specific
surface area
Pore volume
Pore size
&
distribution
Results
Points P/Po Volume
adsorbed
1
2
3
Common Adsorbates
Gas Temperature Cross sectional
area (nm2)
N2 ➢ -195.8 oC (liquid nitrogen)
➢ -183 oC (liquid argon).
0.162
Ar ➢ -183 oC (liquid argon).
➢ -195.8 oC (liquid nitrogen)
0.142
CO2 -78 oC, -25 oC, 0 oC 0.195
CO ➢ -183 oC (liquid argon) 0.163
Kr ➢ -195.8 oC (liquid nitrogen) 0.205
O2 ➢ -183 oC (liquid argon) 0.141
C4H10 ➢ 0 oC, 25 oC 0.469
Choice of Adsorptive
➢ N2(g) in N2(l) is the most
commonly used
adsorbate.
➢ Not completely inert.
➢ Dipole movement and
thus can have
localized adsorption.
➢ Cross-sectional area of
0.162 nm2 is questionable.
S. Lowell & J. E. Shields, Powder Surface Area and Porosity, 3rd
Ed. Chapman & Hall, New York, 1991
Quantachrome Autosorb-I Operational Manual
0.55
0.50
0.45
0.40
0.35
0.30
0.25
0.20
0.15
0.10
0.05
0.00
Cross-sectional
area,
nm
2
0.55
0.50
0.45
0.40
0.35
0.30
0.25
0.20
0.15
0.10
0.05
0.00
Cross-sectional
area,
nm
2
Choice of Adsorptive
S. Lowell & J. E. Shields, Powder Surface Area and Porosity, 3rd
Ed. Chapman & Hall, New York, 1991
Quantachrome Autosorb-I Operational Manual
➢ Ar(g) in Ar(l) is preferable
but because of
unavailability of Ar(l) (87K),
N2(l) (77 K) is used.
➢ Ar can reach to somewhat
smaller pores than N2.
➢ Accurate measurement of
micropores is possible
using Ar.
0.55
0.50
0.45
0.40
0.35
0.30
0.25
0.20
0.15
0.10
0.05
0.00
Cross-sectional
area,
nm
2
Choice of Adsorptive
S. Lowell & J. E. Shields, Powder Surface Area and Porosity, 3rd
Ed. Chapman & Hall, New York, 1991
Quantachrome Autosorb-I Operational Manual
➢ In case of activated
carbon, CO2 is often
the most preferred
adsorbate.
➢ Adsorption analysis of
CO takes less time.
2
➢ Limited
analysis.
to micropore
Shape of Microporous Materials
V
a
1
P/Po
Type I
or
Langm
uir
Type I isotherms don’t have
hysteresis.
Pore shape cannot be
determined by isotherm.
As various methods for pore
size calculation are based on
shape of pores, reliability of pore
size calculation is questionable.
F. Rouquerol, J. Rouquerol, K. S. W. Sing, Adsorption by Powders and Porous
Solids, Academic Press, 439-446, 1999
2 nm 50 nm
Micropores Mesopores Macropores
Choice of Method
P. A. Webb, C. Orr, Analytical Methods in Fine Particle Technology, Micromeritics, 53 –
152, 1997
Quantachrome Autosorb-I Operational Manual
Methods Assumption
Pore Shape Based on ..
Brunauer MP method Cylindrical or Slit shaped de Boer’s t-method
Dubinin-Astakhov method - Polanyi potential
theory
Independent of
Kelvin equation
HK (Horvath-Kawazoe) method Slit Everett and Powl
method
Independent of
Kelvin equation
Saito-Foley method Cylindrical HK method
2 nm 50 nm
Micropores Mesopores Macropores
Choice of Method
P. A. Webb, C. Orr, Analytical Methods in Fine Particle Technology, Micromeritics, 53 –
152, 1997
Quantachrome Autosorb-I Operational Manual
Methods Assumption
Pore Shape Based on ..
BJH (Barrett, Joyner and Halenda)
method
Cylindrical, Slit-shaped Kelvin equation
DH (Dollimore Heal) method Cylindrical t-method
2 nm 50 nm
Micropores Mesopores Macropores
Choice of Method
P. A. Webb, C. Orr, Analytical Methods in Fine Particle Technology, Micromeritics, 53 –
152, 1997
Quantachrome Autosorb-I Operational Manual
Methods Assumption
Pore Shape Based on ..
NLDFT (Non Local Density
Functional Theory) and Monte
Carlo simulation method
Cylindrical and slit Statistical
thermodynamics
Physisorption
Methods and Techniques
Micro and Mesopore Size
Determination by Gas Sorption
First: Quantitative estimation of
micropore volume and area…
T-plot and DR methods.
Multilayer adsorption
Type II, IV
Relative Pressure (P/Po)
Volume
adsorbed
After the knee,
micropores cease to
contribute to the
adsorption process.
Low slope region in middle of
isotherm indicates first few
multilayers, on external surface
including meso and macropores…
before the onset of capillary
condensation
Estimation of Micropores...
the t-plot method
This method uses a mathematical representation of
multi-layer adsorption. The thickness, t, of an
adsorbate layer increases with increasing pressure.
The t-curve so produced is very similar in
appearance to a type II isotherm. For every value of
P/Po, the volume adsorbed is plotted against the
corresponding value of “t”.
If the model describes the experimental data a
straight line is produced on the t-plot...
The t-plot
Resembles a type II
Relative Pressure (P/Po)
Statistical
thickness
Astatistical multilayer
Astatistical monolayer
t-plot Method
(mesoporous only)
1 2 3 4
t ( )
5 6 7
Slope = V/t = A
t-plot Method
showing a “knee”
SlopeA- slope B = area contribution by micropores size C
1 2 3 4
t ( )
5 6 7
X
X
X
X
X
X
X
C
A
B
A
C
B
What is an s plot?
s (for Ken Sing) is a
comparison plot like the t-plot
but its slope does not give area
directly.
?
? ?
?
?
?
?
Estimation of Micropores
Dubinin-Radushkevich (DR) Theory
2 P0
W  W exp  B log
T
P
2
0

W = volume of the liquid adsorbate
W0 = total volume of the micropores
B = adsorbent constant
 = adsorbate constant
Alinear relationship should be found between log(W) and log2(Po/P)...
Log2(Po/P)
Log
(W)
Extrapolation
yields Wo
Estimation of Micropores
Dubinin-Radushkevich (DR) Plot
0
Pore Size Determination
Requires a recognition and
understanding of different basic
isotherm types.
t-plot Method
(in the presence of micropores)
1 2 3 4
t ( )
5 6 7
Intercept = micropore volume
Why pseudo Langmuir?
Langmuir applies to monolayer
limit, not volume filling limit.
?
? ?
?
?
?
?
Gas adsorption vkj 23rd august

Gas adsorption vkj 23rd august

  • 1.
  • 3.
    Gas adsorption • Thistechnique is based on BET theory which aims to explain physical adsorption of gas molecules on solid surface. • Adsorption is a consequence of surface energy
  • 9.
  • 14.
    Why BET ispreferred? Can measure only open pores Pore size : 0.4 nm – 50 nm Easy Established technique
  • 15.
    • Solid pretreatedby applying heat, vacuum or flowing gas to remove adsorbed contaminants (water, CO2) • Then solid cooled under vacuum usually to cryogenic temperature(77k or -195 deg C) • Specific dose of adsorptive gas( such as nitrogen, argon, CO2 etc.) is passed on solid surface on regular increments.
  • 17.
    • After eachdose of adsorbate , pressure is allowed to equilibrate & quantity adsorbed is calculated. • The quantity adsorbed at each pressure defines adsorption/sorption isotherm
  • 19.
    • From thisisotherm quantity of gas required for monolayer formation is determined • Then area covered by each adsorbed gas molecule is known • Finally surface area is determined. • Using gas adsorption technique porosity and pore size can also be calculated.
  • 20.
    Main Characteristics ofPowders and Porous Solids ■ Particle size ■ Surface area ■ Porosity
  • 21.
    Why We CareAbout Particle Size and Surface Area ■ These characteristics control many properties of materials: □ Flowability; □ “Filter-ability” □ Viscosity-Reology; □ Agglomeration; □ Dusting tendency; □ Settling rate; □ Activity/Reactivity rate (e.g. of catalyst); □ Dissolution rate (of pharmaceutical); □ Gas absorption; □ Hydration rate (of cement); □ Moisture absorption; □ Entry into lungs (shape dependency too); □ Combustion rate (of fuel) □ Etc…
  • 22.
    What is ParticleSize? SEM of real ibuprofen particles
  • 23.
    A Concept ofEquivalent Sphere ■ Due to symmetry, size of sphere is completely determined by only one parameter – it’s diameter (radius) ■ Other properties of sphere are easily computed from its size: ■ Sphere is just a convenient model! This is why it is found throughout the particle size analysis V  1 d3 6 S  d 2 m   d 3 6
  • 24.
    Particle Size Measurement Techniques ■Direct observation (image analysis) ■ Sieving; ■ Sedimentation – settling rate; ■ Coulter counter – electrozone sensing; ■ Gas adsorption – BET (SSA back extrapolation to size); ■ Permeability (gas or liquid) e.g. Blaine, FSSS ■ Light scattering – laser diffraction and Photon Correlation Spectroscopy / Dynamic Light Scattering
  • 25.
    Measurement of Porosityand Specific Surface Area by Gas Adsorption
  • 26.
    Name 2 methodsto measure particle size - Laser scattering - Optical ( microscopy) ? ? ? ? ? ? ?
  • 27.
    Porous materials havehighly developed internal surface area that can be used to perform specific function. Almost all solids are porous except for ceramics fired at extremely high temperatures F. Rouquerol, J. Rouquerol, K. S. W. Sing, Adsorption by Powders and Porous Solids, Academic Press, 1-25, 1999 What are Porous Materials? Non-porous solid ➢ Low specific surface area ➢ Low specific pore volume Porous solid ➢High specific surface area ➢High specific pore volume
  • 28.
    Looking at thediagram, how to tell if a particle is porous? Porous if and only if value of pore depth is larger than value of pore width ? ? ? ? ? ? ?
  • 29.
    Measure of Porosity Poresize and its distribution Specific Surface Area, m2/g = Porosity There are three parameters used as a measure of porosity; specific surface area, specific pore volume or porosity, and pore size and its distribution. Mass of the solid, g Porosity, % = Volume of pores Total surface area, m2 Specific Pore volume, cm3/g Total pore volume, cm3 = Mass of the solid, g Volume of solid (including pores) X 100
  • 30.
    Concept of Porosity:Open vs. Closed Pores Dead end (open) Closed Inter-connected (open) Passing (open) F. Rouquerol, J. Rouquerol, K. S. W. Sing, Adsorption by Powders and Porous Solids, Academic Press, 1-25, 1999 Open pores are accessible whereas closed pores are inaccessible pores. Open pores can be inter-connected, passing or dead end.
  • 31.
    Size of Pores(IUPAC Standard) 50 nm Zeolite, Activated carbon, Metal organic framework 2 nm Micropores Mesopores Macropores Mesoporous silica, Activated carbon Sintered metals and ceramics Porous material are classified according to the size of pores: material with pores less than 2 nm are called micropores, materials with pores between 2 and 50 nm are called mesopores, and material with pores greater than 50 nm are macrospores Sing, K. S. W. et al. Reporting Physisorption Data for Gas/Solid Systems. Pure & Appl. Chem. 57, 603-619 (1985).
  • 32.
    Shapes of Pores Conical Interstices Slits Cylindrical Sphericalor Ink Bottle Pore Shapes F. Rouquerol, J. Rouquerol, K. S. W. Sing, Adsorption by Powders and Porous Solids, Academic Press, 1-25, 1999
  • 33.
    Will pore sizebe the same as particle size ? Particle size measures external cross-sectional diameter, while pore size measures measures mean internal pore diameter ? ? ? ? ? ? ?
  • 34.
    Techniques for PorosityAnalysis Mercury porosimetry TEM SEM Small angle X-ray scattering Small Angle Neutron scattering Gas adsorption Techniques
  • 35.
    Mercury porosimetry TEM SEM Small angle X-ray scattering Gas adsorption ➢ Canmeasure only open pores ➢ Pore size : 0.4 nm – 50 nm ➢ Easy ➢ Established technique Small Angle Neutron scattering Techniques Techniques for Porosity Analysis
  • 36.
    Mercury porosimetry TEM SEM Small angle X-ray scattering Small Angle Neutron scattering Gas adsorption Techniques ➢ Similarto gas adsorption ➢ Can measure only open pores ➢ Pore size >1.5 nm ➢ Easy ➢ Established technique Techniques for Porosity Analysis
  • 37.
    Mercury porosimetry TEM SEM Small angle X-ray scattering Small Angle Neutron scattering Gas adsorption Techniques ➢ Provideinformation regarding pore connectivity ➢ Pore size can be measured if the materials contains ordered pores ➢ Rarely used for pore analysis Techniques for Porosity Analysis
  • 38.
  • 39.
  • 40.
  • 41.
    Physisorption vs Chemisorption http://www.soton.ac.uk PHYSISORPTIONCHEMISORPTION WEAK, LONG RANGE BONDING Van der Waals interactions STRONG, SHORT RANGE BONDING Chemical bonding involved. NOT SURFACE SPECIFIC Physisorption takes place between all molecules on any surface providing the temperature is low enough. SURFACE SPECIFIC E.g. Chemisorption of hydrogen takes place on transition metals but not on gold or mercury. Hads = 5 ….. 50 kJ mol-1 Hads = 50 ….. 500 kJ mol-1 Non activated with equilibrium achieved relatively quickly. Increasing temperature always reduces surface coverage. Can be activated, in which case equilibrium can be slow and increasing temperature can favour adsorption. No surface reactions. Surface reactions may take place:- Dissociation, reconstruction, catalysis. MULTILAYER ADSORPTION BET Isotherm used to model adsorption equilibrium. MONOLAYER ADSORPTION Langmuir Isotherm is used to model adsorption equilibrium.
  • 42.
    Adsorption Process Adsorbent Adsorbate p saturatedpressure of adsorptive p  pressure of adsorbate where W  weight of adsorbent; P  pressure of the adsorbate; T  temperature; I  interaction between adsorbate and adsorbent. If W, T, and I are made constant, the above equation can be written as : Va  f (W,T, I, P) where Va  volumeof gas adsorbed; po  f p o Va Equation of adsorption isotherm S. Lowell & J. E. Shields, Powder Surface Area and Porosity, 3rd Ed. Chapman & Hall, New York, 1991
  • 43.
    Gas Sorption: Hysteresis Hysteresisindicates the presence of mesopores. Hysteresis gives information regarding pore shapes . Types I, II and III isotherms are generally reversible but type I can have a hysteresis. Types IV and V exhibit hysteresis. 1 P/Po Hysteresis V a S. Lowell & J. E. Shields, Powder Surface Area and Porosity, 3rd Ed. Chapman & Hall, New York, 1991
  • 44.
    Gas Sorption: Hysteresis V a 1 P/Po CylindricalSlits Type A Type B Type C Type D 1 P/Po 1 P/Po 1 P/Po Type E 1 P/Po Conical Bottle neck
  • 45.
    Single Point BET Single-pointmethod offers the advantage of simplicity and speed, often with little loss in accuracy. V V  1 P P  o m a i.e. V = 1/slope m A relative pressure of 0.3 gives good general agreement with the multi-point method. ➢Correction of single point “error” at P/P0 = 0.3 by multiplying the single point BET value by C/C-2 decreases the difference. Sample No. Multi-point BET (m2/g) Uncorrected single-point (m2/g) Uncorrected difference (%) Corrected single – point (m2/g) Corrected difference (%) 1 4.923 4.241 -13.9 4.948 0.51 2 4.286 3.664 -14.5 4.275 -0.26 3 8.056 6.867 -14.8 8.011 -0.56 4 5.957 5.194 -12.8 6.060 +1.73
  • 46.
    Pore Size Distribution V a Porediameter, d Narrow pore size distribution Broad pore size distribution Unimodal pore size distribution Pore diameter, d Multimodal pore size distribution The distribution of pore volume with respect to pore size is called a pore size distribution. V a Pore volume  V d a
  • 47.
    Pore Size Distribution Gdes= RT(lnPdes - lnP0) Gads = RT(lnPads - lnP0) Gdes < Gads 1 (P/Po)des (P/Po)ads P/Po Adsorption or desorption isotherm. The desorption isotherm is preferred over adsorption isotherm. V a
  • 48.
    Pore Size: KelvinEquation Multilayer formation occurs in parallel to capillary condensation. Capillary condensation is described by the Kelvin equation.   contact angle between the solid and condensed phase. R  real gas constant; T  temperature;  mean radius of curvatureof the liquid meniscus;   liquid surface tension; V  molar volume of condensed adsorbate; pressure of adsorbate  ; saturated pressure of adsorbate where cos 2V ln p p  o p p rk RT rk o  k r
  • 49.
    Pore Size: KelvinEquation rp  rk  t Kelvin Actual radius of the pore Adsorbe d layer radius of the pore Thickness of the adsorbed layer Prior to condensation, some adsorption has taken place on the walls of the pore, rk does not represent the actual pore radius.  t rk
  • 50.
    Methods for Calculationof Pore Size Distribution BJH (Barrett, Joyner and Halenda) method DH (Dollimore Heal) method Dubinin-Astakhov method HK (Horvath-Kawazoe) method Saito-Foley method Mesoporous solids Microporous solids NLDFT (Non Local Density Functional Theory) and Monte Carlo simulation method Microporous and Mesoporous solids
  • 51.
    Interpretation Weight of sample Poreshape Specific surface area Pore volume Pore size & distribution Results Points P/Po Volume adsorbed 1 2 3
  • 52.
    Common Adsorbates Gas TemperatureCross sectional area (nm2) N2 ➢ -195.8 oC (liquid nitrogen) ➢ -183 oC (liquid argon). 0.162 Ar ➢ -183 oC (liquid argon). ➢ -195.8 oC (liquid nitrogen) 0.142 CO2 -78 oC, -25 oC, 0 oC 0.195 CO ➢ -183 oC (liquid argon) 0.163 Kr ➢ -195.8 oC (liquid nitrogen) 0.205 O2 ➢ -183 oC (liquid argon) 0.141 C4H10 ➢ 0 oC, 25 oC 0.469
  • 53.
    Choice of Adsorptive ➢N2(g) in N2(l) is the most commonly used adsorbate. ➢ Not completely inert. ➢ Dipole movement and thus can have localized adsorption. ➢ Cross-sectional area of 0.162 nm2 is questionable. S. Lowell & J. E. Shields, Powder Surface Area and Porosity, 3rd Ed. Chapman & Hall, New York, 1991 Quantachrome Autosorb-I Operational Manual 0.55 0.50 0.45 0.40 0.35 0.30 0.25 0.20 0.15 0.10 0.05 0.00 Cross-sectional area, nm 2
  • 54.
    0.55 0.50 0.45 0.40 0.35 0.30 0.25 0.20 0.15 0.10 0.05 0.00 Cross-sectional area, nm 2 Choice of Adsorptive S.Lowell & J. E. Shields, Powder Surface Area and Porosity, 3rd Ed. Chapman & Hall, New York, 1991 Quantachrome Autosorb-I Operational Manual ➢ Ar(g) in Ar(l) is preferable but because of unavailability of Ar(l) (87K), N2(l) (77 K) is used. ➢ Ar can reach to somewhat smaller pores than N2. ➢ Accurate measurement of micropores is possible using Ar.
  • 55.
    0.55 0.50 0.45 0.40 0.35 0.30 0.25 0.20 0.15 0.10 0.05 0.00 Cross-sectional area, nm 2 Choice of Adsorptive S.Lowell & J. E. Shields, Powder Surface Area and Porosity, 3rd Ed. Chapman & Hall, New York, 1991 Quantachrome Autosorb-I Operational Manual ➢ In case of activated carbon, CO2 is often the most preferred adsorbate. ➢ Adsorption analysis of CO takes less time. 2 ➢ Limited analysis. to micropore
  • 56.
    Shape of MicroporousMaterials V a 1 P/Po Type I or Langm uir Type I isotherms don’t have hysteresis. Pore shape cannot be determined by isotherm. As various methods for pore size calculation are based on shape of pores, reliability of pore size calculation is questionable. F. Rouquerol, J. Rouquerol, K. S. W. Sing, Adsorption by Powders and Porous Solids, Academic Press, 439-446, 1999
  • 57.
    2 nm 50nm Micropores Mesopores Macropores Choice of Method P. A. Webb, C. Orr, Analytical Methods in Fine Particle Technology, Micromeritics, 53 – 152, 1997 Quantachrome Autosorb-I Operational Manual Methods Assumption Pore Shape Based on .. Brunauer MP method Cylindrical or Slit shaped de Boer’s t-method Dubinin-Astakhov method - Polanyi potential theory Independent of Kelvin equation HK (Horvath-Kawazoe) method Slit Everett and Powl method Independent of Kelvin equation Saito-Foley method Cylindrical HK method
  • 58.
    2 nm 50nm Micropores Mesopores Macropores Choice of Method P. A. Webb, C. Orr, Analytical Methods in Fine Particle Technology, Micromeritics, 53 – 152, 1997 Quantachrome Autosorb-I Operational Manual Methods Assumption Pore Shape Based on .. BJH (Barrett, Joyner and Halenda) method Cylindrical, Slit-shaped Kelvin equation DH (Dollimore Heal) method Cylindrical t-method
  • 59.
    2 nm 50nm Micropores Mesopores Macropores Choice of Method P. A. Webb, C. Orr, Analytical Methods in Fine Particle Technology, Micromeritics, 53 – 152, 1997 Quantachrome Autosorb-I Operational Manual Methods Assumption Pore Shape Based on .. NLDFT (Non Local Density Functional Theory) and Monte Carlo simulation method Cylindrical and slit Statistical thermodynamics
  • 60.
  • 61.
    Micro and MesoporeSize Determination by Gas Sorption First: Quantitative estimation of micropore volume and area… T-plot and DR methods.
  • 62.
    Multilayer adsorption Type II,IV Relative Pressure (P/Po) Volume adsorbed After the knee, micropores cease to contribute to the adsorption process. Low slope region in middle of isotherm indicates first few multilayers, on external surface including meso and macropores… before the onset of capillary condensation
  • 63.
    Estimation of Micropores... thet-plot method This method uses a mathematical representation of multi-layer adsorption. The thickness, t, of an adsorbate layer increases with increasing pressure. The t-curve so produced is very similar in appearance to a type II isotherm. For every value of P/Po, the volume adsorbed is plotted against the corresponding value of “t”. If the model describes the experimental data a straight line is produced on the t-plot...
  • 64.
    The t-plot Resembles atype II Relative Pressure (P/Po) Statistical thickness Astatistical multilayer Astatistical monolayer
  • 65.
    t-plot Method (mesoporous only) 12 3 4 t ( ) 5 6 7 Slope = V/t = A
  • 66.
    t-plot Method showing a“knee” SlopeA- slope B = area contribution by micropores size C 1 2 3 4 t ( ) 5 6 7 X X X X X X X C A B A C B
  • 67.
    What is ans plot? s (for Ken Sing) is a comparison plot like the t-plot but its slope does not give area directly. ? ? ? ? ? ? ?
  • 68.
    Estimation of Micropores Dubinin-Radushkevich(DR) Theory 2 P0 W  W exp  B log T P 2 0  W = volume of the liquid adsorbate W0 = total volume of the micropores B = adsorbent constant  = adsorbate constant Alinear relationship should be found between log(W) and log2(Po/P)...
  • 69.
    Log2(Po/P) Log (W) Extrapolation yields Wo Estimation ofMicropores Dubinin-Radushkevich (DR) Plot 0
  • 70.
    Pore Size Determination Requiresa recognition and understanding of different basic isotherm types.
  • 71.
    t-plot Method (in thepresence of micropores) 1 2 3 4 t ( ) 5 6 7 Intercept = micropore volume
  • 72.
    Why pseudo Langmuir? Langmuirapplies to monolayer limit, not volume filling limit. ? ? ? ? ? ? ?