Download to read offline


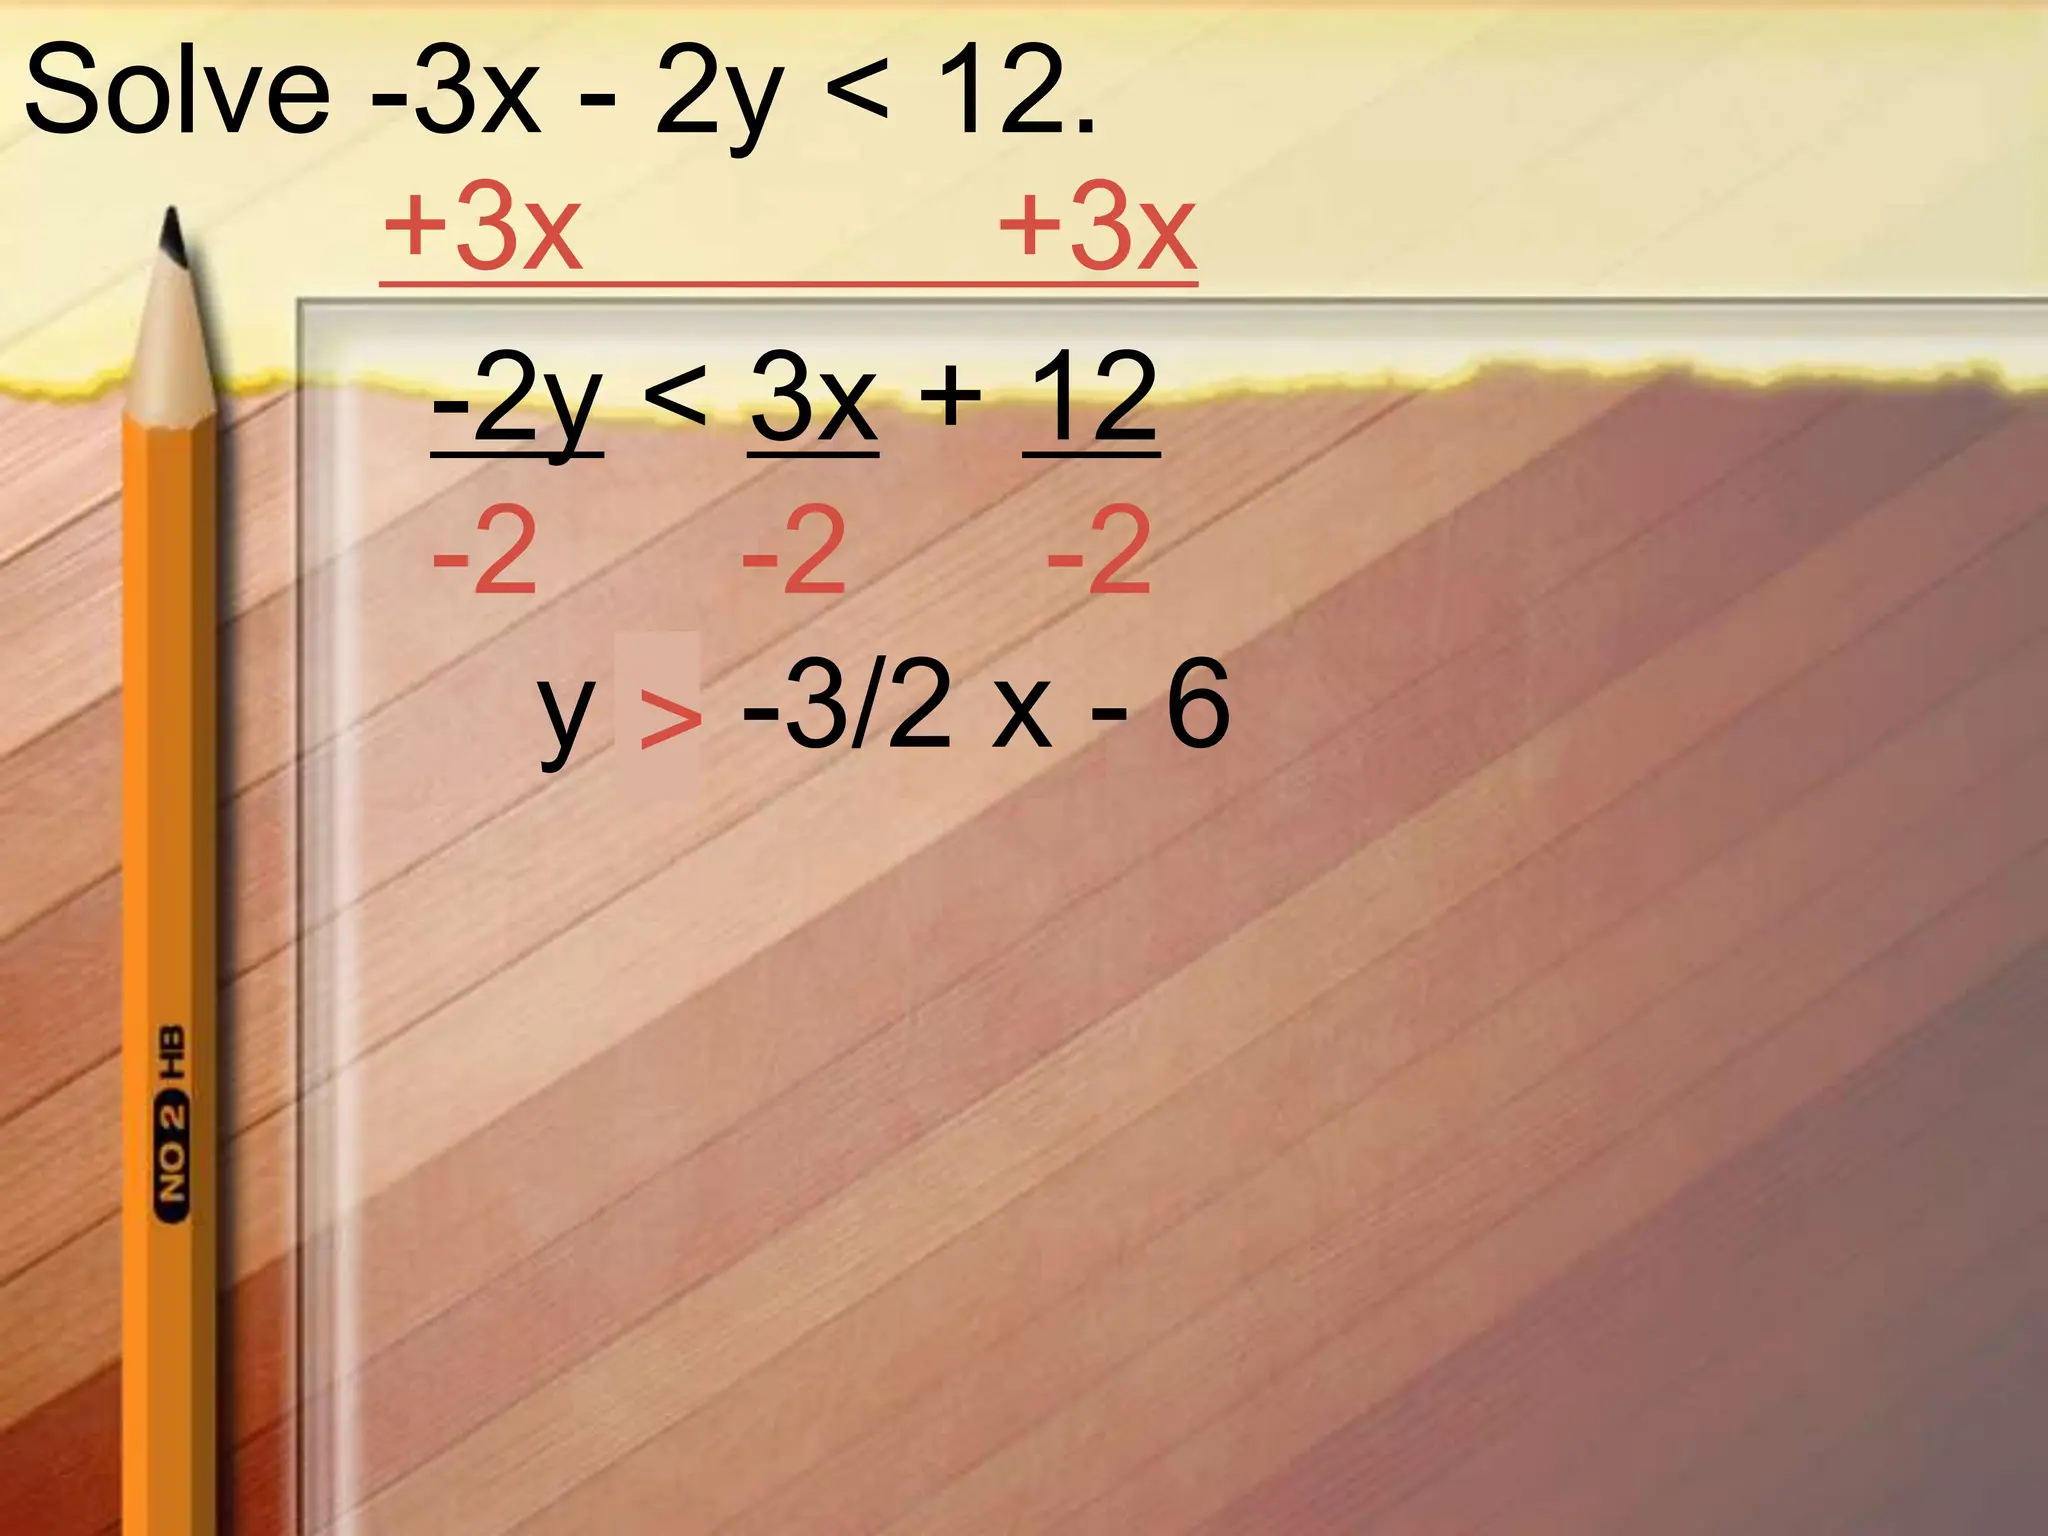
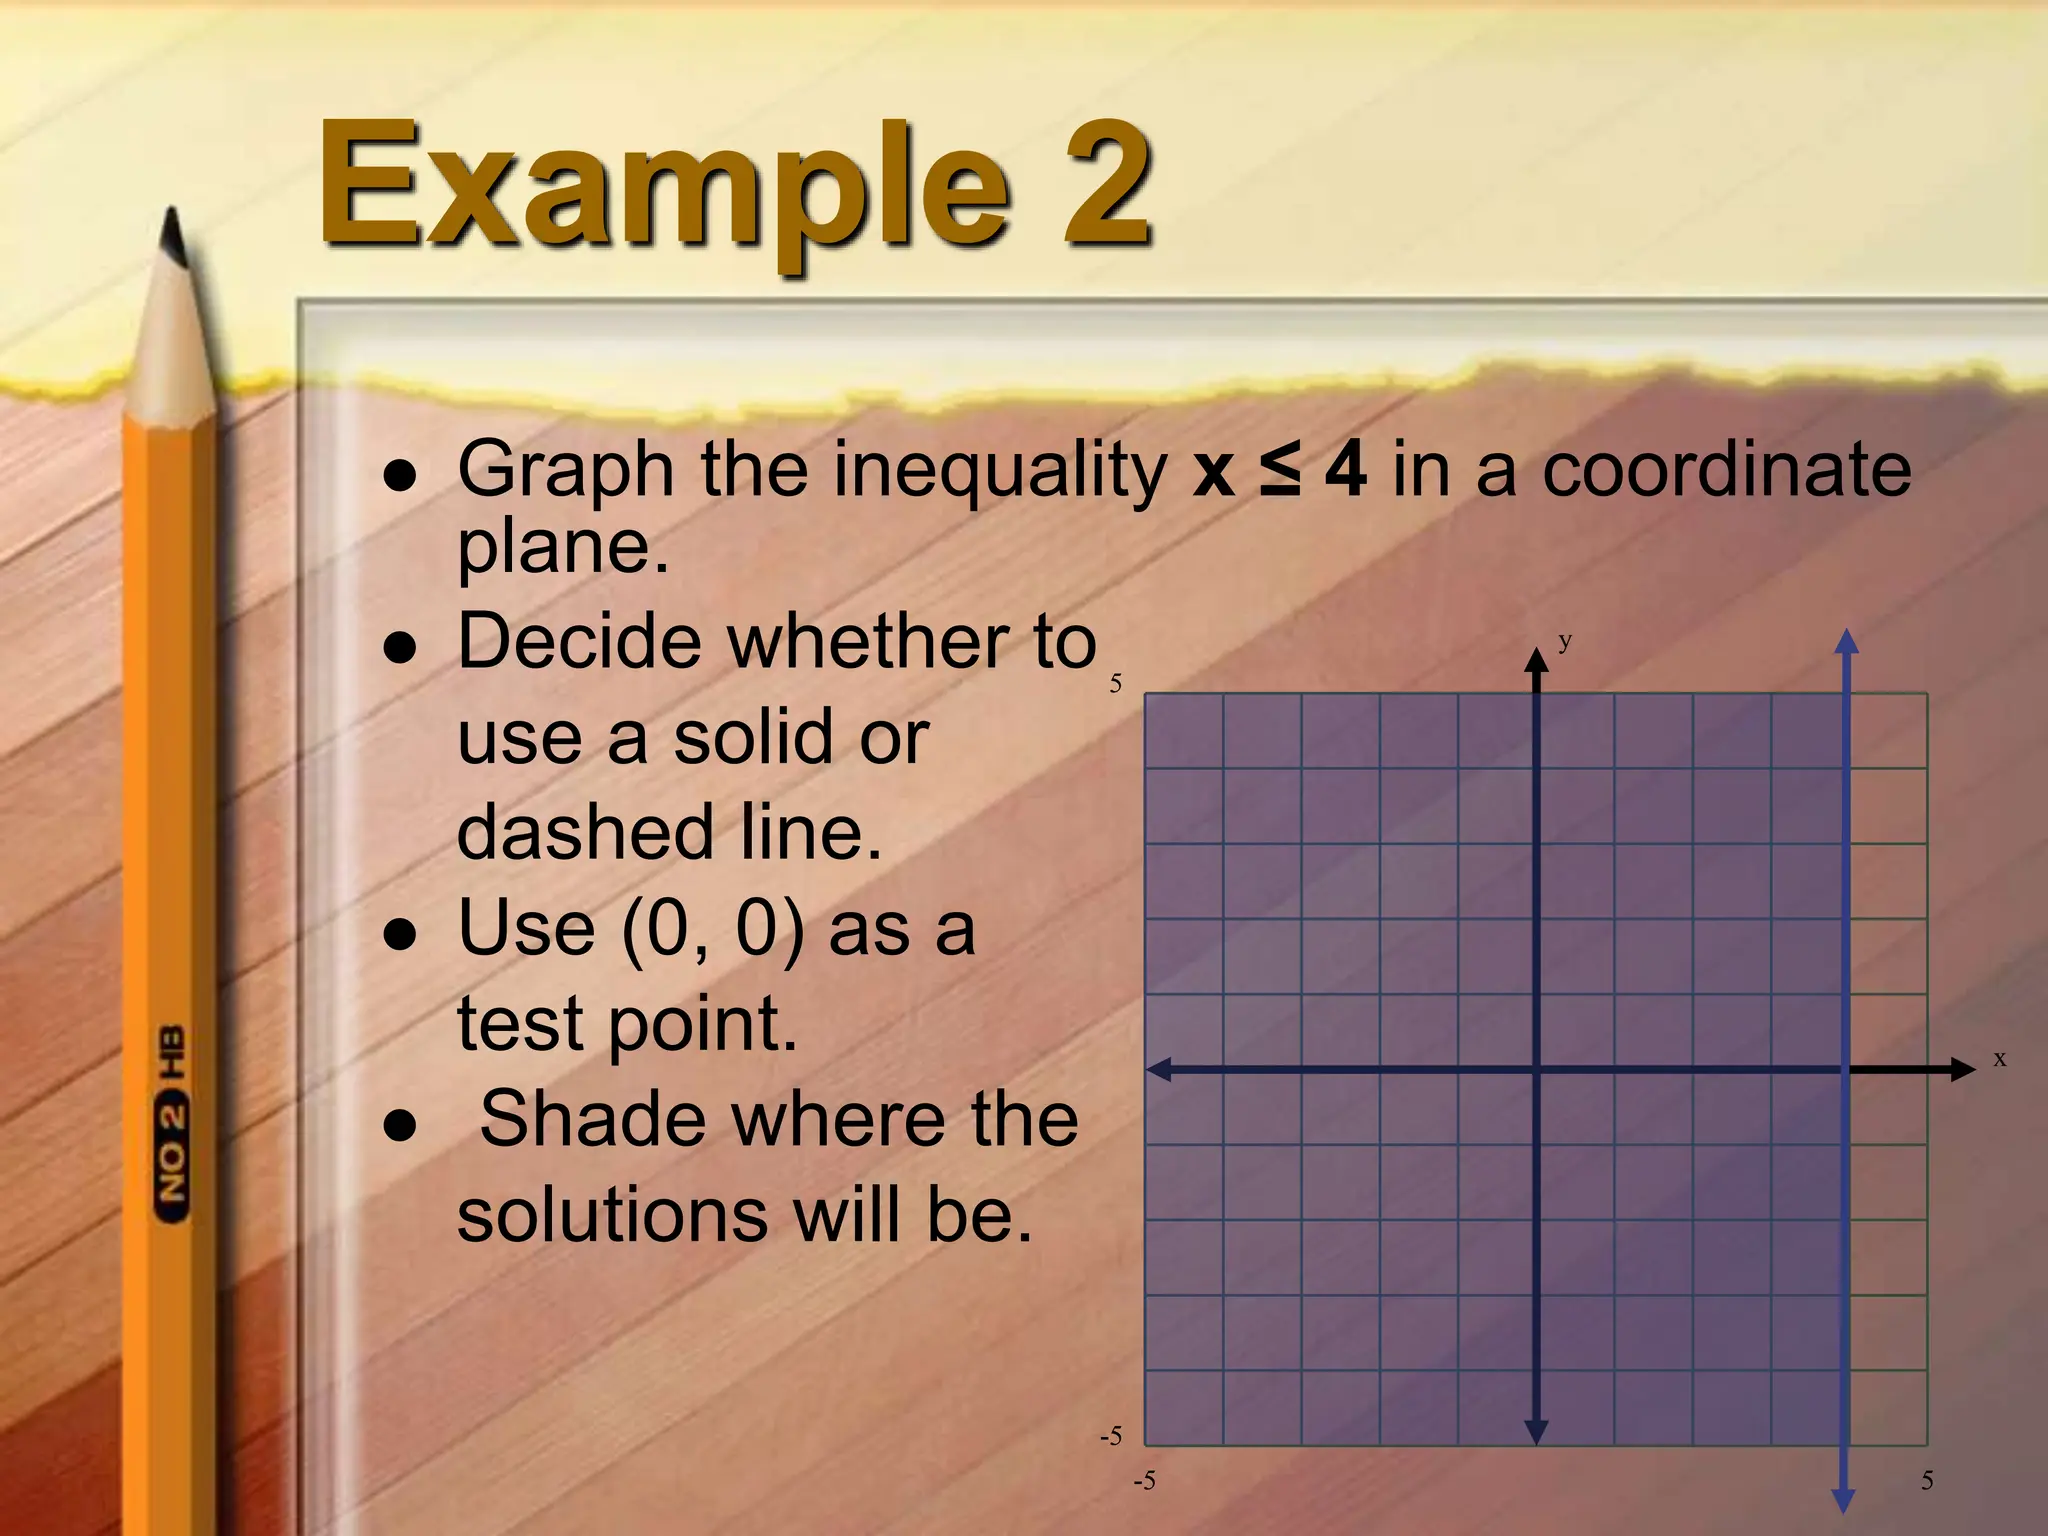
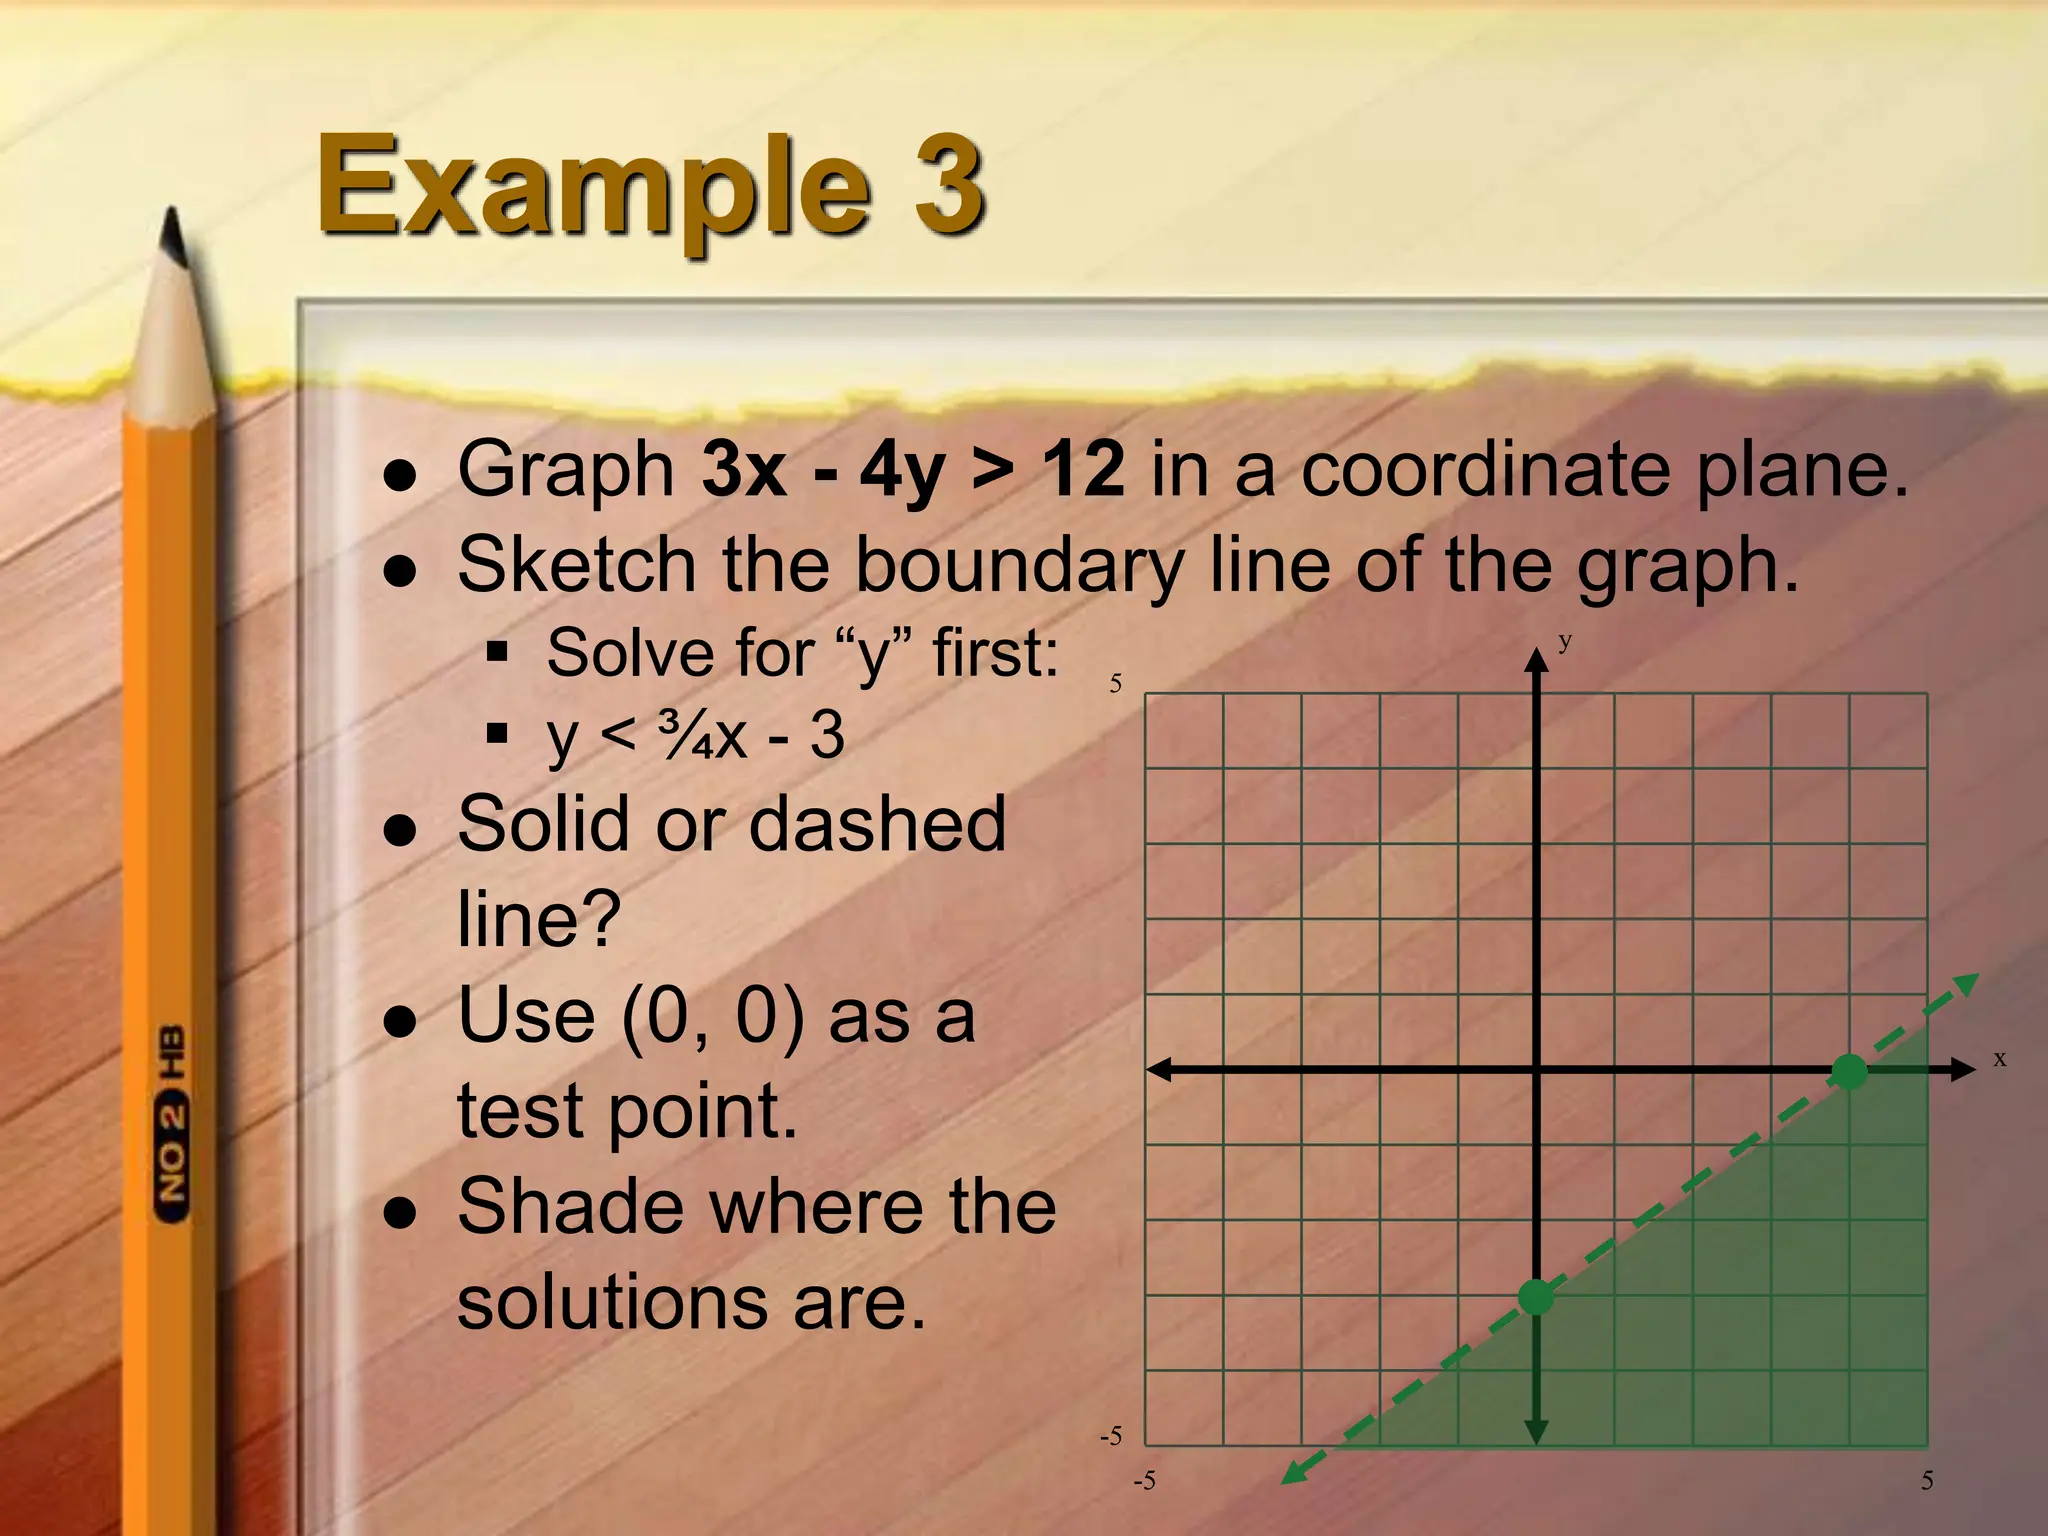
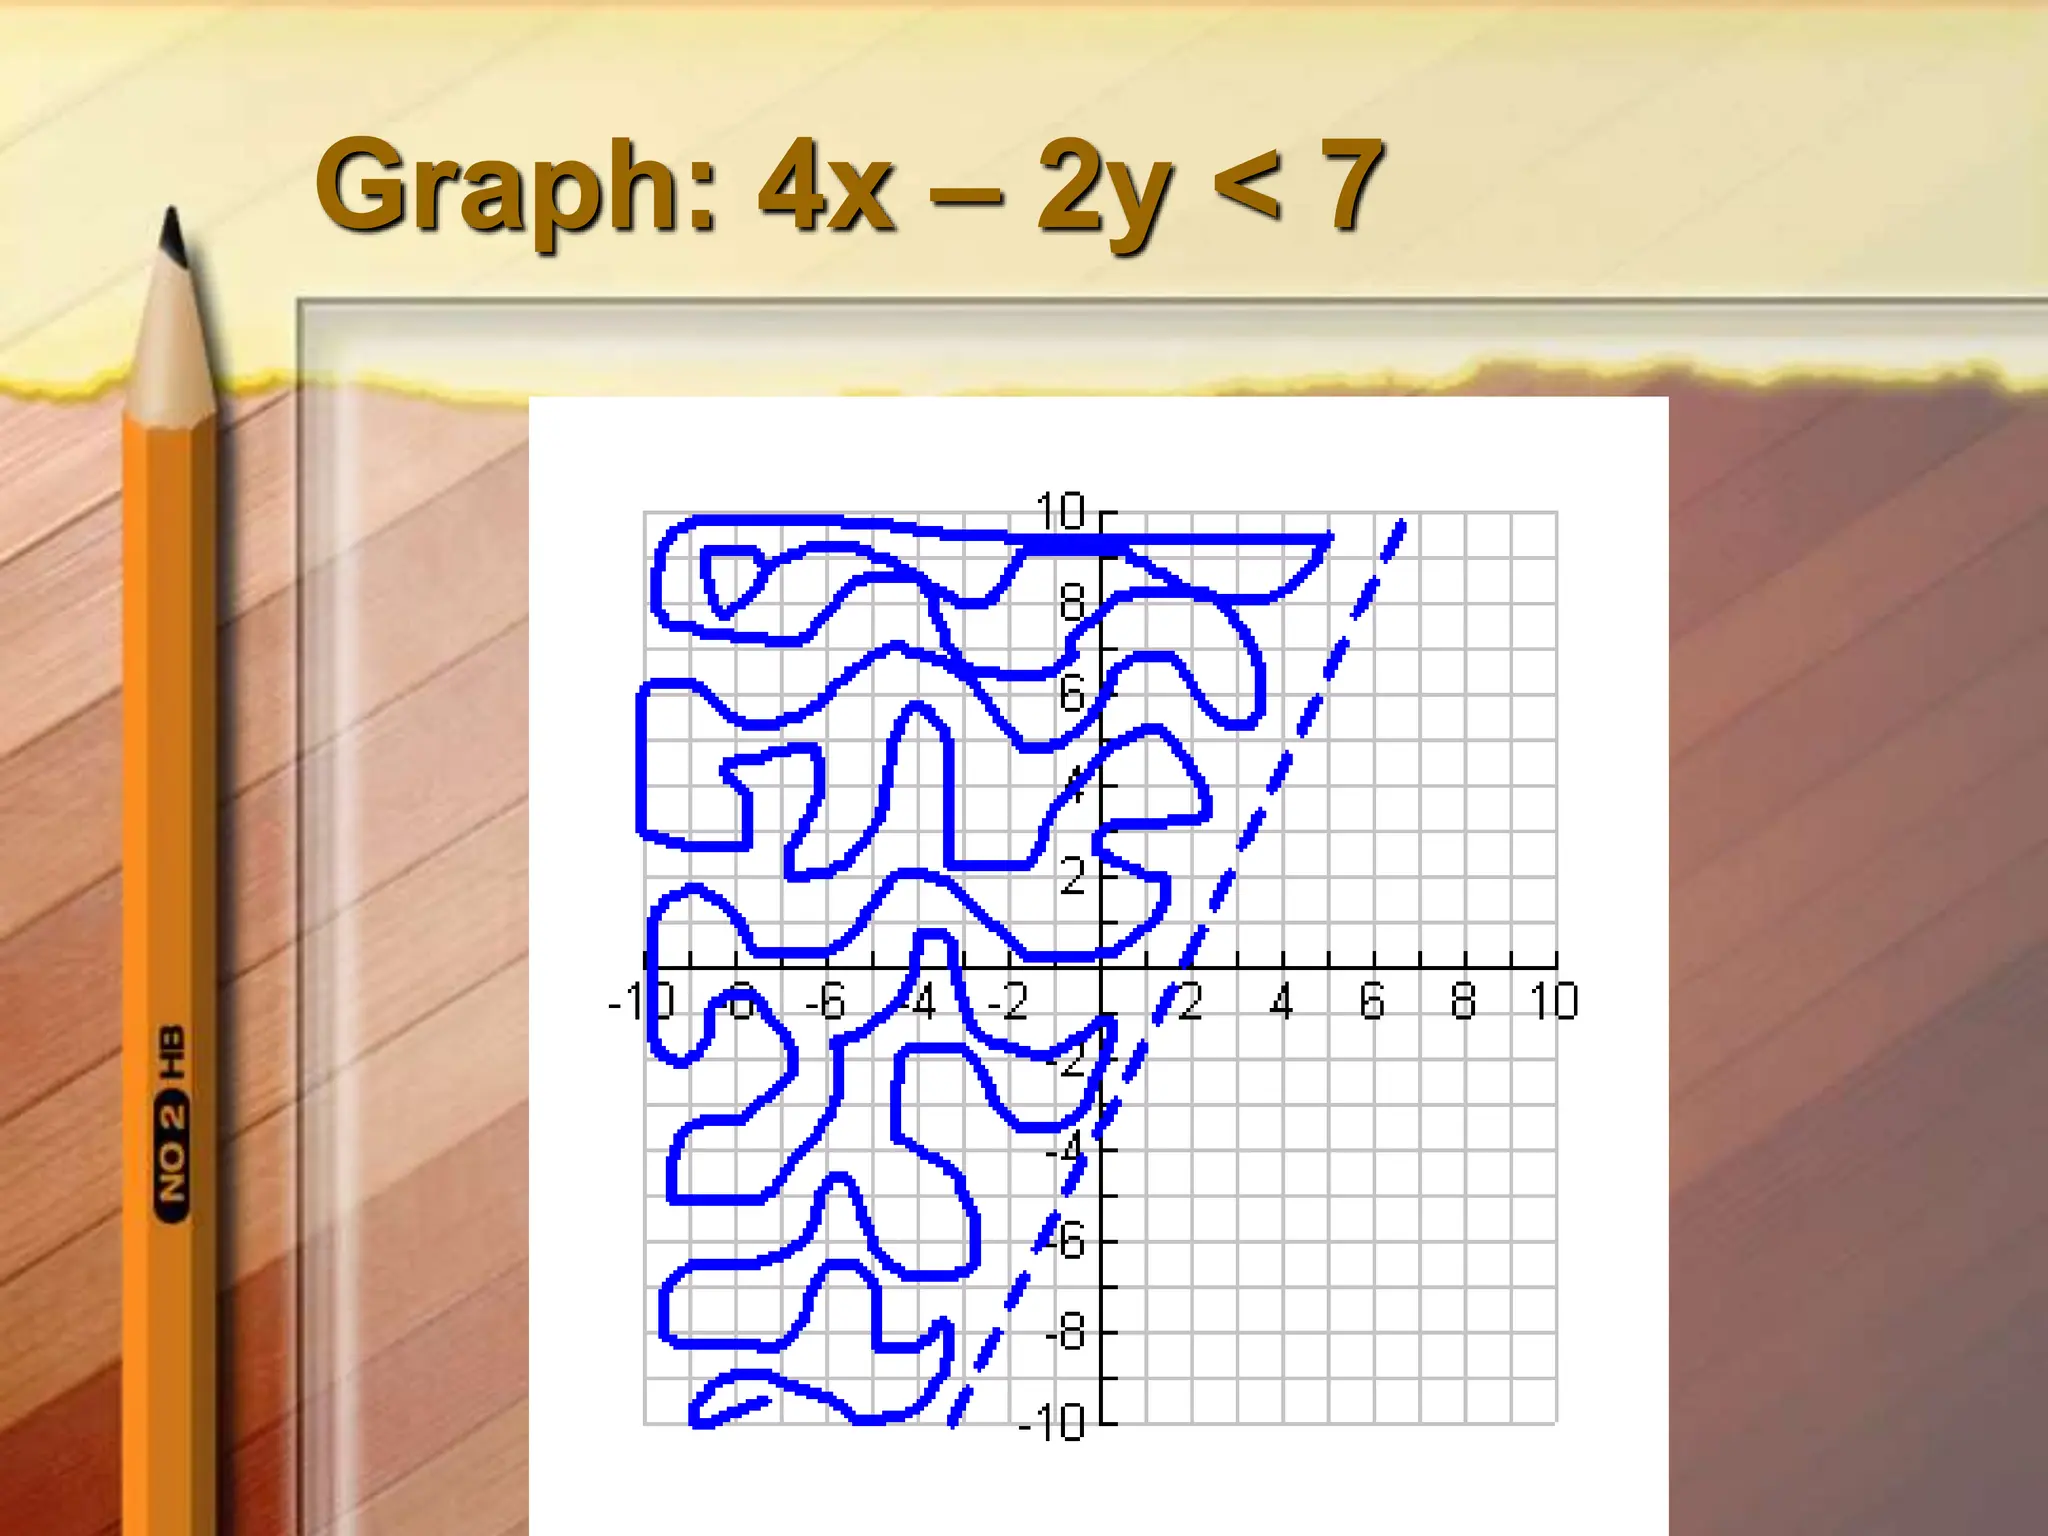

1. Solve the inequality for y: y > 2x - 3.5 2. Graph the boundary line y = 2x - 3.5 as a solid line since the inequality symbol is < 3. Test a point, such as the origin (0,0), which satisfies the inequality so shade below the boundary line where the solutions lie.


