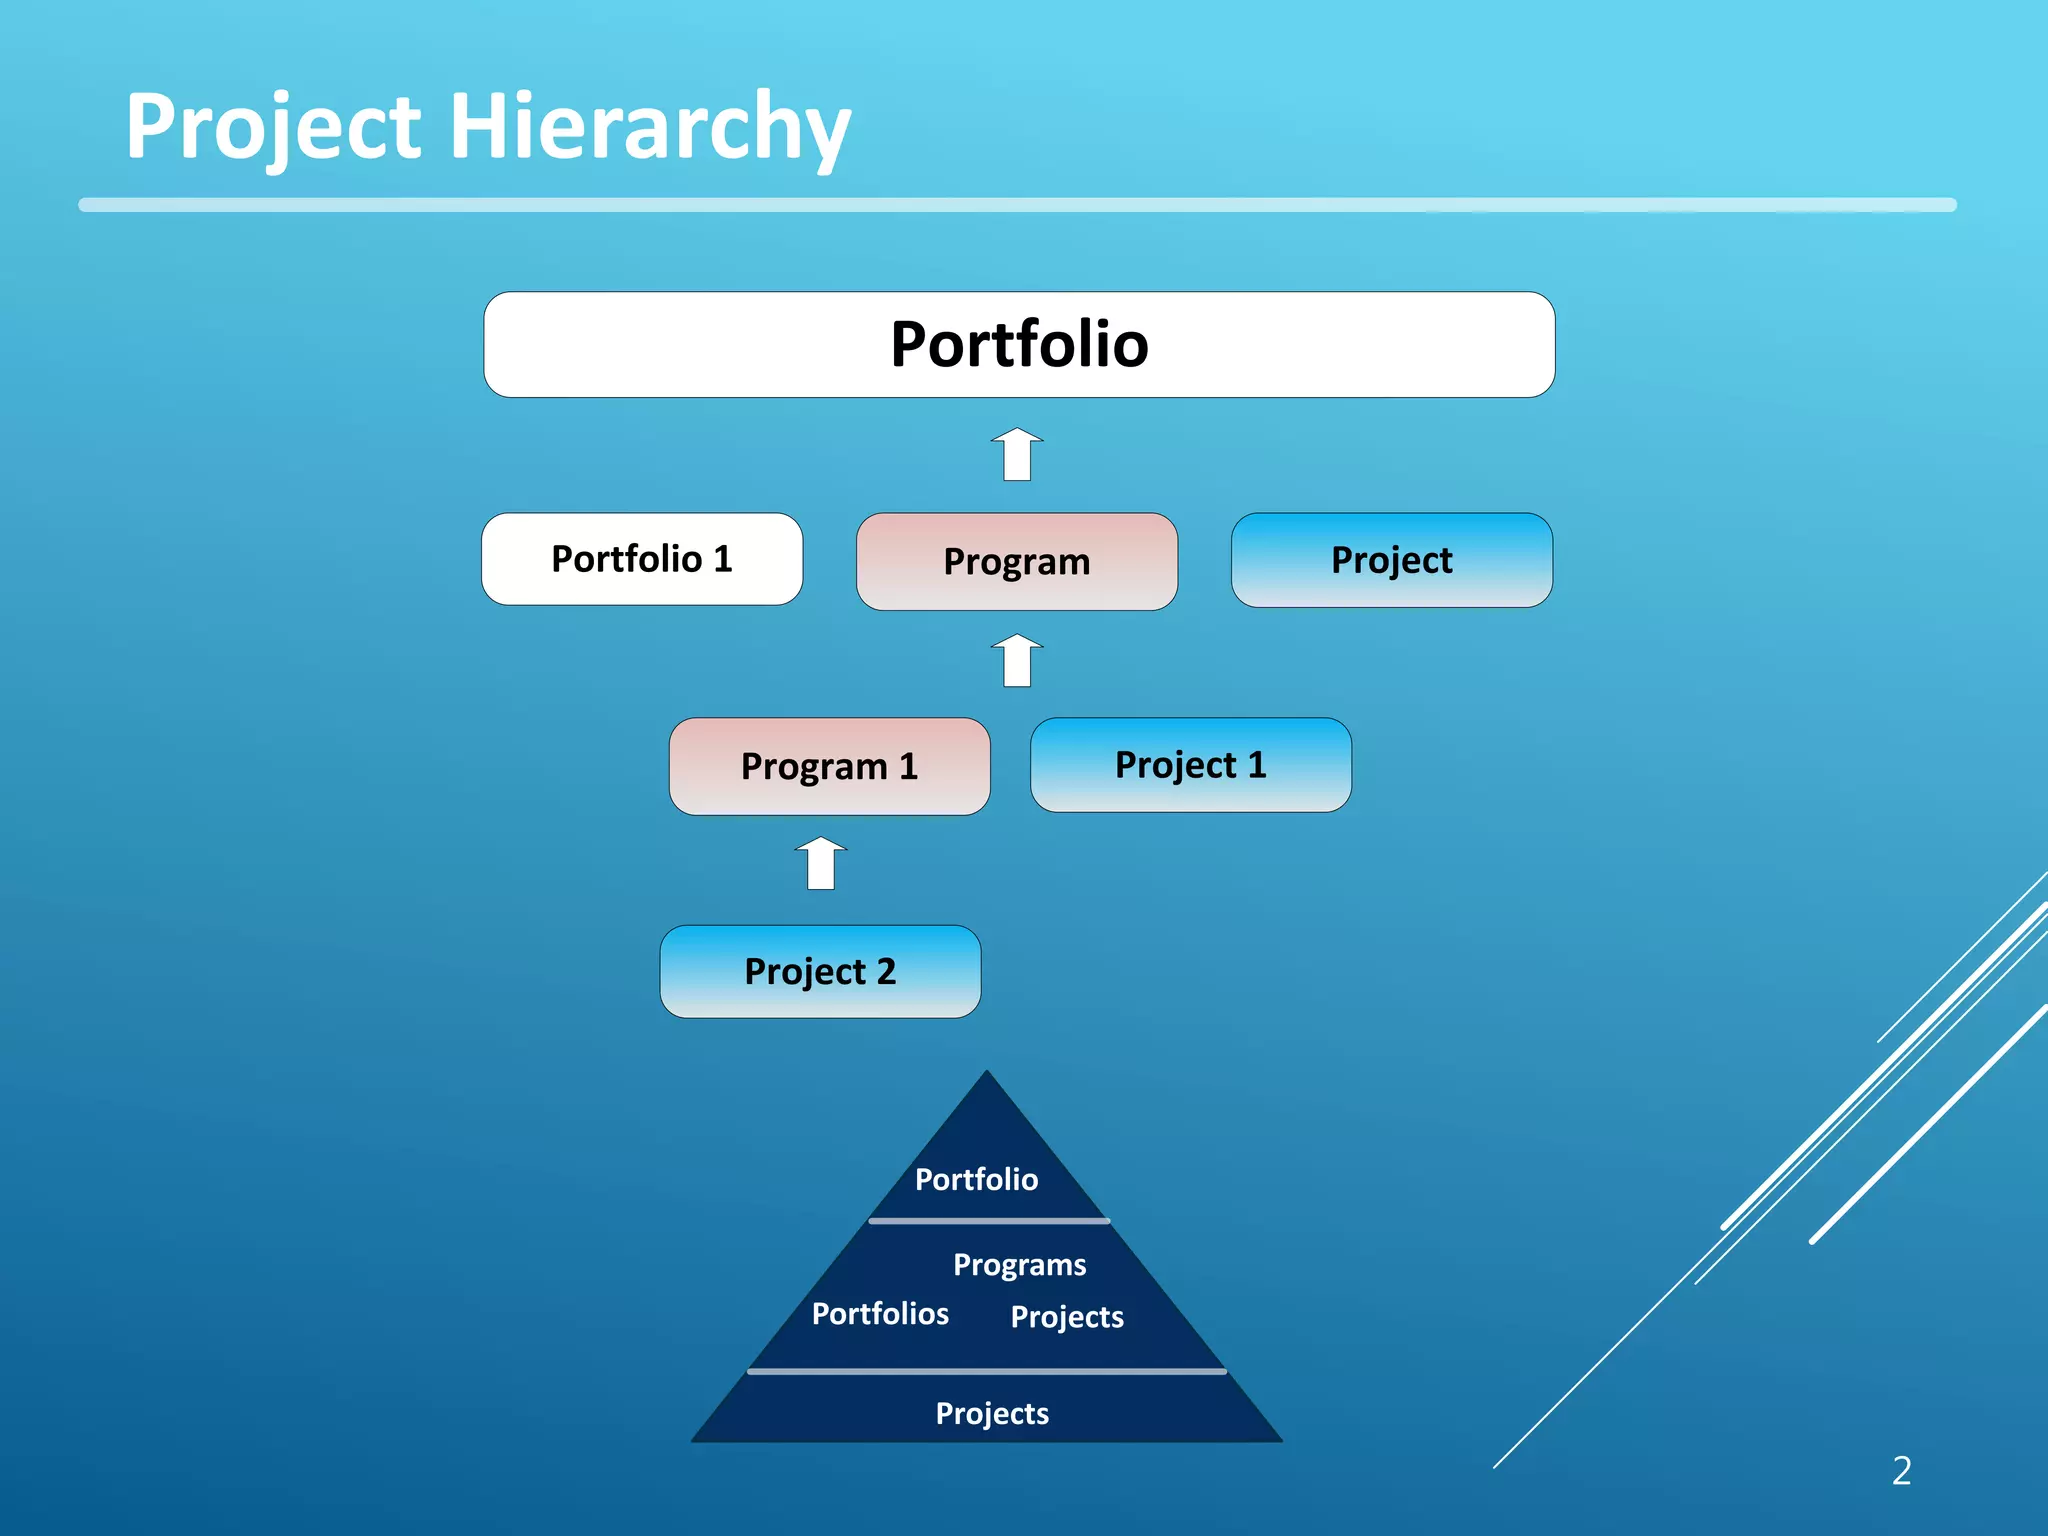
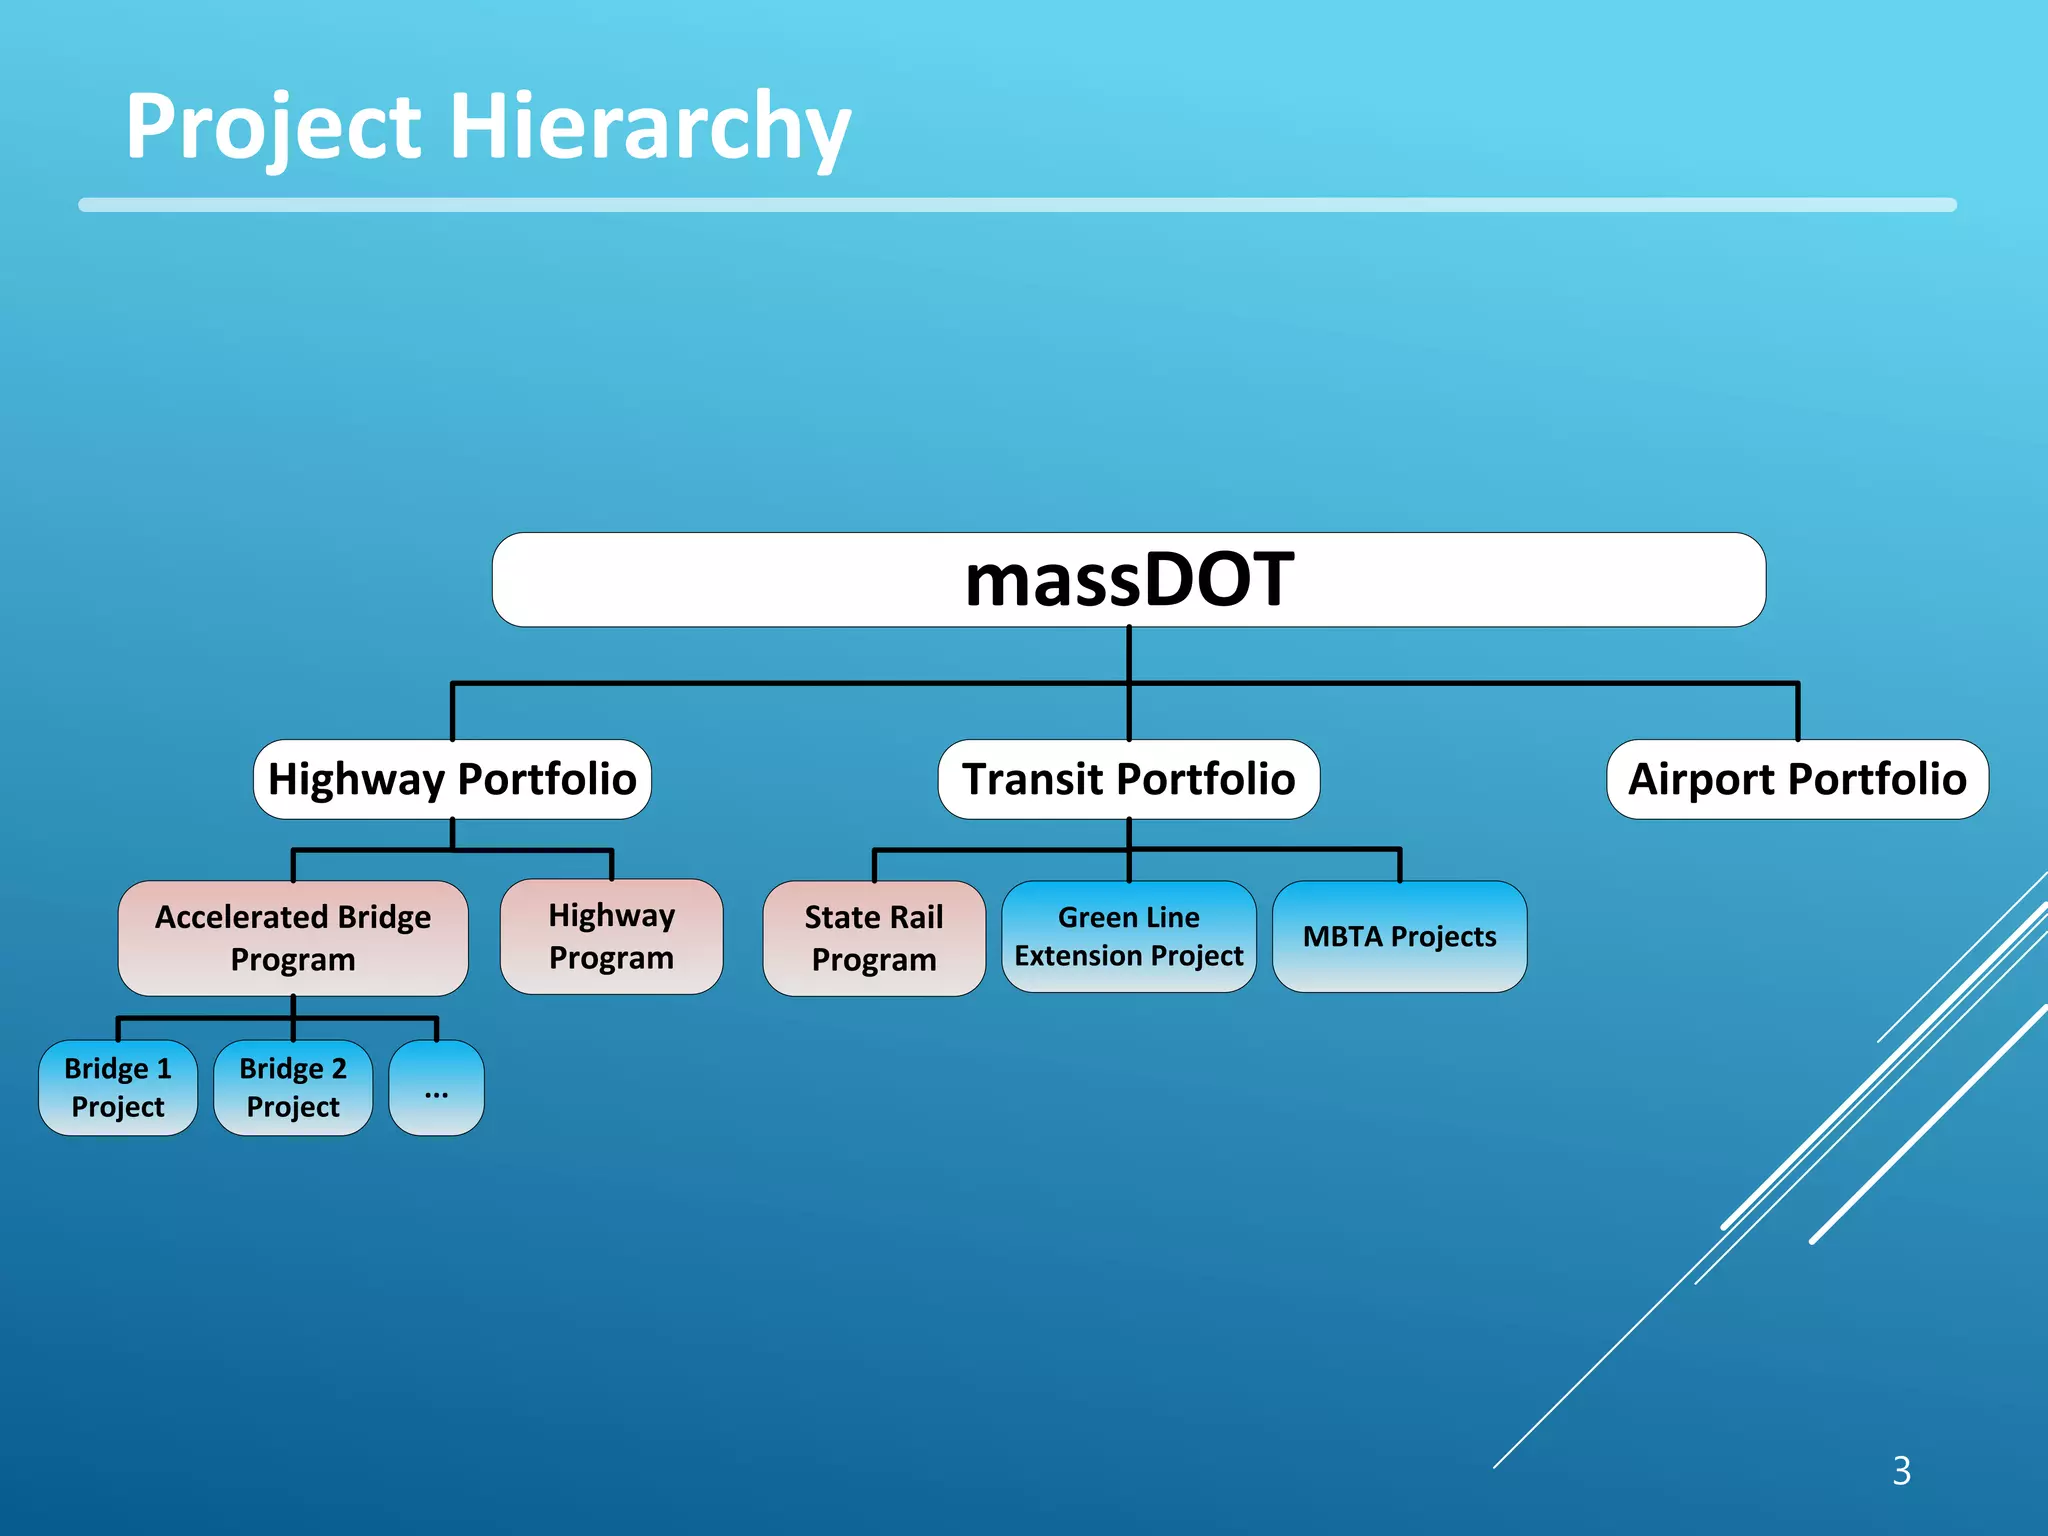
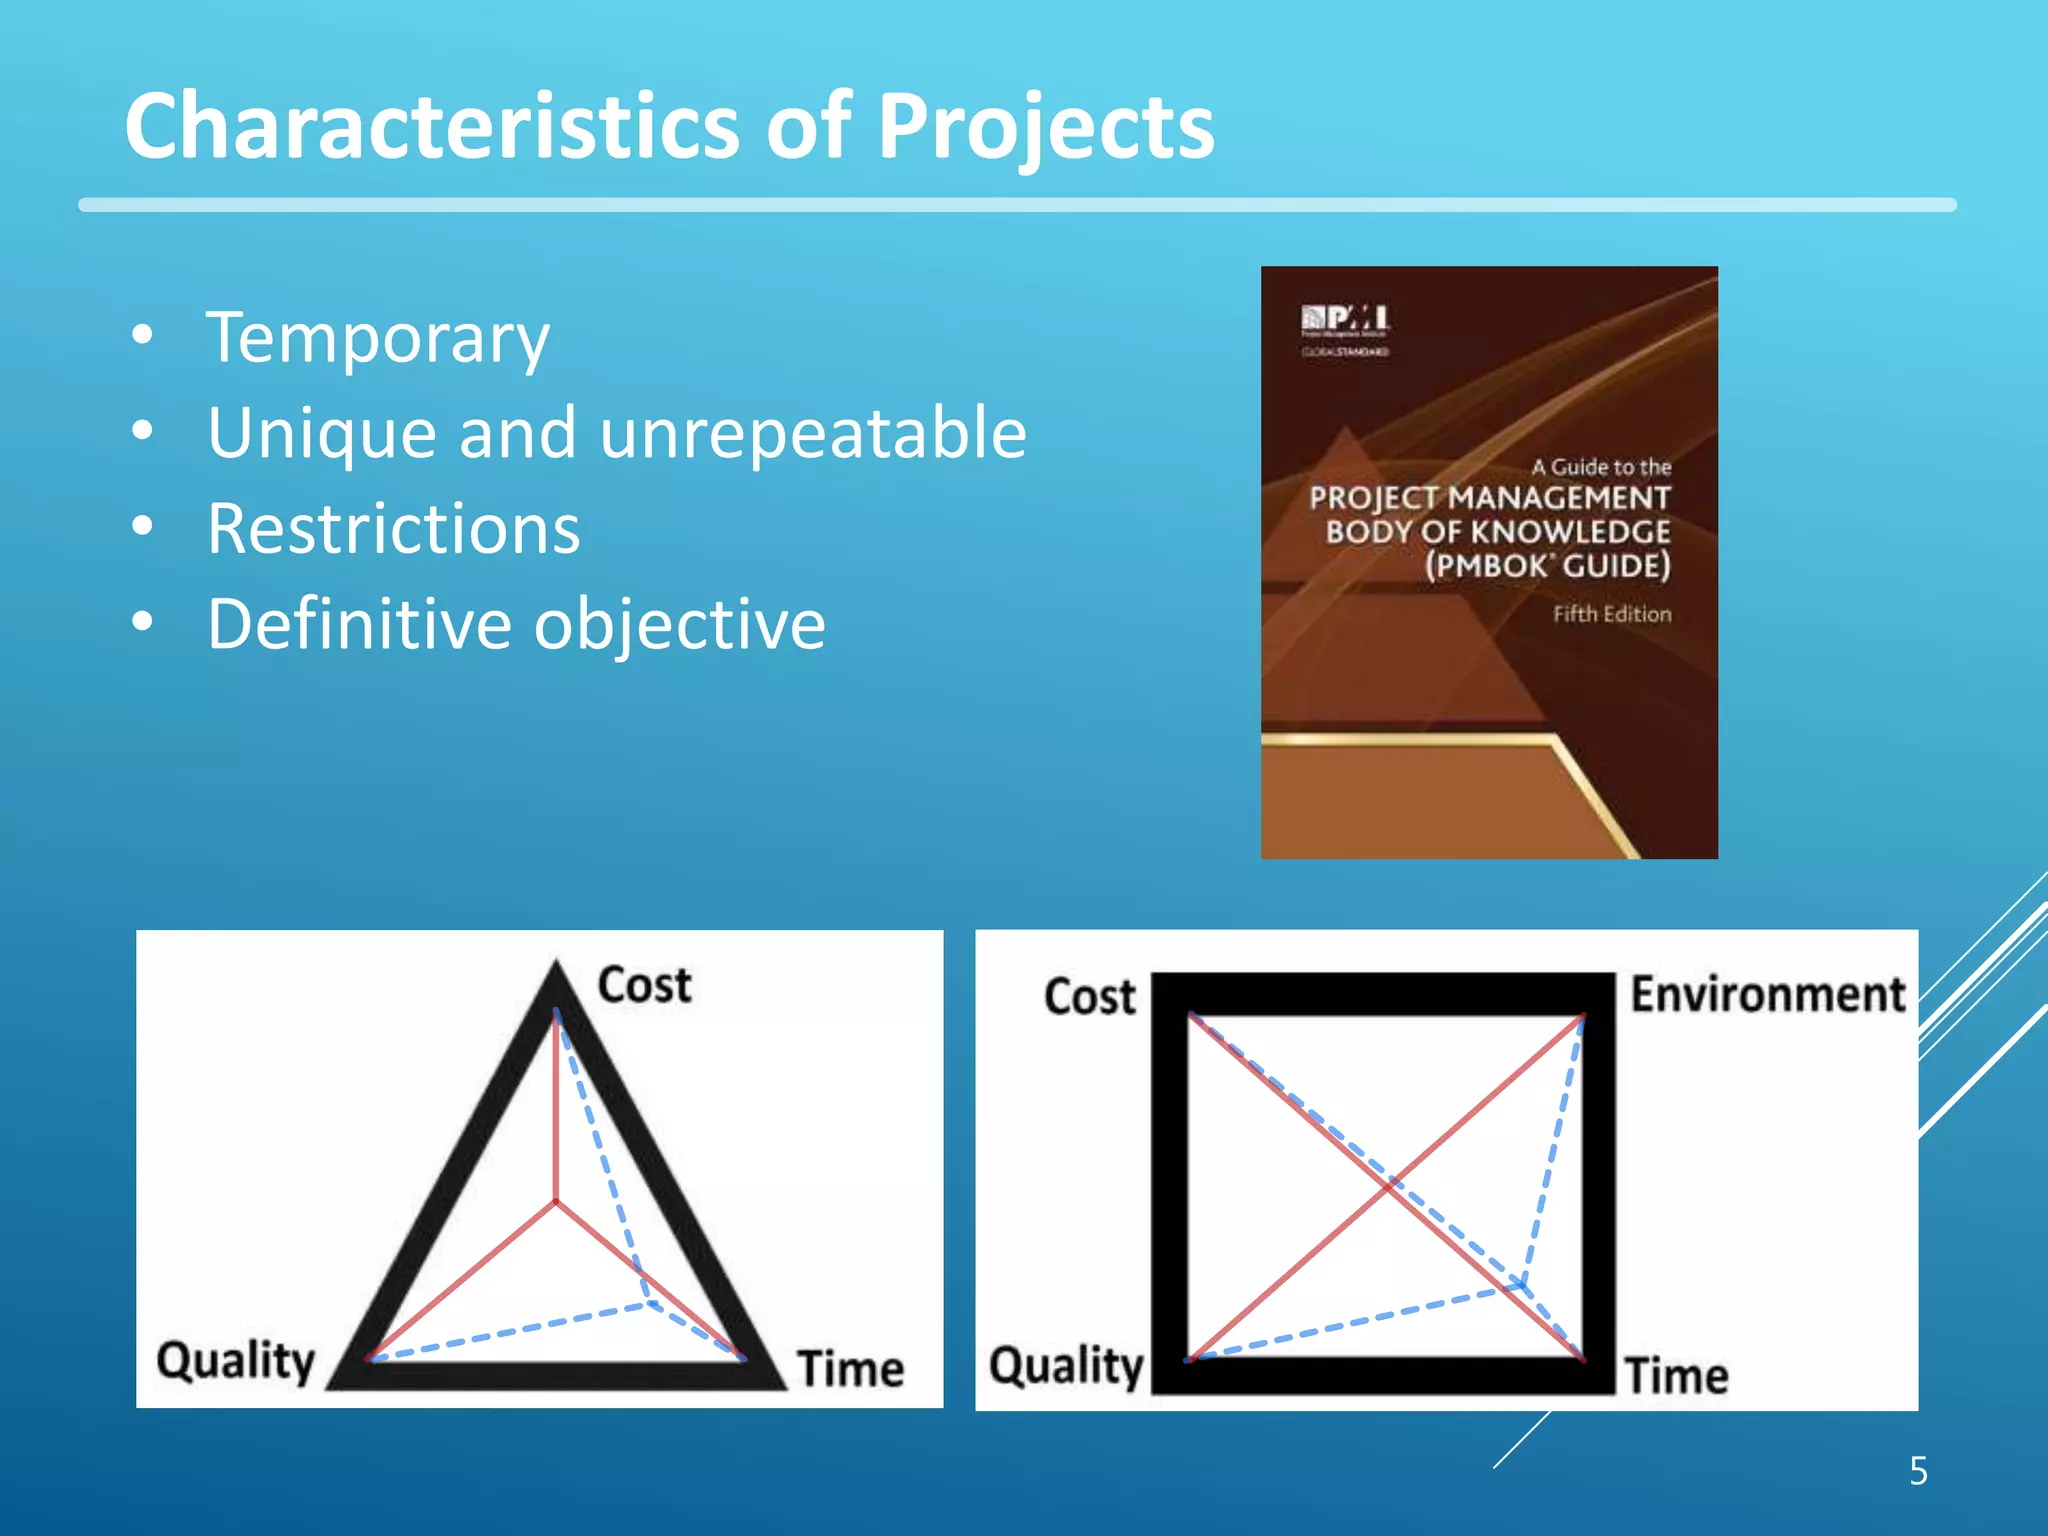
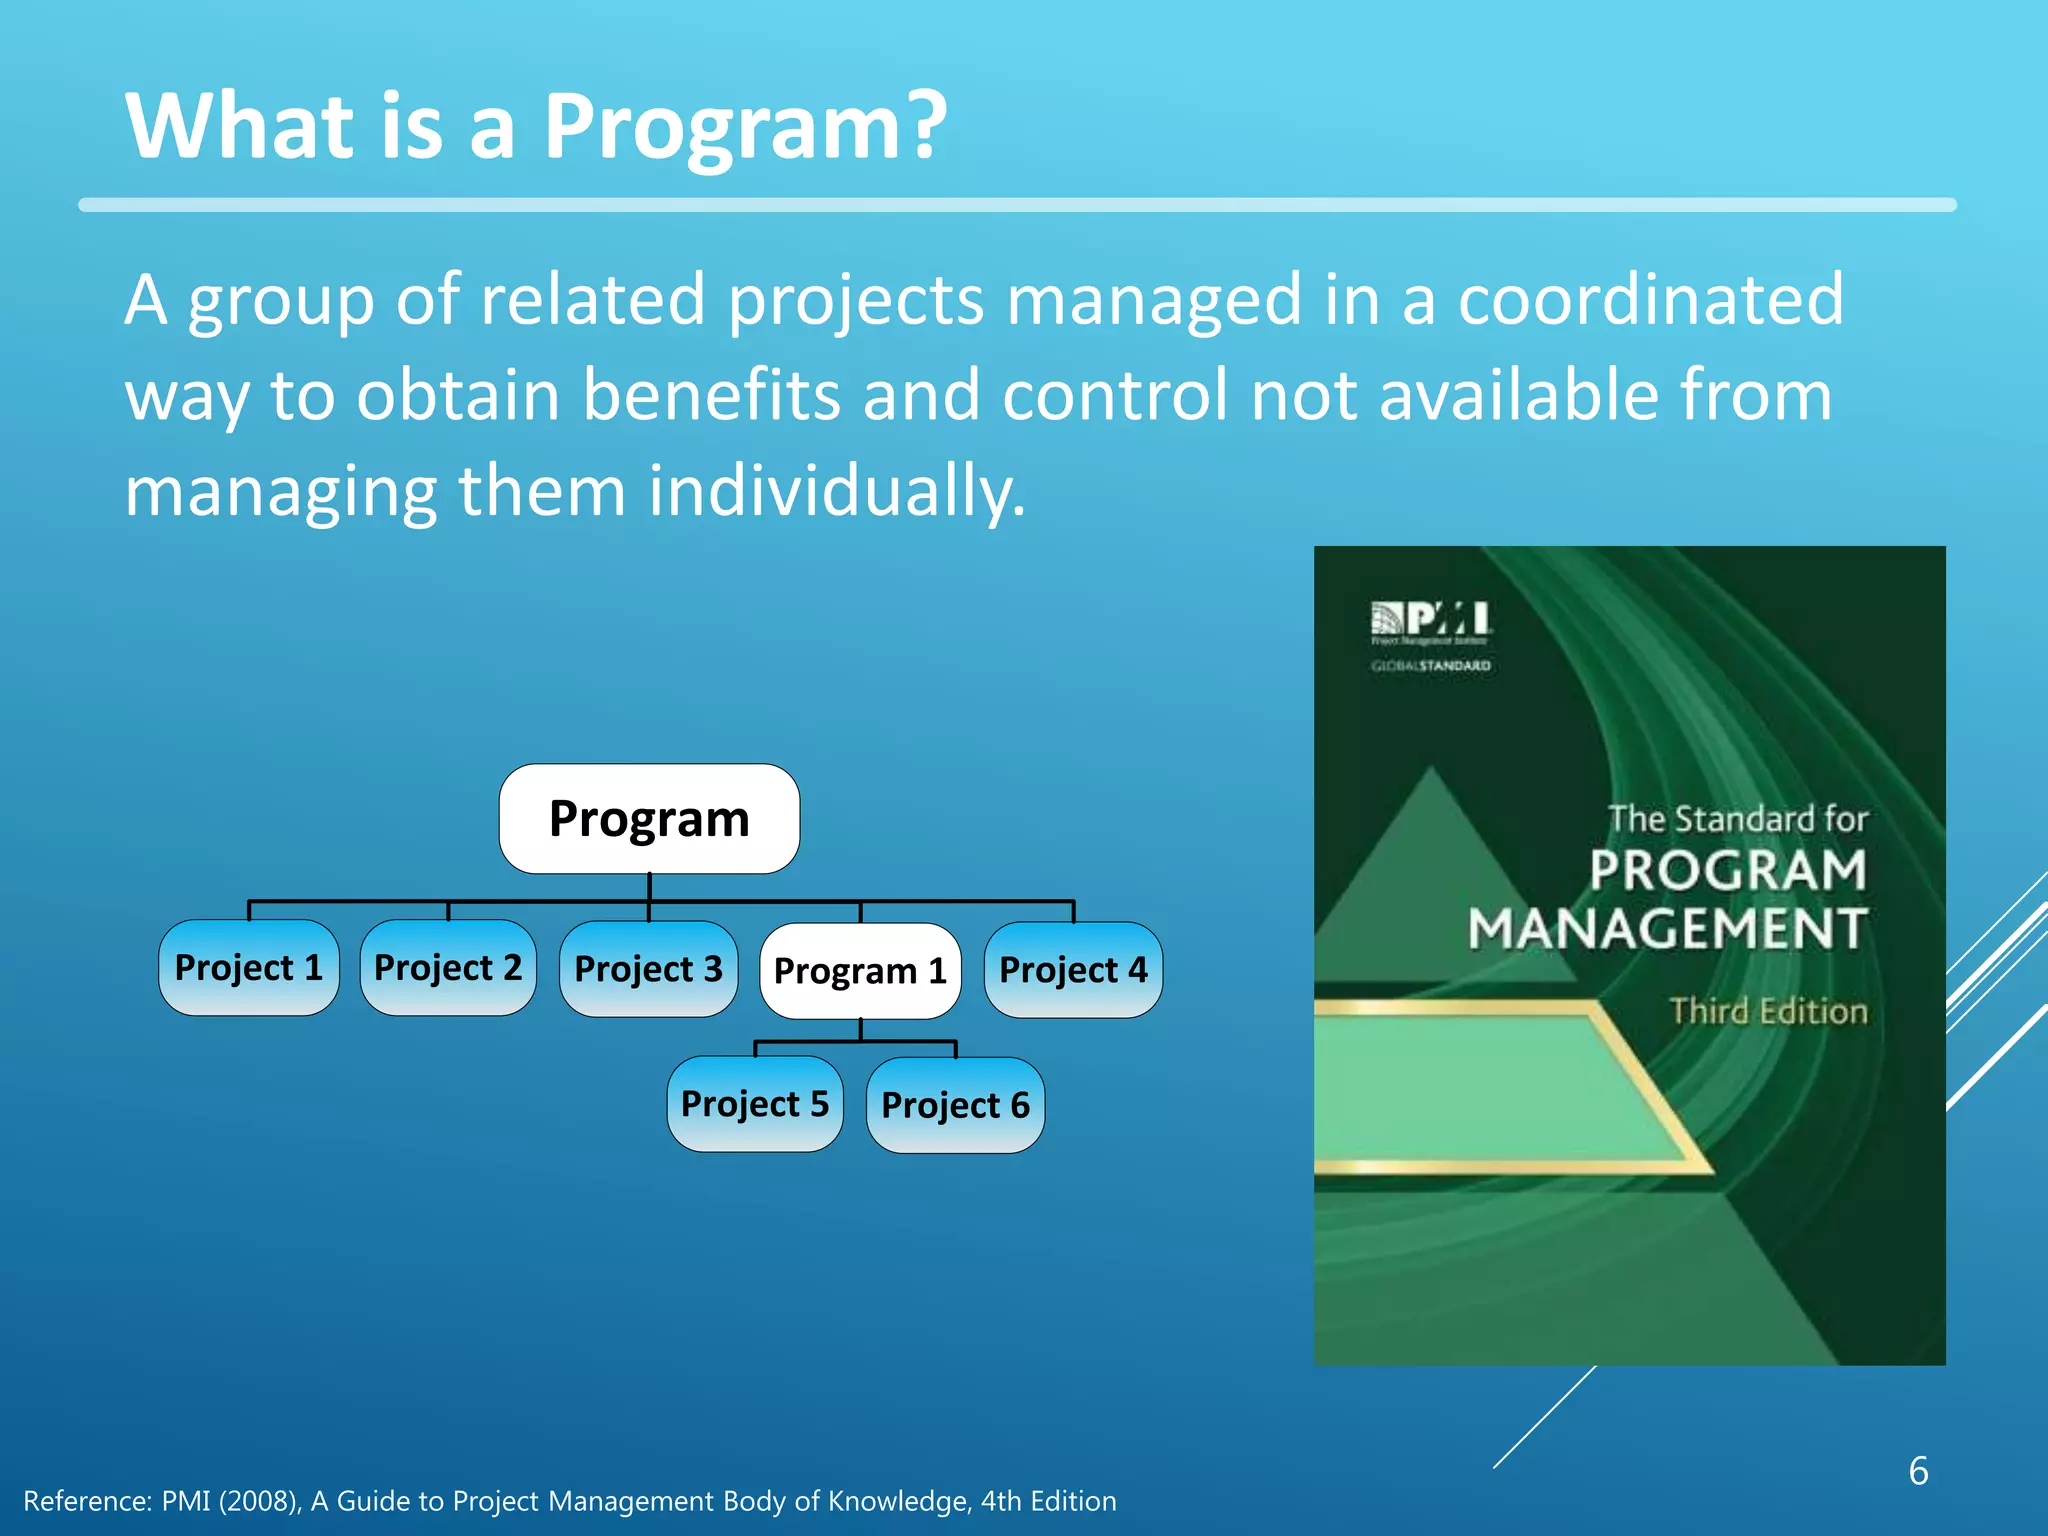
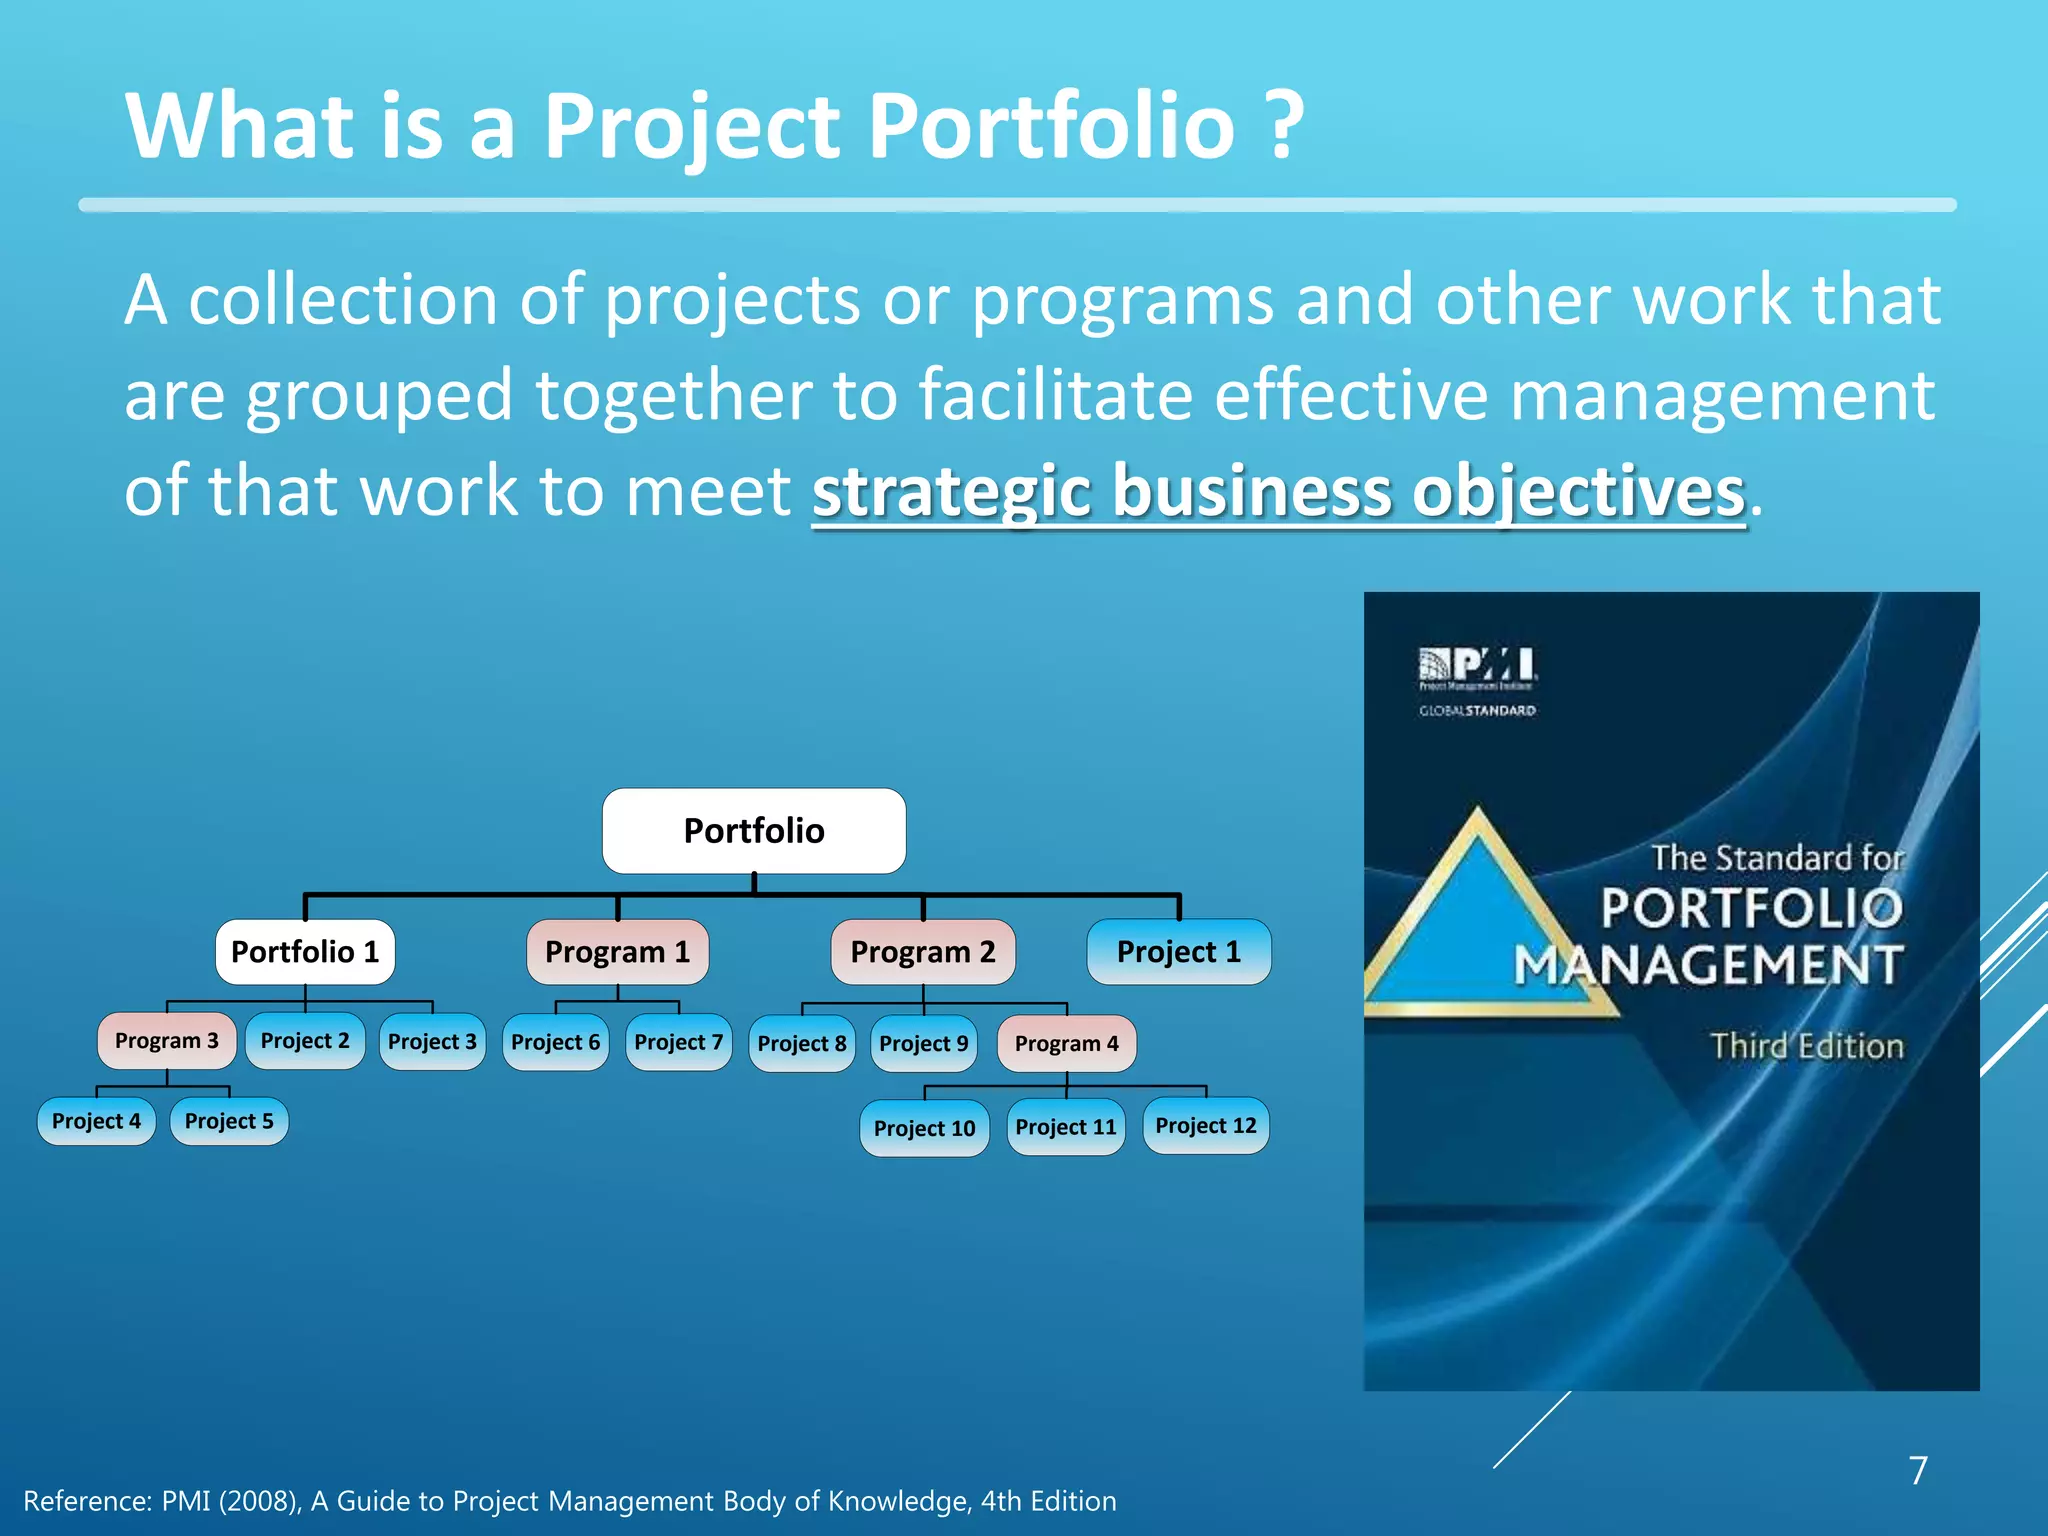
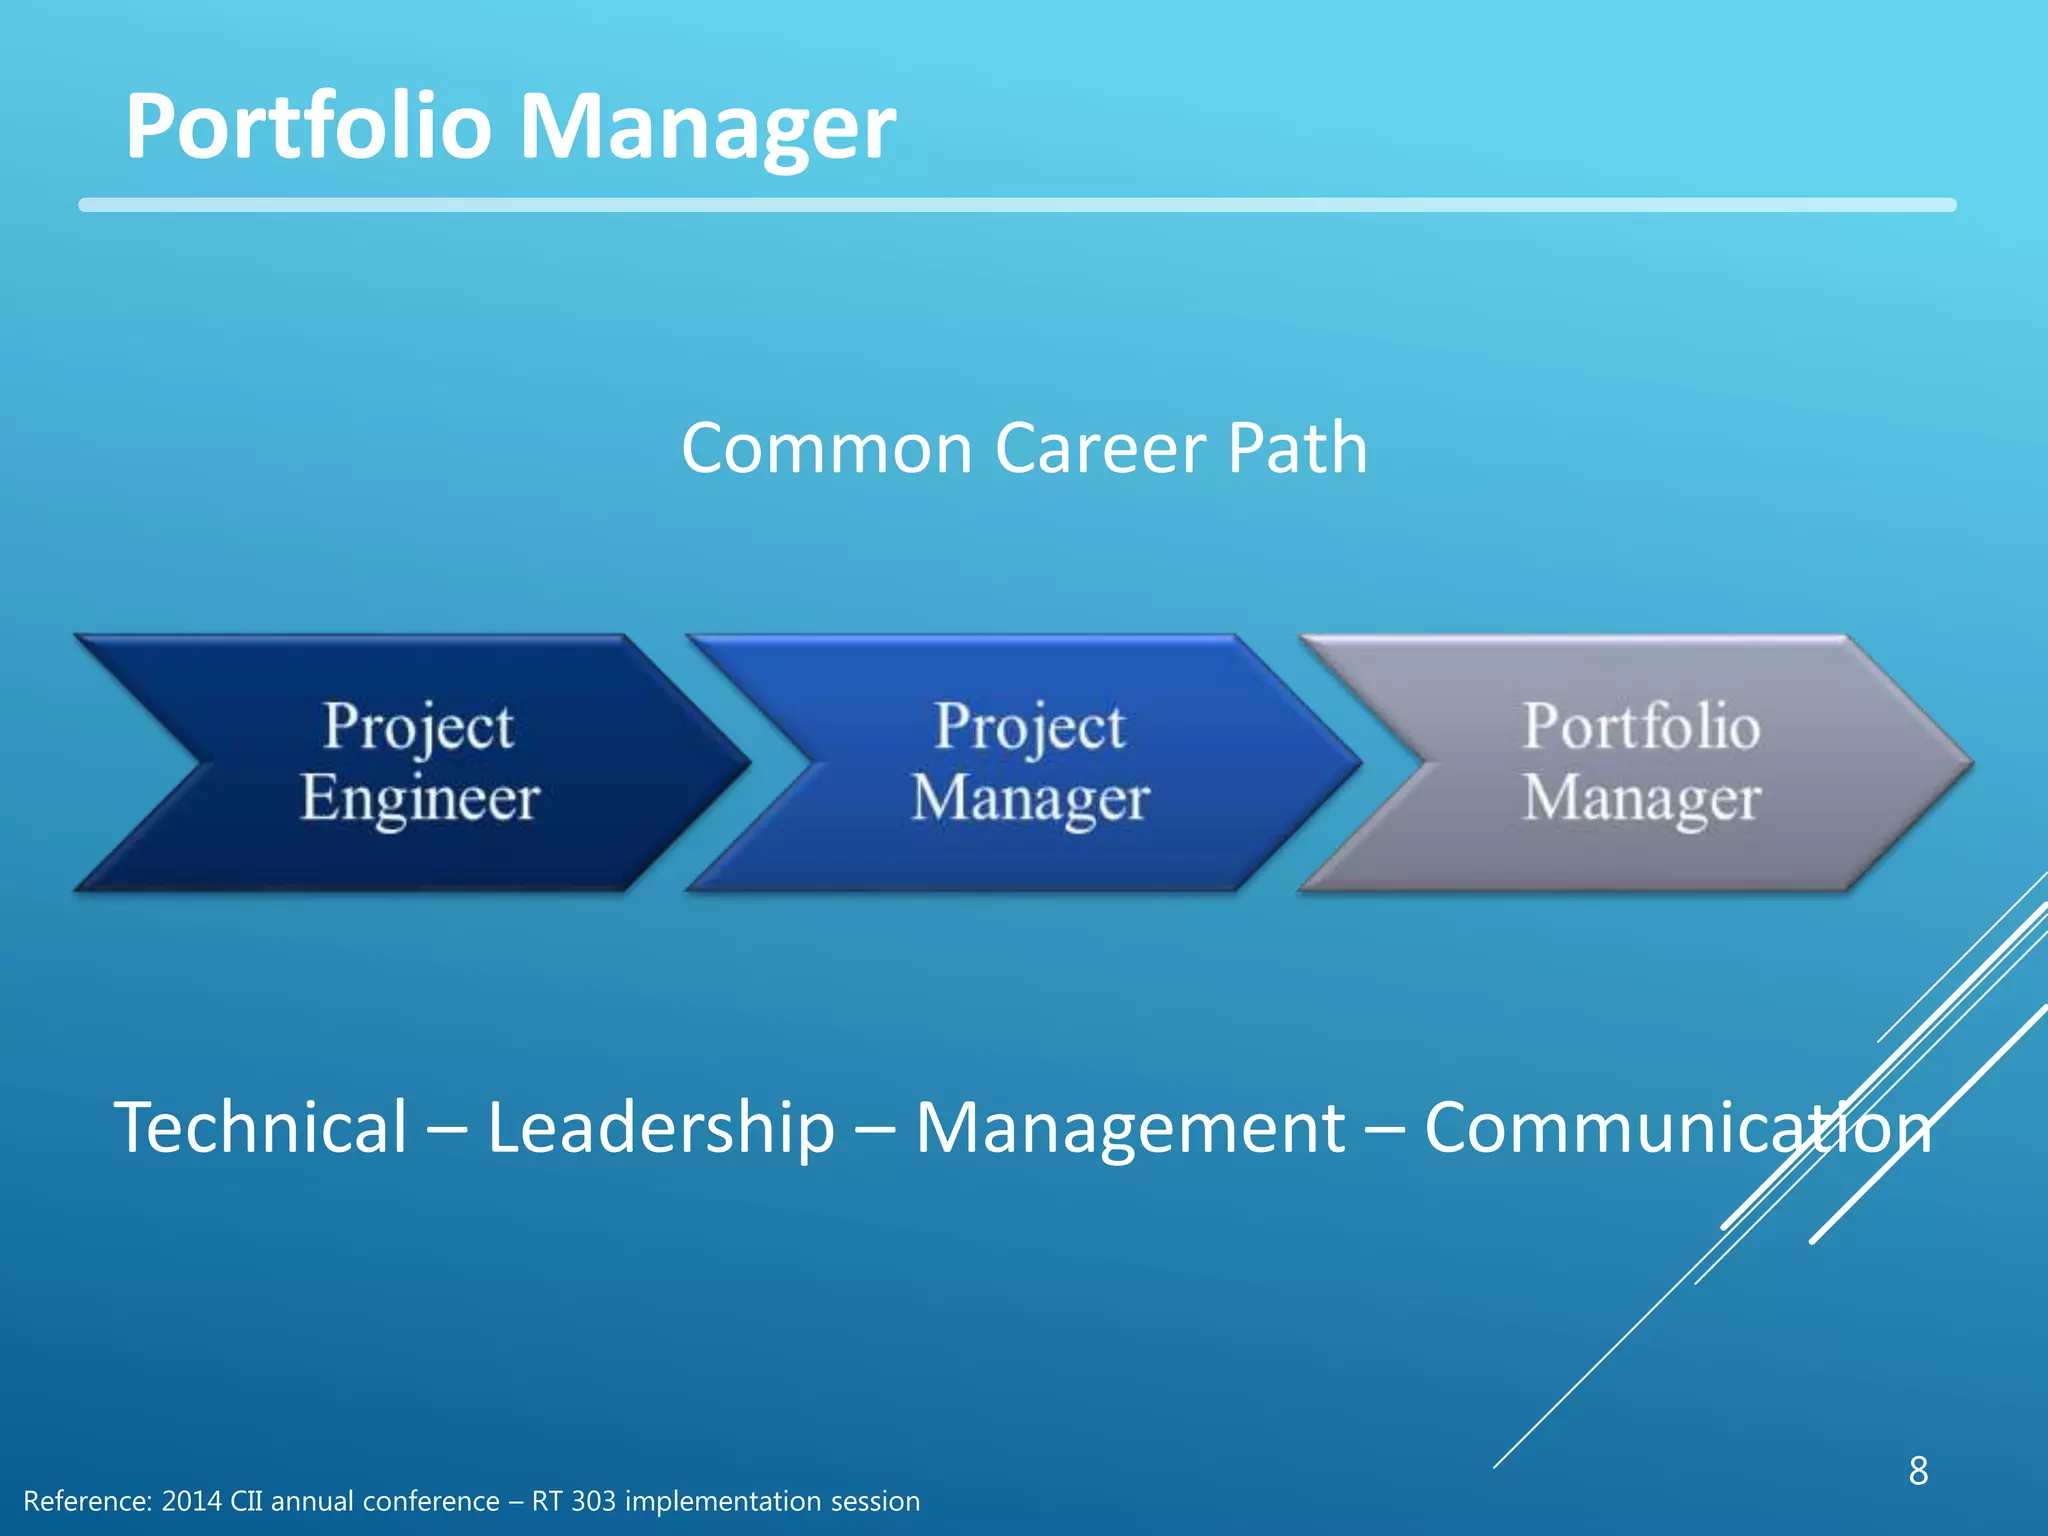
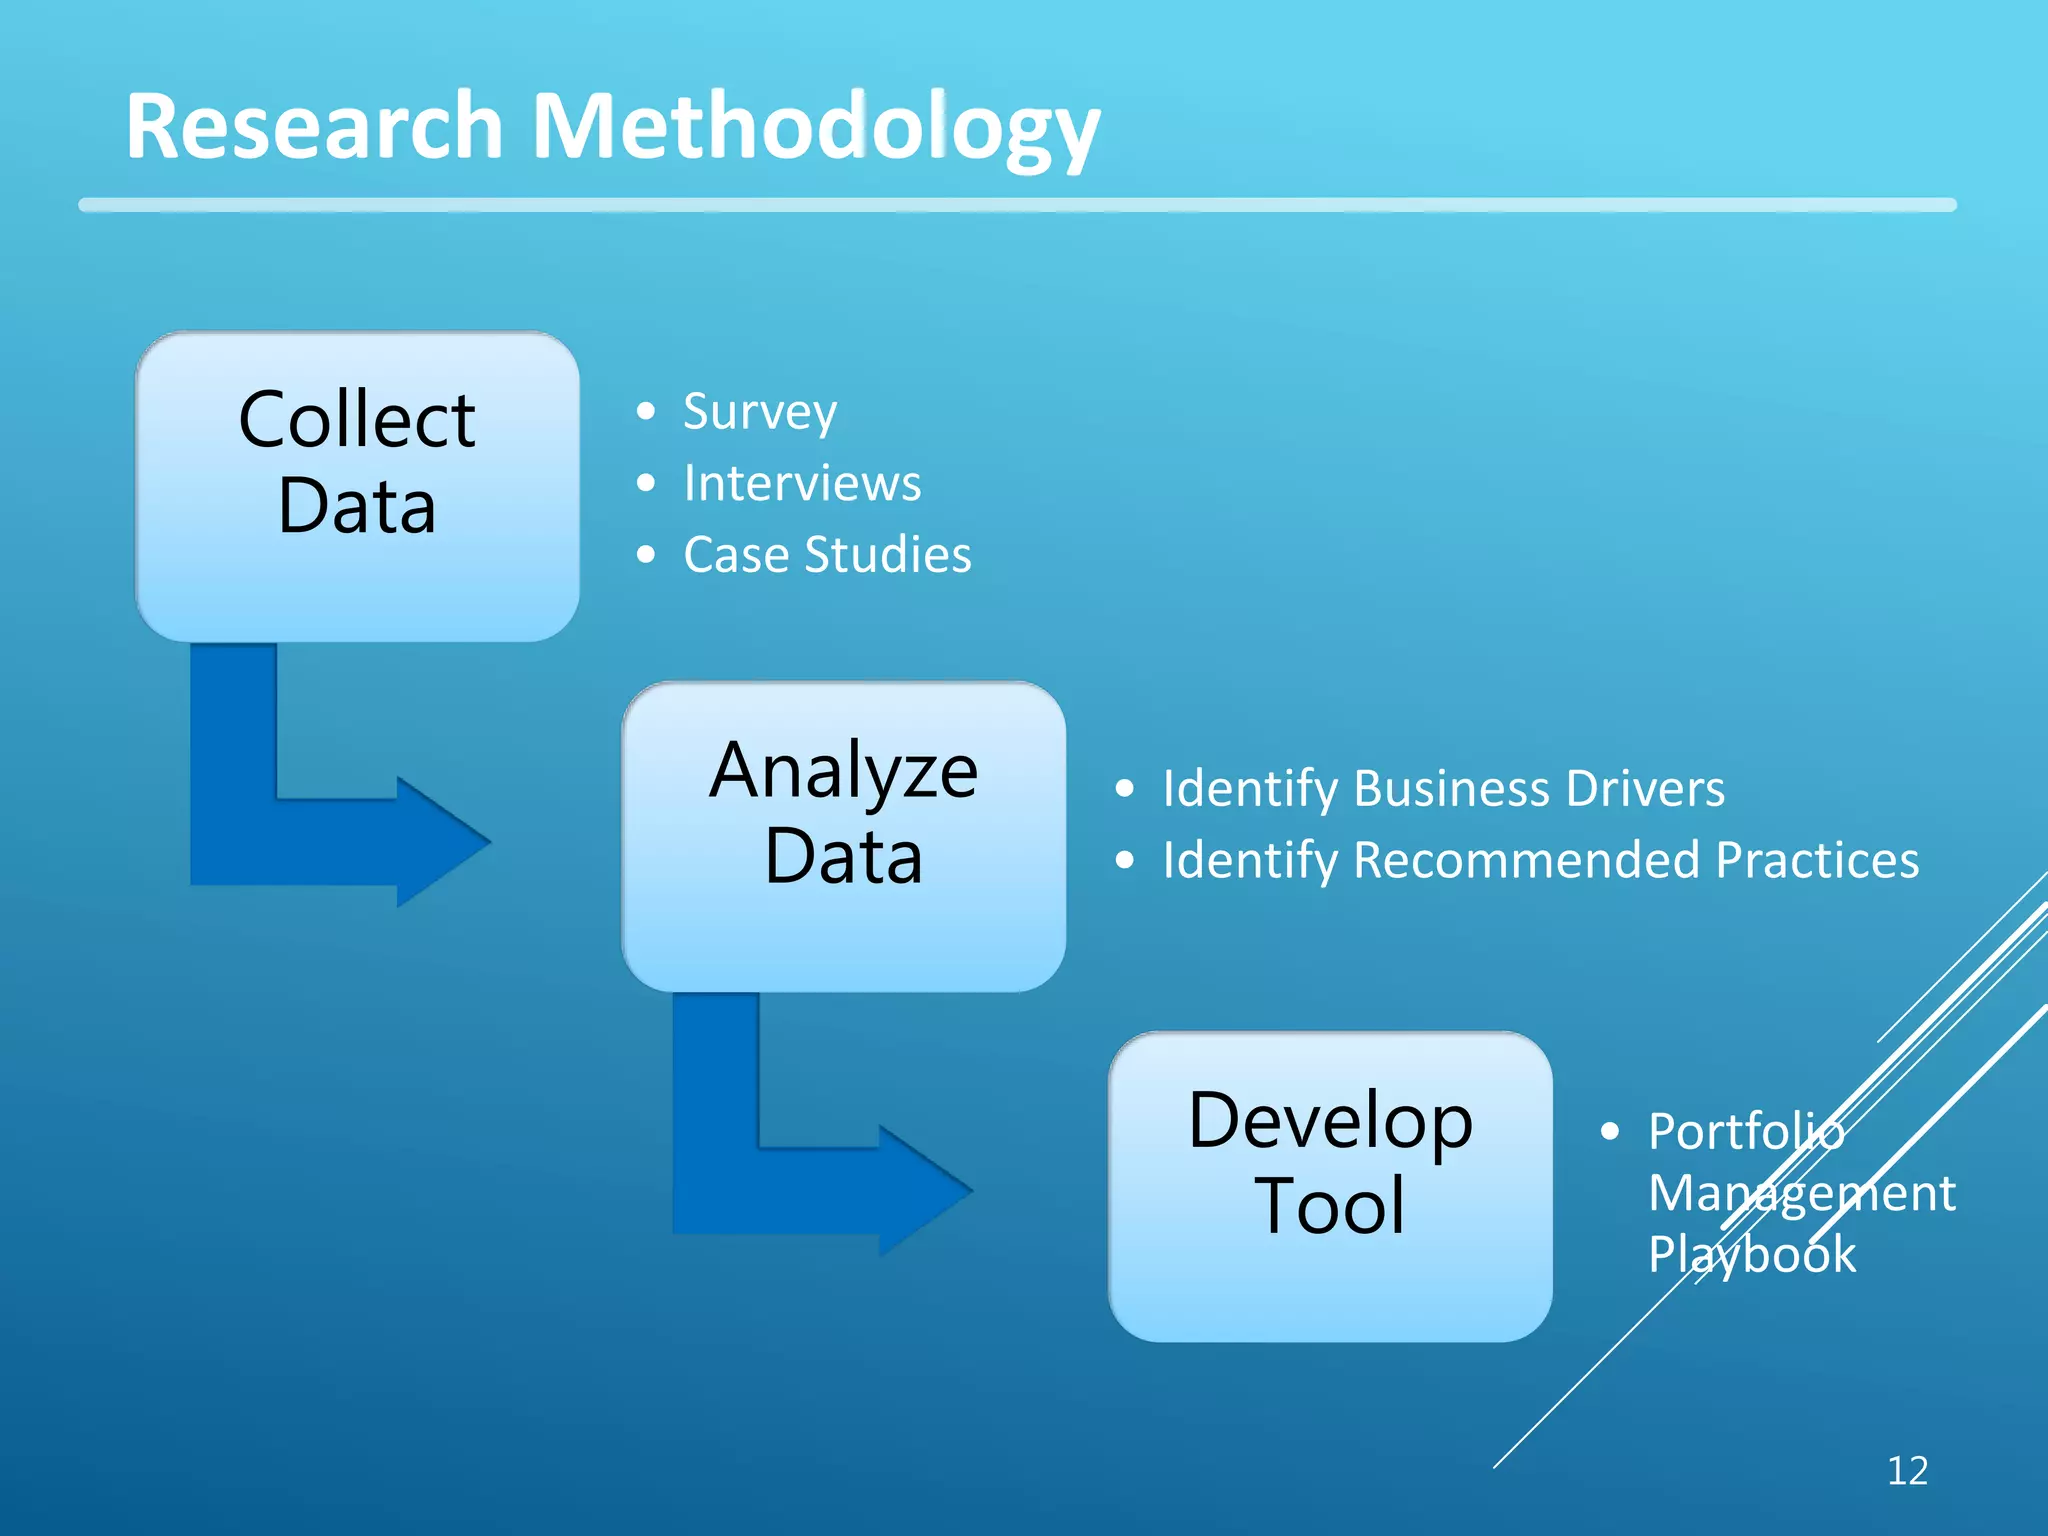
Project Portfolio Management-PPM- is a crucial discipline within organizations. CII has published his first documents on this area, IR303 and RS303. Project Portfolio Formation is the most important phase of portfolio management. Those projects should be selected from the list of candidate projects that create balance in portfolios and make the organizational goals achievable.
The document discusses techniques for achieving zero equipment failures through planned maintenance. It describes the differences between planned and reactive maintenance. Planned maintenance involves scheduled inspections and repairs, while reactive maintenance only addresses unplanned breakdowns. The document outlines seven steps to implement a planned maintenance program using either an equipment model or parts model approach. This includes evaluating current equipment conditions, improving conditions, developing inspection standards, extending service life, and implementing condition-based maintenance.
Total Productive Maintenance (TPM) is a lean tool that involves employees in maintaining equipment to improve production through reduced breakdowns and defects. TPM takes a holistic approach to maintenance through a team-based process. The objectives of TPM are to maximize production effectiveness and organize the shop floor to prevent losses. The eight pillars of TPM include autonomous maintenance, planned maintenance, quality maintenance, and training and education. Implementing TPM benefits companies by increasing equipment uptime and plant capacity while lowering costs.
Under this we have proposed a Lean Manufacturing technique which is named as SMED to reduce the Setup time and Changeover time of the manufacturing process in a heavy machine shop.
Overall Equipment Effectiveness (OEE) is a measure of the Maximum Potential Ability of a production equipment to perform in a particular production environment. It does NOT drop when production is reduced nor does it rise when production volume is increased. It is stable. It is like the inherent HP of an automobile engine. An increase in OEE may be compared to a successful modification of an automobile engine to increase its HP. Improvement is permanent.
The task assigned was to improve overall equipment effectiveness of outer tube machining cells. There were 6 outer tube machining cells, each machining cell had 3 machines first was 2T machine to machine both ends of outer tubes, second was 5T machine to deep boring operation and VMC machine to milling and drilling operations.
The task was to be completed in 5 steps. First step was production data collection of the month MAY 2016, Second step was to calculate OEE, third step was to analyze data to find the reasons of losses, fourth step was to find the root causes and the last step was to submit the action plan to improve on the losses.
This document provides an overview of Total Productive Maintenance (TPM). It defines TPM as a productive maintenance approach implemented by all employees in an organization to improve equipment effectiveness. The key points covered include: TPM was developed in Japan in the 1950s and involves operators and management in continuous equipment improvement; the goals of TPM are to increase production quality and job satisfaction through cross-functional teamwork; and TPM utilizes methods like overall equipment effectiveness (OEE) and autonomous maintenance.
The document provides an overview of the Maynard Operation Sequence Technique (MOST), a work measurement system developed in the late 1960s as an extension of MTM. MOST analyzes manual work by breaking it down into standard sequences of basic motions for moving objects, known as the General Move sequence and Controlled Move sequence. It provides predetermined time values for different types of motions that can be combined to calculate the time required for a work cycle. The document defines each motion parameter in the General Move, Controlled Move, and Tool Use sequences and provides examples of how MOST can be applied.
This document provides an overview of process failure mode and effects analysis (PFMEA). It discusses the steps to conduct a PFMEA, including identifying critical process steps and their potential failure modes, effects, causes, controls, and risk priority numbers. The goals of a PFMEA are to proactively identify potential process failures, prioritize issues based on risk, and determine actions to reduce failures and improve process quality, reliability, and customer satisfaction. Conducting a thorough PFMEA requires a cross-functional team approach.
Quality Maintenance is an "advanced" pillar of TPM and aims to assure zero defect conditions. Also known as Hinshitsu Hozen in Japanese, it does this by understanding and controlling the process interactions between the 4Ms - manpower, material, machines and methods that could enable defects to occur. The key is to prevent defects from being produced in the first place, rather than screening them out through inspection systems after they have been produced. Controlling quality through its causes is the essence of Quality Maintenance.
Developed by our JIPM-certified TPM Instructor, this presentation teaches the key concepts, principles and philosophy of Quality Maintenance, the 4M conditions that are essential for defect-free production, as well as the step-by-step process for Quality Maintenance.
LEARNING OBJECTIVES
1. Understand the key concepts, principles and philosophy of Quality Maintenance
2. Acquire knowledge on the 4M conditions and the prerequisites for promoting Quality Maintenance
3. Describe the 8-step process of Quality Maintenance and the key analytical tools and techniques
CONTENTS
1. Key Concepts & Philosophy of Quality Maintenance
2. 4M Conditions - The Determinants of Quality
3. The 8 Steps of Quality Maintenance
4. Key Tools & Techniques for Quality Maintenance
5. Towards Excellence in Quality Maintenance
To download this presentation, visit:
https://www.oeconsulting.com.sg/training-presentations
This document provides an introduction to Lean manufacturing concepts. It aims to help readers understand Lean, identify types of waste, and learn Lean tools and techniques. The core idea of Lean is maximizing customer value while minimizing waste. It defines seven types of waste including overproduction, waiting times, transportation, processing, inventory, motion, and defects. It also explains Lean tools and techniques for standardizing work, using visual controls, conducting quick changeovers, implementing total productive maintenance, and empowering self-inspection. The overall goal is to eliminate waste and continuously improve processes to provide value to customers.
Poka-yoke, also known as mistake-proofing, aims to eliminate defects by preventing or correcting mistakes as early as possible. It was developed by Dr. Shigeo Shingo as part of the Toyota Production System. The presentation defines poka-yoke, discusses common errors and their impacts, and provides examples of mistake-proofing strategies and devices that make errors harder or impossible, like limit switches, guide pins, and checklists. The goal of poka-yoke is to achieve zero defects through early detection and prevention of mistakes in the production process.
Value Stream Mapping: How to Visualize Work & Align Leadership for Organizati...TKMG, Inc.
Recorded webinar: http://slidesha.re/1mRCY9U
Subscribe: http://www.ksmartin.com/subscribe
To purchase the book: http://bit.ly/VSMbk
Value Stream Mapping is an essential organizational transformation tool that is often misunderstood and under-utilized.
In this webinar, you'll get an advance glimpse into Karen and Mike Osterling's latest book, which will be out in December. You'll learn the in's and out's of planning for a mapping activity, tips for effective mapping sessions, and how to create a transformation plan with "stickiness."
You'll also learn the difference between value stream and process mapping and where A3, kata, kaizen events fit into the picture.
Plant maintenance involves methods and practices to keep industrial facilities running efficiently, including regular equipment checks, cleaning, and safety measures. Poor maintenance can negatively impact productivity. The maintenance process involves documenting equipment conditions, planning and executing maintenance tasks, and recording maintenance history. There are different types of maintenance approaches ranging from breakdown/corrective maintenance to preventive maintenance and proactive strategies like total productive maintenance (TPM), which aims to eliminate waste and involve employees to improve equipment reliability and productivity. TPM's five pillars are focused equipment management, autonomous maintenance, planned maintenance, quality maintenance, and safety and health. TPM differs from total quality management (TQM) in its emphasis on equipment and processes rather than only products and services.
This document discusses equipment maintenance and total productive maintenance (TPM). It outlines the aims of equipment maintenance as keeping equipment ready for productive operation and defines failure as when equipment loses its prescribed function. It then lists common symptoms of failure-prone workplaces and ways to prevent failures through conducting preventive maintenance like routine cleaning, lubrication, and inspection. The document also discusses implementing preventive maintenance to minimize erratic failure intervals, extend equipment life, and predict failures. Finally, it introduces TPM, explaining that as machines become more advanced, products are made by equipment so failures cannot be allowed, and all departments must work together to properly maintain equipment through TPM's 12 step deployment program.
This is a 2 days course on Total Productive Maintenance (TPM) that will guide you through to implement Autonomous Maintenance (AM) on your current Equipment and to plan the execution of your Preventive (PM) & Predictive Maintenance (PdM).TPM defines your Maintenance schedule and Goals. TPM helps you plan and develop the optimal program for your facility, resulting in increased efficiency and cost savings.
Day 2
TPM Implementation after (AM) & Maintenance
Workshop Activities
Review & extract Equipment PM to a ‘Do Dot’ Visual Master Plan & Visual TPM Board.
Attacking 6 big losses of Equipment
(PdM) with Engineering Kaizen to maximize
Equipment Utilization
Quality, Engineering & Maintenance Kaizen
Improvement Action Projects & Action Plans
Total Quality Managment - TPM - final year B.E.cs - Presented by DR. K. BARANIDHARAN, SAIRAM INSTITUTE OF MANAGMENT STUDIES (sims) SRI SAI RAM INSTITUTE OF TECHNILIGY (sit) CHENNAI
TPM is a world class manufacturing initiative that seeks to optimize the effectiveness of manufacturing equipment. This TPM Team Guide teaches supervisors, workgroup leaders and operators how to develop the team-based skills required for effective and sustainable TPM implementation. It is geared towards TPM projects but describes basic elements of improvement team activities that can be used by any kind of shopfloor improvement groups such as quality or process improvement teams.
Developed by our JIPM-certified TPM Instructor, this TPM Team Guide is a toolbox of practical advice and techniques for starting TPM and keeping it going. This presentation sets a strong foundation on which key TPM pillars such as Autonomous Maintenance, Focused Improvement and Quality Maintenance are built upon.
LEARNING OBJECTIVES
1. Understand the concept and management philosophy of TPM and team activities
2. Acquire practical tips for managing TPM
3. Learn how to kick start, manage and sustain TPM team activities
4. Acquire knowledge on the useful tools for TPM team activities
To download this presentation, visit:
https://www.oeconsulting.com.sg/training-presentations
The Production Part Approval Process (PPAP) document provides information about NCR's PPAP requirements for suppliers. It describes what a Production Warrant is and its purpose of documenting part approval. The summary explains that suppliers must submit a Production Warrant and supporting documentation and samples according to the required PPAP submission level before shipping production parts to NCR. The submission level depends on factors like the part's risk level and any engineering changes.
A system (including the structure) to manage daily work, including
• Customer demand
• Best Practices and Standards
• Equipment & the workplace
• Improvement • People
Total Productive Maintenance (TPM) is a method for improving equipment effectiveness through employee involvement. It originated in Japan in 1971 as a way to improve machine availability and reduce waste. TPM involves management, operators, and maintenance working together to ensure overall equipment effectiveness. The key pillars of TPM include 5S, autonomous maintenance by operators, continuous improvement activities, planned predictive maintenance, quality maintenance, training, and safety/environmental practices. TPM is implemented in stages, starting with preparation, then introduction, implementation involving the eight pillars, and finally institutionalization so that TPM becomes the organizational culture.
Total Productive Maintenance (TPM) is a methodology for optimizing manufacturing equipment effectiveness through a team-based approach involving both maintenance and operators. The goals of TPM include maintaining equipment for its entire life, eliminating losses like defects, accidents, and failures, and empowering employees. It has eight pillars of activities including autonomous maintenance, planned maintenance, quality maintenance, and education/training. TPM aims to reduce waste and improve overall equipment effectiveness through continuous improvement efforts.
This document contains a summary of a presentation on best practices in maintenance and reliability by Ricky Smith. It discusses key topics like reliability definitions, failure patterns, predictive maintenance, FRACAS systems, and reliability metrics. It emphasizes that most equipment failures are self-induced due to issues like improper installation, maintenance, or lubrication. It also outlines steps for improving reliability like prioritizing assets, identifying maintenance strategies, and using failure data for continuous improvement. The goal is to move from reactive to proactive maintenance through practices like condition monitoring and root cause analysis.
[To download this poster, visit:
https://www.oeconsulting.com.sg/training-presentations]
The Quality Maintenance (Hinshitsu Hozen) Poster describes the systematic approach for establishing and maintaining zero-defect conditions to create 100% good products.
The poster comes in four monochrome variations. Formatted in PDF and in editable PPTX, the poster can be easily printed on an A3 or A4-sized paper from an office copier machine and displayed on employee workstations, or distributed together with your workshop handouts.
The Quality Maintenance Poster complements the 'Quality Maintenance (Hinshitsu Hozen)' training presentation materials. It serves as a takeaway and summary of your TPM and Quality Maintenance presentation.
The 8 Steps of Quality Maintenance are:
Step 1: Verify the Existing Situation
Step 2: Investigate the Processes where Defects Occur
Step 3: Identify & Analyze 4M Conditions
Step 4: Plan Action to Correct Deficiencies
Step 5: Establish Conditions that Allow Good Products to be Achieved
Step 6: Eliminate Flaws in 4M Conditions and Finalize
Step 7: Consolidate Checking Methods
Step 8: Determine Standard Values for Checks & Revise Standards
To downoad this poster, visit:
https://www.oeconsulting.com.sg/training-presentations
This document outlines a 5-year strategy for Lean Six Sigma (LSS) at a greenfield site from 2011-2015. It details goals for integrating LSS with the organization's overall strategy, conducting gap analysis workshops, developing action plans and KPIs, selecting and training Belts, and ensuring the training strategy supports yearly strategic goals. Targets increase each year, such as the percentage of targeted KPIs showing improvement and the number of Belts selected and trained.
The slides that Carl and Fred present at the 2014 RAMS conference (www.rams.org).
An overview of tasks, approaches, and structure to creating a proactive and effective reliability program in your organization.
The document discusses plant maintenance strategies and terminology. It outlines various types of maintenance including corrective, preventative, and predictive maintenance. It emphasizes the importance of aligning maintenance goals with business goals to improve processes, asset performance, and uptime. Various maintenance planning, control, and terminology are defined to effectively manage strategic assets.
JULIAN KALAC -EXAMPLES OF LEAN SIX SIGMA BLACK BELT PROJECTS Julian Kalac P.Eng
The document provides 12 examples of Lean Six Sigma projects that resulted in cost savings through process improvements. The first example describes a project that increased production capacity of HVAC duct elbows by designing a one-man cell to run three semi-automatic machines simultaneously, achieving annual savings of $472k. Another project reduced robot welding setup time from 38 minutes to zero by designing modular fixtures, achieving annual savings of $650k. A third project converted batch production to continuous flow, increasing shift capacity by 82% and eliminating the need for overtime.
This document provides guidance on implementing a daily management system using a visibility wall. It recommends establishing a purpose statement and mapping core processes. Key metrics in quality, cost, delivery, safety and morale should be displayed and regularly updated. Daily huddles should be used to review the wall, communicate events, and update progress on improvement projects and metrics. The goal is to promote transparency, accountability and continuous improvement through visual displays and team discussions.
International or large organizations need to have a systematic approach in selecting and forming their portfolios aligned with their organizational goals.
SAFe portfolio management @ Knowit nov 28Knowit_TM
The document discusses program portfolio management in SAFe. It describes the roles and responsibilities of the program portfolio management team, which includes senior executives and managers. Their responsibilities include setting the portfolio vision and strategy, allocating funding to investment themes, and governing program execution. The portfolio management team aims to transform traditional portfolio management approaches to more "agilean" approaches through practices like decentralized decision-making, continuous value delivery, light-weight business cases, and self-organizing Agile Release Trains.
The document discusses the importance of good planning for capital projects from the start. It outlines major decisions to be made in the initial phases of conceptual design (FEL 1-3) and common mistakes and traps to avoid at each stage. These include premature initiation or completion, incomplete alternative evaluation, lack of operational input, and inadequate attention to detail. Thorough planning, peer review, and risk assessment are emphasized as best practices to develop robust initial designs and set projects up for success.
This document discusses three key challenges to scaling agile adoption: distributed teams, hybrid projects, and scaling agile in general. It provides advice on overcoming these challenges, including establishing clear communication for distributed teams, creating a hybrid project management office to manage both agile and non-agile teams, and ensuring the right organizational culture and support is in place for large-scale agile transformation. Polls are included to gauge attendees' experience with these topics.
This document discusses applying Kotter's 8-step model of organizational change to adopting the Scaled Agile Framework (SAFe) at an organization. The 8 steps are: 1) Increase urgency, 2) Create a guiding coalition, 3) Develop a change vision, 4) Communicate the vision, 5) Empower others to act, 6) Produce short-term wins, 7) Don't let up, 8) Make it stick. For each step, examples are provided of how the model was applied to a SAFe adoption at American Airlines, such as gaining executive buy-in, running adoption as an agile team, and creating visible metrics and successes.
Material Selection and Design for Sustainable Material Innovation - Presentat...Ecodesign Centre (EDC)
This document discusses material selection and design for sustainable innovation. It describes a case study of an SME manufacturing company in Wales that takes a design-led approach to innovation and has a mature sustainability profile. The case study examines the company's ecodesign processes for new product developments, with a focus on material selection and how materials become embedded in its design culture. The next stages of research involve integrating a developed typology with environmental assessment results and exploring how embedded material knowledge is developed.
SAFe – A dangerous weapon. Techniques to implementing a lasting adoption of t...Yuval Yeret
Please join us on Wednesday January 27 in Burlington MA starting at 6:30 pm as senior enterprise agility coach Yuval Yeret describes several techniques that can be used to produce a lasting and productive adoption of the Scaled Agile Framework.
The Scaled Agile Framework (SAFe) is a powerful and popular framework for implementing agile at large scale across the enterprise. However many organizations see their implementation of SAFe stall and even backfire since the adoption is mandated from its organizational leaders, instead of engaged teams participating and choosing their SAFe.
In this talk we will examine some dangerous implementation anti-patterns as well as healthier alternatives. You will learn some concrete techniques that help live up to the Lean/SAFe principles of respecting and engaging people. We will discuss field-proven ideas such as pull-based crossing the chasm approach to implementation, use of open space as part of the different SAFe ceremonies, and how Open Space Agility can combine with SAFe.
This document defines key concepts in multi-criteria decision making (MCDM) including criteria, alternatives, and decisions. It provides examples of single-criterion and multiple-criteria decision problems. For multiple-criteria problems, alternatives differ in more than one criterion and criteria are often competing. Formal MCDM analysis is useful when criteria are competing and trade-offs are difficult to evaluate. The document discusses types of MCDM problems and contexts for MCDM including mutually exclusive alternatives, portfolio selection, design, and measurement.
Imagine inheriting the job leading the "business as usual" change program for Westpac's new online banking platform. Your challenge, should you choose to accept it (like you have a choice), is to “turn it Agile”. You are “gifted” a SAFe Program Consultant, not that you know what that is. So you tell them of your predicament and ask if Agile will help.
As one would expect, the Agile consultant can see the path to agility. However, the recommended approach seems somewhat unconventional. A one-week immersion program that will transform the waterfall machine into an Agile Release Train!
Tune into this session to learn how one of Australia’s largest banks adopted Agile on a mission critical application overnight.
Attendees at this session will learn the benefits and pitfalls of using SAFe’s notorious Quick Start approach to implementing Agile, and the facts about what it really takes to “Quick Start” an Agile Release Train.
Presentation to the Agile Nashville User Group, January 2015.
Are you working with multiple agile teams on a single software application? Are you looking for help with making agile work for you at the program level? Have you considered leveraging the Scaled Agile Framework (SAFe) but been scared off by its prescriptive nature? Are you confused about how program level SAFe applies in your context?
Every organisation is different and what works for one organisation may not work for another. One of the benefits of a framework, is that they can and should be adapted to your context. Based on learnings derived from practical experience, this session will illustrate how focusing on principles can help you design a pragmatic approach to program level SAFe suitable for your unique situation.
Project Management Office Roles Functions And BenefitsMaria Erland, PMP
Created to demonstrate how an organization can improve the delivery of project management services both internally and externally using best practices. A project management office, empowered to govern a project portfolio, including the prioritization process that selects projects for the portfolio, can demonstrate measurable benefits by implementing a project management office using best practices. This presentation explains the roles, functions and benefits of such an office.
The document discusses agile program and portfolio management. It begins by stating that adopting agile practices requires organizational transformation, not just overlaying processes. It then covers topics like agile competencies across different levels (team, program, portfolio, enterprise), managing work across time horizons (continuous, daily, iteration, release, strategic), and using story maps to decompose work from epics to features to user stories. Finally, it discusses key aspects of agile such as sprinting, velocity, and prioritizing minimally marketable features.
Development project appraisal and sd(L6)1Farha Sharmin
The document discusses project appraisal for sustainable development. It defines a project and outlines the project cycle, which includes identification, preparation, approval, appraisal, implementation, monitoring, and evaluation. It describes the objectives, scope, and methods of project appraisal, including financial, economic, technical, social, and environmental analyses. The key goals of appraisal are to ensure resources are used effectively and the project benefits outweigh the costs.
This document defines the key deliverables and tasks for quantifying the value of a project. Deliverable 3D involves quantifying the project value by determining the benefits to customers and the organization. This includes calculating the cost of poor quality using baseline data and estimating savings. Project benefits are documented in the project benefit document and summarized in the project charter and final presentation.
This document outlines the steps to quantify the value of a project in Deliverable 3D. It defines cost of poor quality (COPQ) and explains how to calculate savings from a project, including hard savings from expense reductions and revenue growth, and soft savings from increased capacity or avoided costs. Benefits should be documented in the project charter, presentation, and final report to complete Deliverable 3D. Quantifying value helps prioritize projects and shows expected returns from improvements.
8.06 Project Risk Management_Project Life Cycle.pptxIftekarHasnine
This document discusses risks associated with project implementation and management. It covers risk identification, analysis, assessment, and monitoring processes. Key points include:
- Risk management involves identifying, analyzing, mitigating risks to successfully implement a project.
- Various project risks include financial, technical, execution, legal, contractual, operational, and strategic risks.
- Feasibility studies help identify risks by analyzing technical, financial, economic, environmental, market, operational, legal, and social feasibility.
- Risk analysis and mitigation measures are important parts of project documents like the Development Project Proposal.
Dwayne Davis has over 25 years of experience in project controls functions including cost engineering, budgeting, project management, and risk management. He currently works as a Senior Project Controls Analyst for ICE Inc at MacDill AFB in Tampa, FL where he monitors costs and forecasts spending for a $30M program. Prior experience includes positions as a Lead Cost Engineer, Cost Engineer, Project Controls Manager, and General Manager on power and refinery projects in locations such as North Carolina, Pennsylvania, Florida, Hong Kong, Ghana, and Trinidad.
- The annual performance review assessed the portfolio performance and development results of IFAD projects in Asia and the Pacific. While 55% of new projects were expected to meet objectives, portfolio and disbursement growth needs to be contained.
- Supervision of ongoing projects faced challenges including uneven report quality, insufficient results reporting, and low supervision quality for regional grants. Financial management and M&E issues affected over 30% and 36% of projects respectively.
- Development effectiveness targets were mostly met or exceeded, but monitoring and evaluation systems need strengthening in many projects to better understand impacts. An action plan was put in place to address key issues.
Impress your clients by clearly defining base elements of the project and other project planning activities by using our kick-off meeting PowerPoint presentation slides. This project management kick-off meeting PowerPoint template consists a total of 28 ready to use slides like meeting agenda, project description, project scope, core team, project management team, responsibility assignment matrix, project management cycle, work breakdown structure, project cost estimate, project communication plan, project management Gantt chart, project tracking plan and many such slides. All the slides in this project kick-off meeting agenda are completely editable and can be adjusted as per individual requirements and needs. Be it the explaining your services to the client or to your internal team, this kick-off management PPT deck can be used for a crisp, short and very to the point explanation. The diagrams and visuals used in this kick-off agenda slideshow are attractive and self-explanatory to place the content in a stylish manner. Elaborate on holistic healing with our Kickoff Meeting Powerpoint Presentation Slides. Give due importance to the human element. https://bit.ly/3k7HbvF
The document discusses the challenges of achieving world-class project delivery in the energy sector. It notes that energy sector capital expenditures are expected to reach $38 trillion by 2035 but that project performance is declining, with over 50% budget overruns increasing from 10% in 1997 to 28% in 2011. The key challenges for projects are resources, technical difficulties, governance, stakeholders, supply chain, and processes. It then outlines a model for world-class capital project delivery across six elements and sixteen sub-elements. Priorities for achieving world-class performance include standardization, focus on early project definition, effective resources and team engagement, supply chain and stakeholder management, planning and risk management, and governance.
The document discusses the key aspects of capital budgeting and project management. It covers the capital budgeting process, types of projects, project organization structures, stages of setting up a project including feasibility analysis, and techniques for project planning and control such as work breakdown structure, critical path method, reserve activity target scheduling and line of balance. The overall goal of capital budgeting is to identify investments that will increase business value by generating returns higher than their costs.
Impress your clients by clearly defining base elements of the project and other project planning activities by using our kick-off meeting PowerPoint presentation slides. This project management kick-off meeting PowerPoint template consists a total of 28 ready to use slides like meeting agenda, project description, project scope, core team, project management team, responsibility assignment matrix, project management cycle, work breakdown structure, project cost estimate, project communication plan, project management Gantt chart, project tracking plan and many such slides. All the slides in this project kick-off meeting agenda are completely editable and can be adjusted as per individual requirements and needs. Be it the explaining your services to the client or to your internal team, this kick-off management PPT deck can be used for a crisp, short and very to the point explanation. The diagrams and visuals used in this kick-off agenda slideshow are attractive and self-explanatory to place the content in a stylish manner. Elaborate on holistic healing with our Kickoff Meeting PowerPoint Presentation Slides. Give due importance to the human element.
Project appraisal involves a comprehensive pre-investment analysis of all aspects of a proposed project, including market, technical, financial, socio-economic, and ecological factors. The analysis assesses feasibility and investment worthiness. Key aspects examined are market demand, production requirements, input availability, profitability, social and environmental impacts, and risks. A thorough appraisal helps decision-makers determine if a project is viable and the right choice.
Nuclear Sector Deal webinar series 2021. Cost reduction in nuclear new build....RomanaVysatova
The document provides information about an online event on the Nuclear Sector Deal (NSD). It includes sections on housekeeping, questions, troubleshooting, sponsors, poll questions, targets, and the webinar series schedule. The document outlines that attendees will be muted and their cameras off, the meeting will be recorded, and there are instructions for asking questions and chatting. It also presents poll questions on understanding of the NSD and the cost reduction target.
The document provides guidance for project tollgates at Tollgate Guiding Thoughts. Tollgates will focus on the 15 deliverable format and demonstrating the logical thought process through each project phase. Presentations should show work to complete a phase and tasks/dates for the next phase, and identify any barriers needing assistance. The primary tools listed are suggested but not mandatory ways to show project progression.
Presenting this set of slides with name - Project Kickoff Meeting Agenda Powerpoint Presentation Slides. All slides are completely editable and professionally designed by our team of expert PowerPoint designers. The presentation content covers all areas of Project Kickoff Meeting Agenda Powerpoint Presentation Slides and is extensively researched. This ready-to-use deck comprises visually stunning PowerPoint templates, icons, visual designs, data-driven charts and graphs and business diagrams. The deck consists of a total of twenty three slides. You can customize this presentation as per your branding needs. You can change the font size, font type, colors as per your requirement. Download the presentation, enter your content in the placeholders and present with confidence.
The document discusses project management techniques including project planning, scheduling, and controlling. It describes tools like the work breakdown structure, Gantt charts, critical path method (CPM), and program evaluation and review technique (PERT) that are used to define projects, relate activities, and monitor schedule and resources. Bechtel is provided as an example of a large project management firm that uses these techniques to manage complex global construction projects.
KDP C is an important decision point for NASA projects where the agency decides whether to proceed to implementation and commits to a project's cost and schedule estimates. This panel discusses updated NASA processes to help ensure projects are on track for technical success within budget and schedule by KDP C. These include developing an integrated baseline, independent reviews, and documenting approvals and commitments in a decision memorandum to formalize support and establish external commitments. The integration of baseline development, independent checks, approval to proceed, and commitments is meant to help projects successfully complete implementation.
The primary funding for the Society of Petroleum Engineers Distinguished Lecturer Program is provided by member donations to The SPE Foundation and a contribution from Offshore Europe. The program also receives support from companies that allow their employees to serve as lecturers and from AIME. The January 2020 tour lecture focuses on thriving in a lower oil price environment, including topics such as market dynamics, keys to success, technology impacts, and takeaway points.
Backlog, Deferred Maintenance and its use in PlanningSightlines
This document discusses strategies for prioritizing deferred maintenance projects and developing a multi-year capital plan. It recommends categorizing buildings into portfolios based on investment strategy and condition. Funding should be allocated to portfolios and specific project types based on institutional priorities and investment criteria. A transitional portfolio is suggested for buildings slated for demolition or sale. The goal is to develop a comprehensive, strategic plan to address deferred maintenance needs over multiple years.
The document discusses scope creep, providing cases and preventative actions. It defines scope and scope creep, noting that scope creep is a common issue on many projects that can lead to going over budget and missing deadlines. The document then provides tips for controlling scope creep such as thoroughly understanding requirements, having a well-defined WBS, using change control forms, and expect some scope creep to occur. It encourages sharing lessons learned from experience to help improve projects and careers.
Satta matka fixx jodi panna all market dpboss matka guessing fixx panna jodi kalyan and all market game liss cover now 420 matka office mumbai maharashtra india fixx jodi panna
Call me 9040963354
WhatsApp 9040963354
SATTA MATKA DPBOSS KALYAN MATKA RESULTS KALYAN CHART KALYAN MATKA MATKA RESULT KALYAN MATKA TIPS SATTA MATKA MATKA COM MATKA PANA JODI TODAY BATTA SATKA MATKA PATTI JODI NUMBER MATKA RESULTS MATKA CHART MATKA JODI SATTA COM INDIA SATTA MATKA MATKA TIPS MATKA WAPKA ALL MATKA RESULT LIVE ONLINE MATKA RESULT KALYAN MATKA RESULT DPBOSS MATKA 143 MAIN MATKA KALYAN MATKA RESULTS KALYAN CHART
SATTA MATKA DPBOSS KALYAN MATKA RESULTS KALYAN MATKA MATKA RESULT KALYAN MATKA TIPS SATTA MATKA MATKA COM MATKA PANA JODI TODAY BATTA SATKA MATKA PATTI JODI NUMBER MATKA RESULTS MATKA CHART MATKA JODI SATTA COM INDIA SATTA MATKA MATKA TIPS MATKA WAPKA ALL MATKA RESULT LIVE ONLINE MATKA RESULT KALYAN MATKA RESULT DPBOSS MATKA 143 MAIN MATKA KALYAN MATKA RESULTS KALYAN CHART KALYAN CHART
AI Transformation Playbook: Thinking AI-First for Your BusinessArijit Dutta
I dive into how businesses can stay competitive by integrating AI into their core processes. From identifying the right approach to building collaborative teams and recognizing common pitfalls, this guide has got you covered. AI transformation is a journey, and this playbook is here to help you navigate it successfully.
DPBOSS | KALYAN MAIN MARKET FAST MATKA RESULT KALYAN MATKA | MATKA RESULT | KALYAN MATKA TIPS | SATTA MATKA | МАТКА СОМ | MATKA PANA JODI TODAY | BATTA SATKA MATKA PATTI JODI NUMBER | MATKA RESULTS | MATKA CHART | MATKA JODI | SATTA COM | FULL RATE GAME | MATKA GAME | MATKA WAPKA | ALL MATKA RESULT LIVE ONLINE | MATKA RESULT | KALYAN MATKA RESULT | DPBOSS MATKA 143 | MAIN MATKA MATKA NUMBER FIX MATKANUMBER FIX SATTAMATKA FIXMATKANUMBER SATTA MATKA ALL SATTA MATKA FREE GAME KALYAN MATKA TIPS KAPIL MATKA GAME SATTA MATKA KALYAN GAME DAILY FREE 4 ANK ALL MARKET PUBLIC SEVA WEBSITE FIX FIX MATKA NUMBER INDIA.S NO1 WEBSITE TTA FIX FIX MATKA GURU INDIA MATKA KALYAN CHART MATKA GUESSING KALYAN FIX OPEN FINAL 3 ANK SATTAMATKA143 GUESSING SATTA BATTA MATKA FIX NUMBER TODAY WAPKA FIX AAPKA FIX FIX FIX FIX SATTA GURU NUMBER SATTA MATKA ΜΑΤΚΑ143 SATTA SATTA SATTA MATKA SATTAMATKA1438 FIX МАТКА MATKA BOSS SATTA LIVE ЗМАТКА 143 FIX FIX FIX KALYAN JODI MATKA KALYAN FIX FIX WAP MATKA BOSS440 SATTA MATKA FIX FIX MATKA NUMBER SATTA MATKA FIXMATKANUMBER FIX MATKA MATKA RESULT FIX MATKA NUMBER FREE DAILY FIX MATKA NUMBER FIX FIX MATKA JODI SATTA MATKA FIX ANK MATKA ANK FIX KALYAN MUMBAI ΜΑΤΚΑ NUMBER
SATTA MATKA DPBOSS KALYAN MATKA RESULTS KALYAN CHART KALYAN MATKA MATKA RESULT KALYAN MATKA TIPS SATTA MATKA MATKA COM MATKA PANA JODI TODAY BATTA SATKA MATKA PATTI JODI NUMBER MATKA RESULTS MATKA CHART MATKA JODI SATTA COM INDIA SATTA MATKA MATKA TIPS MATKA WAPKA ALL MATKA RESULT LIVE ONLINE MATKA RESULT KALYAN MATKA RESULT DPBOSS MATKA 143 MAIN MATKA KALYAN MATKA RESULTS KALYAN CHART
➒➌➎➏➑➐➋➑➐➐ Satta Matka Dpboss Matka Guessing Indian Matka KALYAN MATKA | MATKA RESULT | KALYAN MATKA TIPS | SATTA MATKA | MATKA.COM | MATKA PANA JODI TODAY | BATTA SATKA | MATKA PATTI JODI NUMBER | MATKA RESULTS | MATKA CHART | MATKA JODI | SATTA COM | FULL RATE GAME | MATKA GAME | MATKA WAPKA | ALL MATKA RESULT LIVE ONLINE | MATKA RESULT | KALYAN MATKA RESULT | DPBOSS MATKA 143 | MAIN MATKA
Adani Group Requests For Additional Land For Its Dharavi Redevelopment Projec...Adani case
It will bring about growth and development not only in Maharashtra but also in our country as a whole, which will experience prosperity. The project will also give the Adani Group an opportunity to rise above the controversies that have been ongoing since the Adani CBI Investigation.
SATTA MATKA SATTA FAST RESULT KALYAN TOP MATKA RESULT KALYAN SATTA MATKA FAST RESULT MILAN RATAN RAJDHANI MAIN BAZAR MATKA FAST TIPS RESULT MATKA CHART JODI CHART PANEL CHART FREE FIX GAME SATTAMATKA ! MATKA MOBI SATTA 143 spboss.in TOP NO1 RESULT FULL RATE MATKA ONLINE GAME PLAY BY APP SPBOSS
KALYAN CHART SATTA MATKA DPBOSS KALYAN MATKA RESULTS KALYAN MATKA MATKA RESULT KALYAN MATKA TIPS SATTA MATKA MATKA COM MATKA PANA JODI TODAY BATTA SATKA MATKA PATTI JODI NUMBER MATKA RESULTS MATKA CHART MATKA JODI SATTA COM INDIA SATTA MATKA MATKA TIPS MATKA WAPKA ALL MATKA RESULT LIVE ONLINE MATKA RESULT KALYAN MATKA RESULT DPBOSS MATKA 143 MAIN MATKA KALYAN MATKA RESULTS KALYAN CHART
Enhancing Adoption of AI in Agri-food: IntroductionCor Verdouw
Introduction to the Panel on: Pathways and Challenges: AI-Driven Technology in Agri-Food, AI4Food, University of Guelph
“Enhancing Adoption of AI in Agri-food: a Path Forward”, 18 June 2024
[To download this presentation, visit:
https://www.oeconsulting.com.sg/training-presentations]
Unlock the full potential of the MECE (Mutually Exclusive, Collectively Exhaustive) Principle with this comprehensive PowerPoint deck. Designed to enhance your analytical skills and strategic decision-making, this presentation guides you through the fundamental concepts, advanced techniques, and practical applications of the MECE framework, ensuring you can apply it effectively in various business contexts.
The MECE Principle, developed by Barbara Minto, an ex-consultant at McKinsey, is a foundational tool for structured thinking. Minto is also renowned for the Minto Pyramid Principle, which emphasizes the importance of logical structuring in writing and presenting ideas. This presentation includes a clear explanation of the MECE principle and its significance. It offers a detailed exploration of MECE concepts and categories, highlighting how to create mutually exclusive and collectively exhaustive segments. You will learn to combine MECE with other powerful business frameworks like SWOT, Porter's Five Forces, and BCG Matrix. Discover sophisticated methods for applying MECE in complex scenarios and enhancing your problem-solving abilities. The deck also provides a step-by-step guide to performing thorough and structured MECE analyses, ensuring no aspect is overlooked. Insider tips are included to help you avoid common mistakes and optimize your MECE applications.
The presentation features illustrative examples from various industries to show MECE in action, providing practical insights and inspiration. It includes engaging group activities designed for the practice of the MECE principle, fostering collaborative learning and application. Key takeaways and success factors for mastering the MECE principle and applying it in your professional work are also covered.
The MECE Principle presentation is meticulously designed to provide you with all the tools and knowledge you need to master the MECE principle. Whether you're a business analyst, manager, or strategist, this presentation will empower you to deliver insightful and actionable analysis, drive better decision-making, and achieve outstanding results.
LEARNING OBJECTIVES:
1. Understand the MECE Principle
2. Improve Analytical Skills
3. Apply MECE Framework
4. Enhance Decision-Making
5. Optimize Resource Allocation
6. Facilitate Strategic Planning
➒➌➎➏➑➐➋➑➐➐ Satta Matka Dpboss Matka Guessing Indian Matka Satta Matta Matka KALYAN MATKA | MATKA RESULT | KALYAN MATKA TIPS | SATTA MATKA | MATKA.COM | MATKA PANA JODI TODAY | BATTA SATKA | MATKA PATTI JODI NUMBER | MATKA RESULTS | MATKA CHART | MATKA JODI | SATTA COM | FULL RATE GAME | MATKA GAME | MATKA WAPKA | ALL MATKA RESULT LIVE ONLINE | MATKA RESULT | KALYAN MATKA RESULT | DPBOSS MATKA 143 | MAIN MATKA
Tired of chasing down expiring contracts and drowning in paperwork? Mastering contract management can significantly enhance your business efficiency and productivity. This guide unveils expert secrets to streamline your contract management process. Learn how to save time, minimize risk, and achieve effortless contract management.
6. What is a Program?
6
A group of related projects managed in a coordinated
way to obtain benefits and control not available from
managing them individually.
Program
Project 1 Project 2 Project 3 Program 1 Project 4
Project 5 Project 6
Reference: PMI (2008), A Guide to Project Management Body of Knowledge, 4th Edition
7. What is a Project Portfolio ?
A collection of projects or programs and other work that
are grouped together to facilitate effective management
of that work to meet strategic business objectives.
7
Portfolio
Portfolio 1 Program 1 Program 2 Project 1
Program 3 Project 2 Project 3 Project 6 Project 7 Project 8
Project 4 Project 5
Project 9 Program 4
Project 10 Project 11 Project 12
Reference: PMI (2008), A Guide to Project Management Body of Knowledge, 4th Edition
8. 8
Portfolio Manager
Common Career Path
Technical – Leadership – Management – Communication
Reference: 2014 CII annual conference – RT 303 implementation session
10. Research Team
10
No. Owners
1 Charlie O’Hanlon (Chair) Architect of the Capitol
2 Frederick Delie Georgia Pacific LLC
3 Roger Haynes ConocoPhillips
4 Roger Holtzclaw BP Alternative Energy
5 Richard Ikasalo SABIC
6 John Logan Irving Oil Limited
7 Shaun Tatum Southern Company
8 Timothy Wolf Anheuser-Busch InBev
9 David Wilson BP Project Performance
No. Contractors
1 Marie Robinson (Vice Chair) Jacobs
2 Scott Bergoon Hargrove Engineers
3 James Dyer WorleyParsons
4 Mohamed El-Mehalawi Faithful+Gould
5 Robert Bailey Fluor Corporation
6 Vincent Huang Parsons
7 Gary Lanier URS Corporation
8 Sandra MacGillivray Coreworx, Inc.
11. Research Goals
11
• Understand the portfolio management problems
• Identify techniques, tools, metrics and processes
recommended for portfolio management
• Recommend practices to help improve overall
portfolio management
12. Research Methodology
12
Collect
Data
• Survey
• Interviews
• Case Studies
Analyze
Data
• Identify Business Drivers
• Identify Recommended Practices
Develop
Tool
• Portfolio
Management
Playbook
13. Recommended Process for Portfolio Performance Management
13
1. Determine Key
Results Areas (KRAs)
2. Establish Key
Performance Indicators
(KPIs)
3. Collecting Data
and Reporting
Results
4. Evaluating the Portfolio
Performance
Management Process
14. Key Result Areas (KRAs) for PPM
14
• Schedule
• Cost / Cash Flow
• Safety and Environment
• Change Management / Scope
• Resource Allocation
• Procurement and Supply-Chain Management
• Quality
• Risk Management
• Client Satisfaction
16. Sample Dashboard
16
$30 m
CURRENT YEAR
$25 m
Planned vs Actual / Reforecast
(Current Year)
BaseLine Forecast #### #### #### ### ### ### ### ### ### ### ### ###
Actual Re-Forecast #### #### #### ### ### ### ### ### ### ### ### ###
Cumulative Base Forecast #### #### #### ### ### ### ### ### ### ### ### ###
$20 m
Cost ($m) Gross
Cumulative Base Re-Forecast #### #### #### ### ### ### ### ### ### ### ### ###
$15 m
Next 12 Months
$10 m
$5 m
Actual Base Forecast
Actual Re-Forecast
Cumulative Base Forecast
Cumulative Base Re-Forecast
Sep-13
Oct-13
Nov-13
Dec-13
Jan-14
Feb-14
Mar-14
Apr-14
May-14
Jun-14
Jul-14
Aug-14
1 1 1 1 1 2 2 2 2 2 2 2
2 2 2 2 2 2 2 3 3 3 3 3
2 2 2 2 3 3 3 3 3 3 3 3
3 4 4 4 4 4 4 4 4
2 2 2 2 2 2 2 2 2 2 3 3
2 2 2 2 3 3 3 3 3 3 3 4
2 2 2 2 2 2 2 2 2 3 3 3
1
4 4 4
2 2 2 2 2 2 2 2 2 2 2 2
2 2 3 3 3 3 4 4 4 4 4 4
1 1 1 1 1 2 2 2 2 2 2 2
1 1 2 2 2 2 2 2 2 3 3 3
1 1 1 1 2 2 2 2 2 2 2 3
1 1 1 1 1 2 2 2 2 2 2 2
1 1 1 1 1 1 1 1 1 1 1 2
1 1 1 1 1 1 1 1 1 2 2 2
Schedule Performance
HCFC Replacement
Tiger Decommissioning
Baku Cond Lines
Timber Gas Lift
Beachfield Flare
GH Platform Removal
Marine Vapour Management
NE Decommissioning
Sun Decommissioning
Prep for wells (BD50)
NH500 QD Project
Risk Management
Potential High Consequence Risks (D+) (Held by Projects)
ID
1 Incident occurring during Hot Work
D 4
2 Collision: Vessel Operations
D 4
3 West crane removal: Dropped objects
D 3
4 PAU Collision with live plant
D 3
5 Loss of control over live plant
D 4
6 Incident occurring during Hot Work
D 4
7 HLV proximity to platform
C 3
8 Dropped module/collision - HLV lifting operations
D 3
9 D 3
10 D 4
11 D 2
12 C 2
13 D 4
14 D 4
15 C 3
16 D 4
PDRI PDRI 1PDRI 2PDRI 2iPDRI 3
Target 550 450 300 150
Actual 700 625 330 180
Stage 2 11
Legend
Cost Performance (Current Month - Cumulative)
Actual / Re-forecast
No of
Project Stage
Stage 1
Stage 3
Stage 4
7 10%
Planned
No of
Months
Stage 1 Stage 2 Stage 3 Stage 4
Risk Table
Cost ($m)
Planned Actual Variance
Cost Performance (Year End - Cumulative)
Planned Forecast Variance
Severity
Severity
Freq'y
Project
Stage
Freq'y 5 6
Stage 2
F
G
H
Failure of Personnel Transfer System
Active
Active
Active
Active
Stage 2
Stage 2
Stage 2
Stage 2
Stage 2
Stage 2
Active
Active
Active
Active
Active
Active
Active
Active
Active
Active
Cost Performance
0
D
E
Stage 2
Stage 2
Stage 2
Active
Project Title
Baku Cond Lines
Project Listing
Enhanced Power Upgrade
Insecure HLV anchoring
HLV Loss of Stability: HLV Capsize
Active
$211.4 $217.7 2.98%
A
B
C
Stage 2
Risk
Status
Variation
9 11 16%
Schedule
Index
Stage 4
Stage 2
Stage 2
Stage 2
Stage 2
Leading Indicators
Front End Loading (Stage 2 & Stage 3)
Overall Cycle Time (Stage 2 to Stage 4)
13
-11%
7
17%
1 2 3 4
GH Platform Removal
GH Platform Removal
GH Platform Removal
Prep for wells (BD50)
Sun Decommissioning
Sun Decommissioning
5%
1.15
0.87
8%
-20% 0.80
46
51
20
41
54
19
26 21
Overall Cycle Time (Stage 1 to end Stage 4)
Cost Performance (Current Month)
Cost ($m)
Planned Actual Variance
$19.5 $16.2 -16.92%
Jan-13
Feb-13
Mar-13
Apr-13
May-13
Jun-13
Jul-13
Aug-13
Sep-13
Oct-13
Nov-13
Dec-13
$147.6 $141.0 -4.47%
Cost ($m)
Jun-14
May-14
Jul-14
Aug-14
Sep-14
Leading Indicators
Oct-13
Nov-13
Dec-13
Jan-14
Feb-14
Mar-14
Apr-14
BW Gas Separation
GS Fire & Gas Project
XP900 Accommodations
Quad 205 Polymer Project
DRAMP
Prep for wells (BD50)
7 8
Prep for wells (BD50)
HCFC Replacement
HCFC Replacement
HCFC Replacement
Beachfield Flare
Beachfield Flare
Beachfield Flare
Timber Gas Lift
Risk Title
Primary barrier against gas-lift pressure failure: Casing Bursts
Dredging: Platform stability compromised
HLV Loss of Stability: HLV Capsize
Failure of Personnel Transfer System
E-W Crane move: DroppedObjects
$211
$218
$ m
Jan-13 Feb-13 Mar-13 Apr-13 May-13 Jun-13 Jul-13 Aug-13 Sep-13 Oct-13 Nov-13 Dec-13
BaseLine Forecast $ 14.6 m $ 14.6 m $ 14.6 m $ 15.1 m $ 15.1 m $ 15.1 m $ 19.5 m $ 19.5 m $ 19.5 m $ 21.3 m $ 21.3 m $ 21.3 m
Actual/Re-Forecast $ 15.6 m $ 13.4 m $ 12.1 m $ 16.5 m $ 15.3 m $ 19.4 m $ 15.9 m $ 16.6 m $ 16.2 m $ 24.0 m $ 25.1 m $ 27.6 m
Cumulative Base Forecast $ 14.6 m $ 29.2 m $ 43.8 m $ 58.9 m $ 74.0 m $ 89.2 m $ 108.6 m $ 128.1 m $ 147.6 m $ 168.9 m $ 190.1 m $ 211.4 m
Cumulative Actual/Re-Forecast $ 15.6 m $ 29.0 m $ 41.1 m $ 57.5 m $ 72.9 m $ 92.2 m $ 108.2 m $ 124.8 m $ 141.0 m $ 165.0 m $ 190.1 m $ 217.7 m
PDRI 1 PDRI 2 PDRI 2i PDRI 3
800
700
600
500
400
300
200
100
0
Actual 700 625 330 180
Target 550 450 300 150
Score
Project Definition Rating Index (PDRI)
4 1 2
5 6
7
8
9
11
3
10
12
13 14 16
15
17. 17
Implementation Report-Final Products
Three documents:
• IR - Implementation Report
• RS - Research Summary
• RR - Research Report
Reference: https://www.construction-institute.org/scriptcontent/index.cfm
18. 18
Dissertation
Project Portfolio Formation
Goals:
• Alignment with organizational goals
• Portfolio Balance (project types, risks, and
markets)
• Maximize the value of portfolio
• Choose the optimal next project
19. 19
Decision-Making Methods
Decision Analysis
Methods
Single Criterion
Decision Making
Decision Making
Groups
Multi-Criteria
Decision Making
(MCDM)
Influence Diagram
(ID)
Decision Tree
(DT)
Multiple Objective
Decision Making (MODM)
Multiple Attribute
Decision Making (MADM)
PROMETHEE ELECTRE
Multiple
Attribute Utility
Theory (MAUT)
Analytical
Hierarchy
Process (AHP)
Benefit-Cost
Analysis
Elementary
Methods
Pros and Cons
Analysis
Maximin and
Maximax
Methods
Conjunctive
and Disjunctive
Methods
Lexicographic
Method
Outranking
Methods
Simple Multi-
Attribute Rating
Technique (SMART)
20. 20
PROMETHEE
Preference Ranking Organization METHod for the
Enrichment of Evaluations
http://www.promethee-gaia.net/software.html
I am Reza Masoumi, PhD candidate of construction management. I am the TA of this course and Prof. Eckelman ask me to give you a presentation on my research because he was planning to go to a trip this week.
I can not jump into this topic without defining project, program, and then portfolio. So first of all, it is required to get familiar with the meaning of project, program, and portfolio, and how management can influence a project portfolio.
Through this presentation, I will talk about the two years research that I was engaged with on managing a portfolio of projects-metrics to measure. This research was supported by the CII (construction industry institute). The organization that connects industries to universities to come up with break through solutions for industry issues.
At the end, the project portfolio formation that I am working on for my dissertation will be talked about. And I will show a demo on multicriteria decision making methods to learn how useful these method could be even for day-to-day hard decision making. The method that I will talk about is PROMETHEE, a European based multicriteria decision making method. And You may know that Analytical Hieararchy process (AHP) is the Amercian based method.
Project based on project management body of knowledge or (PMBOK) is a temporary endeavor undertaken to create a unique product or service. PMBOK is the standard of project management which has been completed over time. It has nine knowledge or management areas which defines generally the processes of different management areas with their inputs and outputs. The processes are general because it is not applicable to define one process for all the organizations due to different organizational structure.
When you hear the word project, what types of projects come up into your mind. Totally based on the Construction Industry Institute or in summary CII definition, there are four various types of business sectors: building, infrastructure, light industry, and heavy industry. Here you see a couple of pictures on different types of projects.
All project have these characteristics: they are temporary-have start and finish time, unique and unrepeatable-even two similar projects consume different resources, restricted with some criteria such as time, cost, quality, and environment; with definitive objectives or goals. The goal can be the capacity, improving the quality, customer satisfaction.
There is always a trade-off among the important factors in a project. If there are three factors, it is shown with a triangle and four factors make a rectangular. Five makes a heptagonal. Six makes a hexagonal.
What is a program? Based on PMI definition in PMBOK glossary, Program is a group of related projects that are managed together to obtain benefits. If these projects are managed individually the benefits can not be obtained. This is the standard for program management by PMI. And the figure shows that program includes projects and other programs.
Project portfolio is a collection of projects and programs which are related or unrelated to each other and are managed together to facilitate effective management of the work to achieve the goals of the organization. It has a standard the same as project and program. The figure shows that a portfolio can include several project, programs, or portfolios.
What is management? Management always wants to consume efficient resources to achieve the goals. The resources is not just money, but human resources, equipment, software, computers, and whatever used in doing the work.
This is the career path for a portfolio manager. Every one should starts from the project engineer position then promote to project manager position according to his/her capabilities in management and communication and finally to portfolio management. A portfolio manager should have all these expertise. Technical, leadership, management, and communication.
My research title was … which was supported by CII.
We were a team of 17 organizations, 9 owners, 8 contractors, in different industry sectors and three universities which our university was the principal on this research and Prof. Touran was the principal investigator of this research.
The research on managing a portfolio of projects followed three goals. Understanding current problems in portfolio management, identifying tools, techniques, and practices which are being used by organizations in portfolio management and introduce these useful practices to other organizations to improve their portfolio management.
To achieve the three goals, team decided about the research methodology which includes three stages, Collect Data, Analyze Data, and Develop Tool. The research methodology was covered in three stage. The first stage is collect data includes an online survey, interviews, and case studies. From the organizations responses to the survey questions, we identified 15 organizations who have advance practices within their organizations. And then, based on the interviews, six organizations were selected for further study and the case studies are developed based on interviews with these organizations. Based on the gathered information, we analyze the data to identify any trends in owner and contract organizations and finally prepared the outcome of the research called portfolio management playbook.
We proposed this four steps process for portfolio performance management. It starts from identifying the KRA, that I will explain in next slide, then selecting appropriate KPIs, collecting data to calculate the KPIs, and eventually evaluate the portfolio performance process. The portfolio performance can be shown graphically in format of a dashboard.
These are the nine important KRAs that stakeholders are usually interested on.
And this slide shown the KPIs or metrics to measure the performance of each of the KRAs.
The metrics or KPIs can be included in a dashboard for visualization. Because managers at the top organizational level usually interested to visually hhavve some interoperations of the their projects portfolios. When we talk about dashboard the first thing that come to mind is the car dashboard. Actually the dashboard for visualizing portfolio performance originated from the car dashboard which includes several indicator in different style to show the performance of the car. Here is an actual example of a portfolio dashboard which includes bar chart, color coded tables, and bubble graphs. Usually dashboards include three color-coded traffic light or dial. Red shows the bad situation, green good, and yellow is somewhere between.
These are the output document of our research. CII researches usually have three various documents including IR or …, RS or …, and RR or … . The cover page of IR and RS are shown here. The RR has not finalized yet and we are working on it.
What I am working on for my dissertation is about project portfolio formation. Portfolio formation follows three goals, …
This the hierarchy of decision making methods. Some of the methods are easy and some complicated. You know about the decision tree under single criterion decision making and maybe linear programming under multiple objective decision making. What I am using in my dissertation is PROMETHEE and AHP. One of the methods is European and the other one is American invested method. I am going to use the PROMETHEE method in an example because it has a software that is available for academic purposes free of charge.
PROMETHEE stands for ….This is the interface of the software.
All the multi-criteria decision making problems include several criteria and alternatives. Having more than two criteria with various ideal values, I mean some the criteria are interested to be maximized and other minimized make the decision making problem hard task. Using the multiple criteria decision making methods helps to optimize the decision making problem.
In this example, we have four types of cars and six criteria that two of them have minimum ideal value and four maximum.
If you enter all the criteria for different alternatives, and give a weight to each criterion that here I considered one for all the criteria which is not close to reality, because in reality different criteria have different weight. Any way, based on these information the rank of the four cars can be identified.
Here is the rank of alternatives. Phi is called net flow value that is the different between phi+ and phi-. phi+ is positive net flow, and phi- is negative net flow. Phi+ shows how well the alternative outrank other alternatives, and phi- shows how the alternatives is outranked by other alternatives. So, the higher the phi+ and the lower the phi- is better.
The output spreadsheet shows the answers that are similar to the software results. Using @Risk with the Ex-PROMETHEE worksheet helps to probabilistically evaluate the rank of alternatives. These are different types of distribution that you have through this course. These can be used for the input variables to calculate the PDF or CDF of the output variables.
I used normal distribution for fuel consumption criterion with mean values given in the table and standard deviation 10% of the values of mean values. The outputs are shown on box-whisker plot. It is obvious that within 25-75 percentile, two of the alternatives can different ranks.