Download as PDF, PPTX

![Example: ROI Report
• Revenue generators: 1.25 (spent $1M, generated $1.25M) [30% of total spend]
• Cost reduction: 1.15 (spent $1M, estimated reduction $1.15M) [40%]
• Others (spent x) [30%]
• Value points predictability: .85 (planned 1000VP, actual 850VP)
• Non dollar value delivered: 2.5 (spent $1M, estimated value of $2.5M)
• Decrease first quarter post release usability defects by 40% (2000 defects, from 5000 to 3000)
• Increased the number of users by 100% (from 1M to 2M users)
• Note: often these CAN be monetized.
• Portfolio Spend Per initiative Type
• Cost of failed initiatives: ($x) 11%
• Cost of poor quality: ($y) 12%
• Invested in new markets: ($z) 9%
• Invested in current capabilities: ($a) 49%
• Invested in modernization: ($b) 10%
• Invested in innovations ($c) 9%
36
Revenue
Generation
30%
Cost Reduction
40%
Others
30%
% IT Budget 2015
1.245 1.285
1.4375
1.1 1.13
1.25
1.08 1.11 1.15
0
0.2
0.4
0.6
0.8
1
1.2
1.4
1.6
1 2 3
ROI
ROI Trend Last Three Years
Average ROI Revenue Generation Cost Reduction
Cost of Failed
Projects
11%
Cost of Poor
Quality
12%
Invested in
Markets
9%
Invested in
Current
Capabilities
49%
Invested in
Modernization
10%
Invested in
Innovations
9%
% IT Budget](https://image.slidesharecdn.com/agileportfoliomanagementfinal-180405185322/75/Optimize-Portfolio-Performance-with-Simple-Agile-Techniques-and-Jira-Part-1-2-22-2048.jpg)
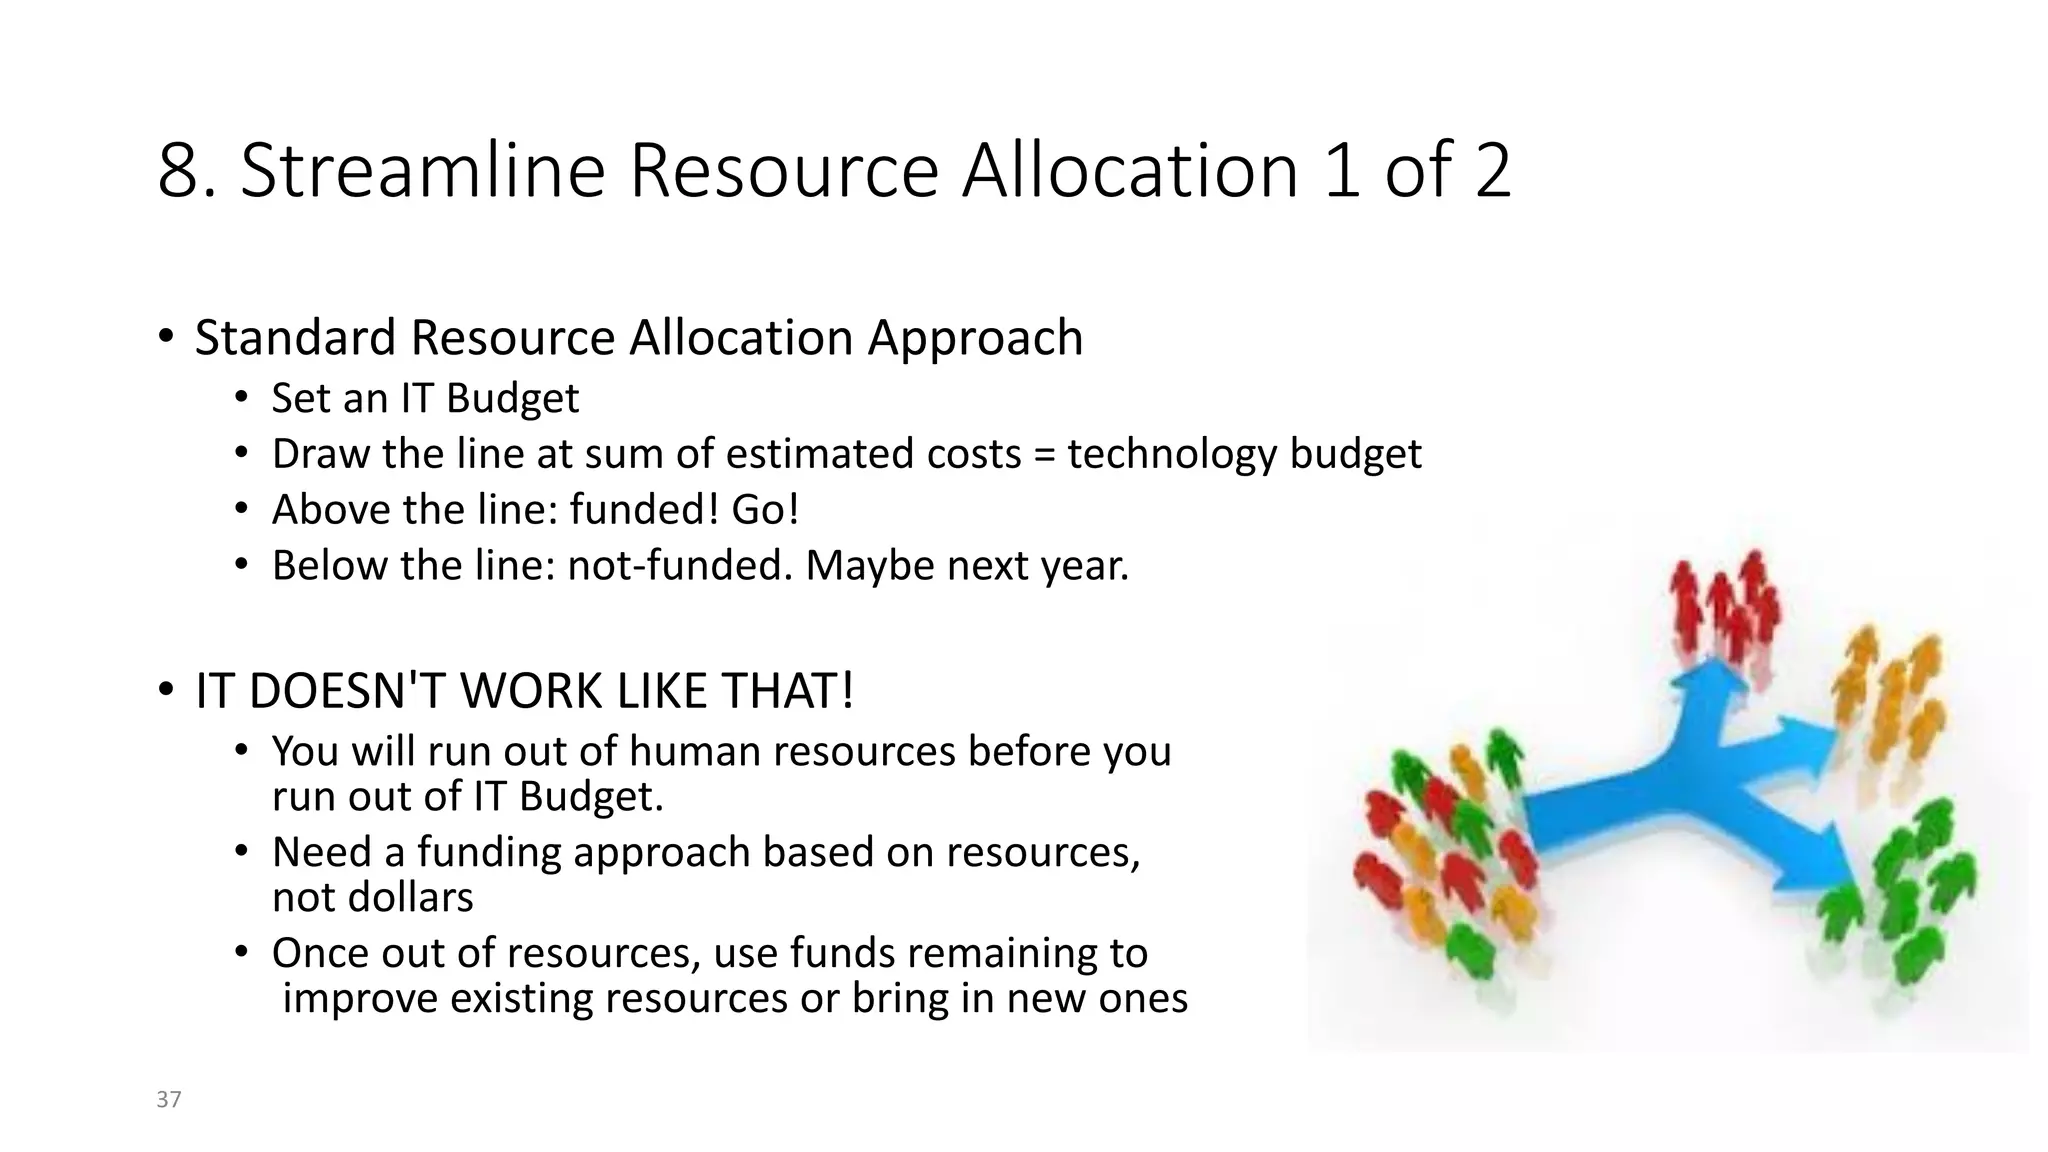

The document outlines techniques for optimizing portfolio performance using agile methods and tools like Jira, focusing on elements such as historical baselines, current and future state estimates, and alignment with business objectives. It emphasizes metrics for assessing quality, predictability, and productivity, and suggests innovations to enhance portfolio management. Additionally, it provides strategies for evaluating return on investment (ROI) and streamlining resource allocation within IT budgets.


![Vibe Coding vs. Spec-Driven Development [Free Meetup]](https://cdn.slidesharecdn.com/ss_thumbnails/vibecodingvsspecdrivendevelopment-251209105622-43f455e7-thumbnail.jpg?width=640&height=640&fit=bounds)


