Downloaded 2,405 times
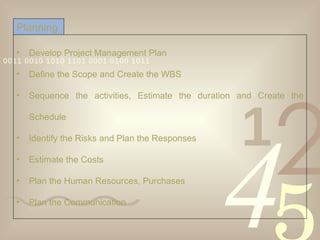


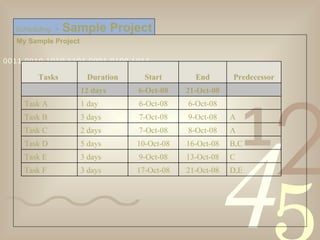
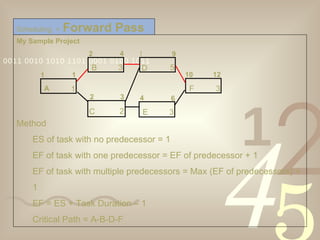
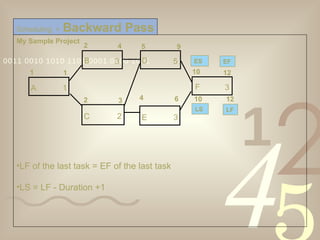
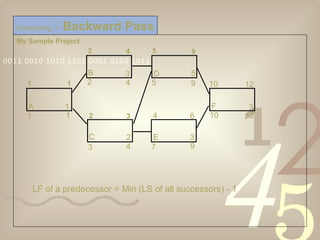
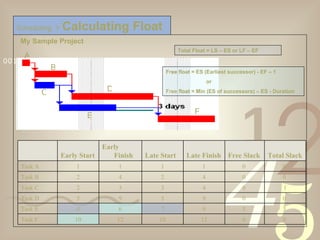


The document provides an overview of key concepts in project planning and scheduling including developing a project management plan, defining the project scope and work breakdown structure (WBS), sequencing activities, estimating durations and resources, developing a schedule, calculating early and late dates, determining the critical path, and calculating float. It includes examples of a sample project schedule to demonstrate these scheduling techniques.


