Download as PDF, PPTX

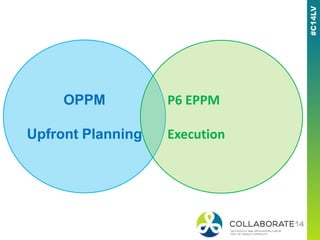
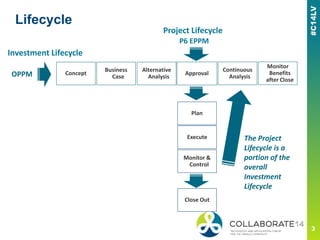
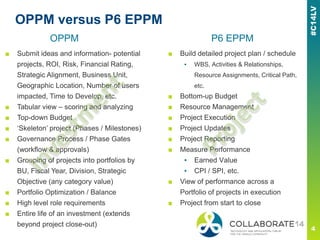


This document provides an overview of the differences between Oracle's OPPM (Oracle Primavera Portfolio Management) and P6 EPPM (Oracle Primavera P6 Enterprise Project Portfolio Management). It summarizes that OPPM is used for upfront planning and portfolio management activities like project submission and prioritization. P6 EPPM is used for project execution, scheduling, resource management, and reporting on project performance and benefits realization. The document also briefly outlines key portfolio management concepts and processes.


