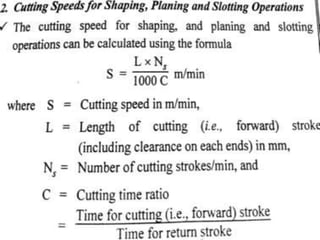
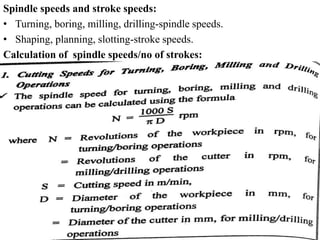
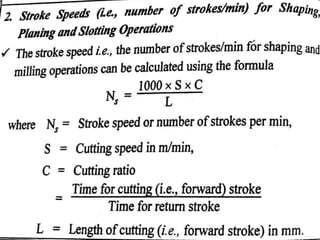
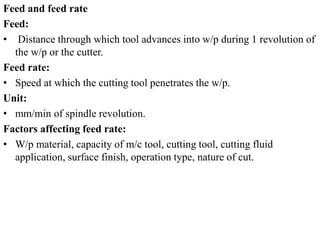
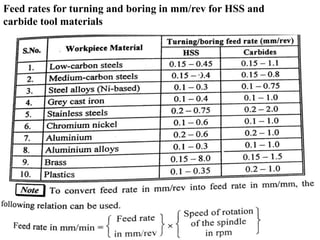
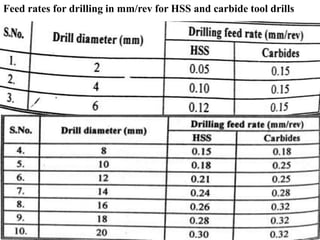
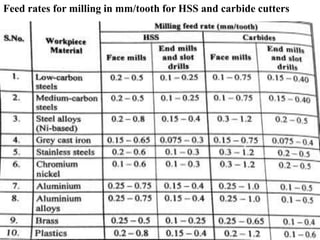
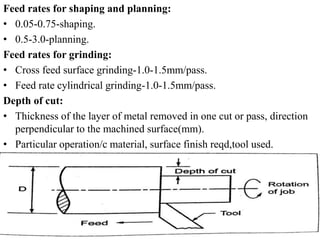
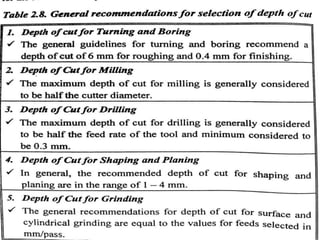
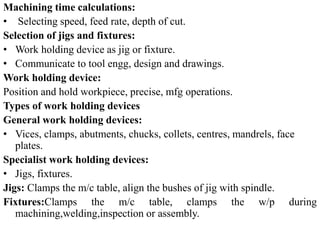
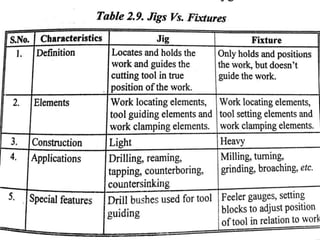
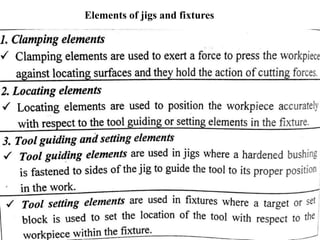
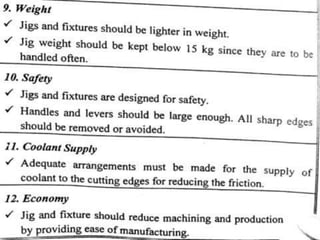
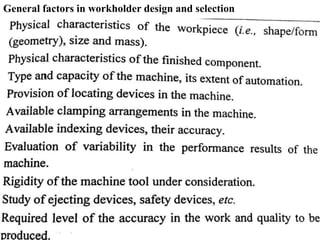
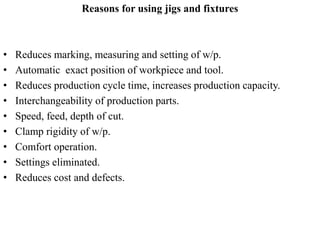
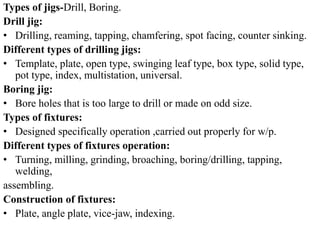
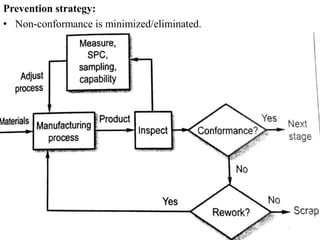
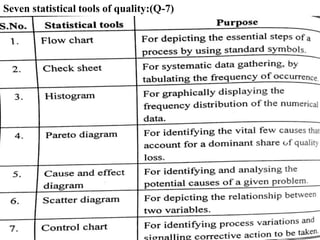
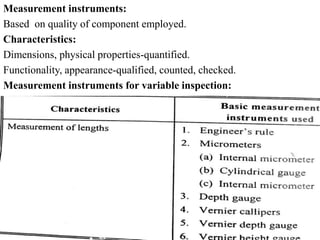
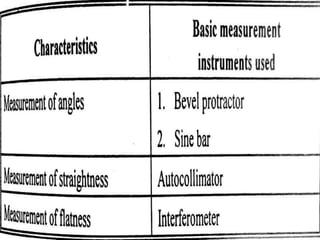
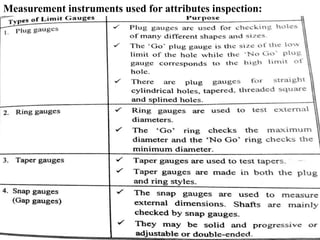
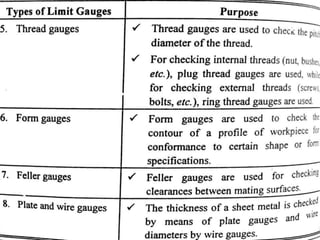
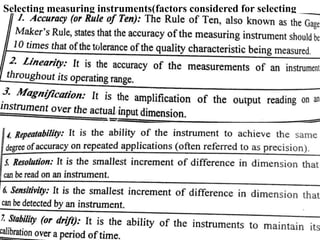
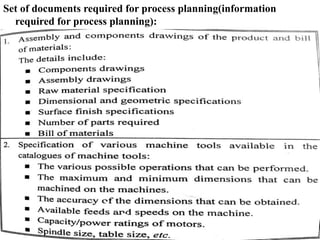
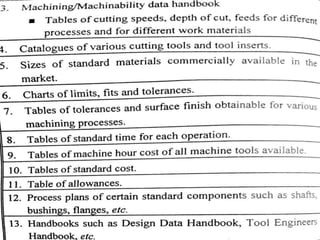
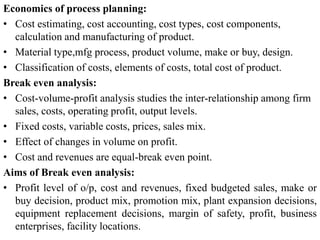
UNIT-II
PROCESS PLANNING
ACTIVITIES
Introduction:
• Setting process parameters, work holding devices, inspection/quality
assurance methods, economics of process planning.
Process parameters calculation:
• Cutting speed, feed rate, depth of cut.
Cutting speed:
• Surface cutting speed or surface speed, relative speed b/w tool and
w/p.
• Tool or w/p or both may be moving during cutting.(mpm).
Factors affecting the selection of cutting speed:
Cutting speeds for different combinations of operation and material
Cutting speed ranges for different combinations of work piece and
tool material
Calculation of cutting speeds
Spindle speeds and stroke speeds:
• Turning, boring, milling, drilling-spindle speeds.
• Shaping, planning, slotting-stroke speeds.
Calculation of spindle speeds/no of strokes:
Feed and feed rate
Feed:
• Distance through which tool advances into w/p during 1 revolution of
the w/p or the cutter.
Feed rate:
• Speed at which the cutting tool penetrates the w/p.
Unit:
• mm/min of spindle revolution.
Factors affecting feed rate:
• W/p material, capacity of m/c tool, cutting tool, cutting fluid
application, surface finish, operation type, nature of cut.
Feed rates for turning and boring in mm/rev for HSS and
carbide tool materials
Feed rates for drilling in mm/rev for HSS and carbide tool drills
Feed rates for milling in mm/tooth for HSS and carbide cutters
Feed rates for shaping and planning:
• 0.05-0.75-shaping.
• 0.5-3.0-planning.
Feed rates for grinding:
• Cross feed surface grinding-1.0-1.5mm/pass.
• Feed rate cylindrical grinding-1.0-1.5mm/pass.
Depth of cut:
• Thickness of the layer of metal removed in one cut or pass, direction
perpendicular to the machined surface(mm).
• Particular operation/c material, surface finish reqd,tool used.
Machining time calculations:
• Selecting speed, feed rate, depth of cut.
Selection of jigs and fixtures:
• Work holding device as jig or fixture.
• Communicate to tool engg, design and drawings.
Work holding device:
Position and hold workpiece, precise, mfg operations.
Types of work holding devices
General work holding devices:
• Vices, clamps, abutments, chucks, collets, centres, mandrels, face
plates.
Specialist work holding devices:
• Jigs, fixtures.
Jigs: Clamps the m/c table, align the bushes of jig with spindle.
Fixtures:Clamps the m/c table, clamps the w/p during
machining,welding,inspection or assembly.
Elements of jigs and fixtures
Principles of jigs and fixtures design
factors influencing jigs and fixtures design
General factors in workholder design and selection
Reasons for using jigs and fixtures
• Reduces marking, measuring and setting of w/p.
• Automatic exact position of workpiece and tool.
• Reduces production cycle time, increases production capacity.
• Interchangeability of production parts.
• Speed, feed, depth of cut.
• Clamp rigidity of w/p.
• Comfort operation.
• Settings eliminated.
• Reduces cost and defects.
Types of jigs-Drill, Boring.
Drill jig:
• Drilling, reaming, tapping, chamfering, spot facing, counter sinking.
Different types of drilling jigs:
• Template, plate, open type, swinging leaf type, box type, solid type,
pot type, index, multistation, universal.
Boring jig:
• Bore holes that is too large to drill or made on odd size.
Types of fixtures:
• Designed specifically operation ,carried out properly for w/p.
Different types of fixtures operation:
• Turning, milling, grinding, broaching, boring/drilling, tapping,
welding,
assembling.
Construction of fixtures:
• Plate, angle plate, vice-jaw, indexing.
Standard parts for jigs and fixtures:
• Mechanical fasteners, locating and supporting devices, indexing pins,
drill bushes, hand knobs, handles.
Selection of quality assurance methods:
• Dimensional and geometric tolerances, surface finish specifications,
inspection criteria, quality engineer, QA tools.
• Balance b/w quality, avoid increase of time & mfg costs.
Tasks:
• Inspection locations, testing methods, evaluation and identification of
corrective action, influences processes, equipment, tools and mfg
parameters.
Quality definition:
• Totality of features and characteristics of a product or service, that
bear on its ability to satisfy stated and implied needs of the customer.
TQM definition:
• Management approach of an organisation, centered on quality,
participation of all its members and aiming longterm success through
Customer satisfaction and benefits to all members of the organisation and
to society.
Principles/concepts of TQM
TQM Framework(Elements of TQM):
Basic quality strategies:
• Detection strategy, prevention strategy.
Detection strategy:
• Non-conformance is detected, various inspection methods, process is
adjusted.
Prevention strategy:
• Non-conformance is minimized/eliminated.
Seven statistical tools of quality:(Q-7)
Statistical quality control:
• Employing inspection methodologies from statistical sampling theory
to conformance requirements.
• Inspected samples of batch in statistical interferences, conclusions for
whole batch.
Two methods of SQC:
• Statistical process control, Acceptance sampling.
Assignable and chance causes of variations:
• Two objects exactly alike, degree of inherent variability.
Four sources of variations:
• Processes, materials, operations, miscellaneous factors.
• Miscellaneous- heat, light, humidity.
Assignable causes of variations:
Larger in magnitude and easily traced and detected.
Reasons
• Differences among machines, materials, processes, overtime,
relationship to one another.
• Analyzing data, identify and eliminate remedial actions.
Chance or random or common causes of variations:
• Inevitable in any process, difficult to trace and control, best conditions
of production, random manner.
• Human variability from one operation cycle to next by raw materials,
fluctuations, lack of skills.
• Process operating under stable system of chance causes said to be
statistical control.
Control charts:
• Graph that displays data taken over time and variations of this data.
Uses
• Process is statistically or not,variability,capability of
production,variation,effect of process change.
Types
• Control charts for variables, attributes.
Control charts for variables:
• Quality characteristics measured and expressed in specific units of
measurements.
Types:
• Average,range,standard deviation charts.
• Average charts-monitor centering.
• Range charts-dispersion.
• Standard deviation-variation.
Control charts for attributes:
• Attribute refers quality characteristics conform specifications or not
conform specifications.
• Monitors the number of defects or fraction defect rate present in
sample.
Types:
• P-chart: Rejected fraction non-conforming to specifications.
• np chart: Number of non-confirming items.
• C chart:Number of non-conformities.
• U chart:Number of non-conformities per unit.
Process capability:
• Output of an in-control process to specify limits by capability indices.
• Compares customer specification limits or voice of the process.
Definition:
• Minimum spread of specific measurement variation include 99.7% of
measurements from given process.
• 99.7% area (-3σ to 3σ),process capability=6σ(natural tolerance).
Purpose:
• Inherent capable of specified tolerance limits.
• Failing to meet specifications.
Process capability indices(Measures of process capability):
Process capability index Cp
• Process potential performance of natural process to spread specified. Used in
product design phase and pilot production phase.
Cp = Total specification tolerance/process capability
Cp =USL-LSL/6σ
• USL=Upper specification limit, LSL=Lower specification limit,
USL-LSL=Tolerance, σ=population standard
deviation,6σ=Process capability Cp =Capability index.
Interpretation of Cp :
• Cp >1= Process variation meeting the specifications.(better
quality, improves process capability)
• Cp˂1= Process variation not meeting the specifications.
• Cp = 1 process just meeting the specifications.
Process capability index Cpk:
• Location of process.
• Pilot production phase and routine production phase.
• Cpk = min{USL-Mean/3σ,Mean-LSL/3σ}.
• Interpretation of Cpk:
Cpk=or˂ than Cp, Cpk >1-process confirm specifications, Cpk ˂ 1-
process not conform specifications.
• Cpk = 1-process just conform specifications, Cp=Cpk-process
centered.
Inspection and measurement:
• Objective-Product quality is maintained.
• Aims-Conforming and non-conforming product,mfg variations,
discover inefficiency.
Stages(Locations)
Inspection of incoming materials(Preproduction inspection or input
inspection):
• Inspecting and checking the raw materials and parts that supplied
before stock or mfg.
• Inspection at suppliers end.
Inspection of production process(Inspection during production or
process inspection):
• Production process going on, work centres at critical production
points.
• Prevent wastage of time and money, defective units, delays.
Inspection of finished goods(Post-production inspection or output
inspection):
• Finished goods inspected and carried before marketing, poor quality
rejected.
Methods of inspection:
• 100% inspection.
• Sampling inspection.
100% inspection:
• Specifications or standards and acceptance or rejection of parts.
Sampling inspection:
• Avoid more cost, satisfactory random sample, piece by piece
inspection.
• Statistical methods-Quality, reliable.
Types of inspection:
• Inspection of variables, inspection of attributes.
• Qualitative characteristics-attributes.
• Quantified characteristics-variables.
Measurement instruments:
Based on quality of component employed.
Characteristics:
Dimensions, physical properties-quantified.
Functionality, appearance-qualified, counted, checked.
Measurement instruments for variable inspection:
Measurement instruments used for attributes inspection:
Selecting measuring instruments(factors considered for selecting
measuring instruments):
Set of documents required for process planning(information
required for process planning):
Economics of process planning:
• Cost estimating, cost accounting, cost types, cost components,
calculation and manufacturing of product.
• Material type,mfg process, product volume, make or buy, design.
• Classification of costs, elements of costs, total cost of product.
Break even analysis:
• Cost-volume-profit analysis studies the inter-relationship among firm
sales, costs, operating profit, output levels.
• Fixed costs, variable costs, prices, sales mix.
• Effect of changes in volume on profit.
• Cost and revenues are equal-break even point.
Aims of Break even analysis:
• Profit level of o/p, cost and revenues, fixed budgeted sales, make or
buy decision, product mix, promotion mix, plant expansion decisions,
equipment replacement decisions, margin of safety, profit, business
enterprises, facility locations.
Break-even point:
• Sales level at which the total revenues and total costs are equal.
• No profit-No loss point.
• Sells above BEP-profit, Sells below BEP-loss.
• Changes fixed cost, variable cost, selling price.
Determination of break-even point:
Algebraic method, graphical method.
Algebraic method:
Break even point in terms of physical units:
• FC=fixed cost,
• VC=variable cost,
• TVC=total variable cost,
• TC=total costs,
• TR=total revenue
• Q=sales volume
• SP= selling price per unit
• Total costs = fixed cost + variable cost
Total costs=FC+(VC×Q)
• Total revenue=Selling price/unit × quantity sold
TR=SP×Q
BEP,Total costs=Total revenue
TC=TR
FC+(VC×Q)=SP×Q
QBEP=FC/(SP-VC)
Break even quantity= Fixed costs/(Selling price per unit-
Variable cost per unit)
• Break-even point in terms of sales value
Break even sales(BEP in Rs)=Fixed costs/1-(variable cost per
unit/selling price per unit)
BEP in rupees=FC/(1-(VC/SP)
Contribution
• C=SP-VC
• Companion value of revenue product sale covers fixed costs with
remainder takes profit.
• Contribution ratio=contribution/selling price
• Contribution ratio=selling price-variable cost/selling price
P/V ratio(profit-volume ratio)
p/v ratio=contribution/sales
The graphical method(break even chart):
Margin of safety:
• Difference between the existing level of output and the level of output
at BEP.
• Margin of safety(in %)=sales-sales at BEP/sales×100.
• > MOS- > Profit
• <MOS- > incurring losses
PPCE Unit-2.pptx
PPCE Unit-2.pptx
PPCE Unit-2.pptx
PPCE Unit-2.pptx
PPCE Unit-2.pptx
PPCE Unit-2.pptx
PPCE Unit-2.pptx
PPCE Unit-2.pptx
PPCE Unit-2.pptx
PPCE Unit-2.pptx
PPCE Unit-2.pptx
PPCE Unit-2.pptx
PPCE Unit-2.pptx

PPCE Unit-2.pptx

  • 1.
  • 2.
    Introduction: • Setting processparameters, work holding devices, inspection/quality assurance methods, economics of process planning. Process parameters calculation: • Cutting speed, feed rate, depth of cut. Cutting speed: • Surface cutting speed or surface speed, relative speed b/w tool and w/p. • Tool or w/p or both may be moving during cutting.(mpm).
  • 3.
    Factors affecting theselection of cutting speed:
  • 6.
    Cutting speeds fordifferent combinations of operation and material
  • 7.
    Cutting speed rangesfor different combinations of work piece and tool material
  • 8.
  • 11.
    Spindle speeds andstroke speeds: • Turning, boring, milling, drilling-spindle speeds. • Shaping, planning, slotting-stroke speeds. Calculation of spindle speeds/no of strokes:
  • 13.
    Feed and feedrate Feed: • Distance through which tool advances into w/p during 1 revolution of the w/p or the cutter. Feed rate: • Speed at which the cutting tool penetrates the w/p. Unit: • mm/min of spindle revolution. Factors affecting feed rate: • W/p material, capacity of m/c tool, cutting tool, cutting fluid application, surface finish, operation type, nature of cut.
  • 14.
    Feed rates forturning and boring in mm/rev for HSS and carbide tool materials
  • 15.
    Feed rates fordrilling in mm/rev for HSS and carbide tool drills
  • 16.
    Feed rates formilling in mm/tooth for HSS and carbide cutters
  • 17.
    Feed rates forshaping and planning: • 0.05-0.75-shaping. • 0.5-3.0-planning. Feed rates for grinding: • Cross feed surface grinding-1.0-1.5mm/pass. • Feed rate cylindrical grinding-1.0-1.5mm/pass. Depth of cut: • Thickness of the layer of metal removed in one cut or pass, direction perpendicular to the machined surface(mm). • Particular operation/c material, surface finish reqd,tool used.
  • 19.
    Machining time calculations: •Selecting speed, feed rate, depth of cut. Selection of jigs and fixtures: • Work holding device as jig or fixture. • Communicate to tool engg, design and drawings. Work holding device: Position and hold workpiece, precise, mfg operations. Types of work holding devices General work holding devices: • Vices, clamps, abutments, chucks, collets, centres, mandrels, face plates. Specialist work holding devices: • Jigs, fixtures. Jigs: Clamps the m/c table, align the bushes of jig with spindle. Fixtures:Clamps the m/c table, clamps the w/p during machining,welding,inspection or assembly.
  • 21.
    Elements of jigsand fixtures
  • 22.
    Principles of jigsand fixtures design factors influencing jigs and fixtures design
  • 27.
    General factors inworkholder design and selection
  • 28.
    Reasons for usingjigs and fixtures • Reduces marking, measuring and setting of w/p. • Automatic exact position of workpiece and tool. • Reduces production cycle time, increases production capacity. • Interchangeability of production parts. • Speed, feed, depth of cut. • Clamp rigidity of w/p. • Comfort operation. • Settings eliminated. • Reduces cost and defects.
  • 29.
    Types of jigs-Drill,Boring. Drill jig: • Drilling, reaming, tapping, chamfering, spot facing, counter sinking. Different types of drilling jigs: • Template, plate, open type, swinging leaf type, box type, solid type, pot type, index, multistation, universal. Boring jig: • Bore holes that is too large to drill or made on odd size. Types of fixtures: • Designed specifically operation ,carried out properly for w/p. Different types of fixtures operation: • Turning, milling, grinding, broaching, boring/drilling, tapping, welding, assembling. Construction of fixtures: • Plate, angle plate, vice-jaw, indexing.
  • 30.
    Standard parts forjigs and fixtures: • Mechanical fasteners, locating and supporting devices, indexing pins, drill bushes, hand knobs, handles. Selection of quality assurance methods: • Dimensional and geometric tolerances, surface finish specifications, inspection criteria, quality engineer, QA tools. • Balance b/w quality, avoid increase of time & mfg costs. Tasks: • Inspection locations, testing methods, evaluation and identification of corrective action, influences processes, equipment, tools and mfg parameters. Quality definition: • Totality of features and characteristics of a product or service, that bear on its ability to satisfy stated and implied needs of the customer. TQM definition: • Management approach of an organisation, centered on quality, participation of all its members and aiming longterm success through
  • 31.
    Customer satisfaction andbenefits to all members of the organisation and to society. Principles/concepts of TQM
  • 32.
  • 33.
    Basic quality strategies: •Detection strategy, prevention strategy. Detection strategy: • Non-conformance is detected, various inspection methods, process is adjusted.
  • 34.
  • 35.
    Seven statistical toolsof quality:(Q-7)
  • 36.
    Statistical quality control: •Employing inspection methodologies from statistical sampling theory to conformance requirements. • Inspected samples of batch in statistical interferences, conclusions for whole batch. Two methods of SQC: • Statistical process control, Acceptance sampling. Assignable and chance causes of variations: • Two objects exactly alike, degree of inherent variability. Four sources of variations: • Processes, materials, operations, miscellaneous factors. • Miscellaneous- heat, light, humidity. Assignable causes of variations: Larger in magnitude and easily traced and detected. Reasons • Differences among machines, materials, processes, overtime, relationship to one another.
  • 37.
    • Analyzing data,identify and eliminate remedial actions. Chance or random or common causes of variations: • Inevitable in any process, difficult to trace and control, best conditions of production, random manner. • Human variability from one operation cycle to next by raw materials, fluctuations, lack of skills. • Process operating under stable system of chance causes said to be statistical control. Control charts: • Graph that displays data taken over time and variations of this data. Uses • Process is statistically or not,variability,capability of production,variation,effect of process change. Types • Control charts for variables, attributes.
  • 39.
    Control charts forvariables: • Quality characteristics measured and expressed in specific units of measurements. Types: • Average,range,standard deviation charts. • Average charts-monitor centering. • Range charts-dispersion. • Standard deviation-variation. Control charts for attributes: • Attribute refers quality characteristics conform specifications or not conform specifications. • Monitors the number of defects or fraction defect rate present in sample. Types: • P-chart: Rejected fraction non-conforming to specifications. • np chart: Number of non-confirming items.
  • 40.
    • C chart:Numberof non-conformities. • U chart:Number of non-conformities per unit.
  • 41.
    Process capability: • Outputof an in-control process to specify limits by capability indices. • Compares customer specification limits or voice of the process. Definition: • Minimum spread of specific measurement variation include 99.7% of measurements from given process. • 99.7% area (-3σ to 3σ),process capability=6σ(natural tolerance). Purpose: • Inherent capable of specified tolerance limits. • Failing to meet specifications. Process capability indices(Measures of process capability): Process capability index Cp • Process potential performance of natural process to spread specified. Used in product design phase and pilot production phase. Cp = Total specification tolerance/process capability Cp =USL-LSL/6σ
  • 42.
    • USL=Upper specificationlimit, LSL=Lower specification limit, USL-LSL=Tolerance, σ=population standard deviation,6σ=Process capability Cp =Capability index. Interpretation of Cp : • Cp >1= Process variation meeting the specifications.(better quality, improves process capability) • Cp˂1= Process variation not meeting the specifications. • Cp = 1 process just meeting the specifications. Process capability index Cpk: • Location of process. • Pilot production phase and routine production phase. • Cpk = min{USL-Mean/3σ,Mean-LSL/3σ}. • Interpretation of Cpk: Cpk=or˂ than Cp, Cpk >1-process confirm specifications, Cpk ˂ 1- process not conform specifications.
  • 43.
    • Cpk =1-process just conform specifications, Cp=Cpk-process centered. Inspection and measurement: • Objective-Product quality is maintained. • Aims-Conforming and non-conforming product,mfg variations, discover inefficiency. Stages(Locations) Inspection of incoming materials(Preproduction inspection or input inspection): • Inspecting and checking the raw materials and parts that supplied before stock or mfg. • Inspection at suppliers end. Inspection of production process(Inspection during production or process inspection): • Production process going on, work centres at critical production points. • Prevent wastage of time and money, defective units, delays.
  • 44.
    Inspection of finishedgoods(Post-production inspection or output inspection): • Finished goods inspected and carried before marketing, poor quality rejected. Methods of inspection: • 100% inspection. • Sampling inspection. 100% inspection: • Specifications or standards and acceptance or rejection of parts. Sampling inspection: • Avoid more cost, satisfactory random sample, piece by piece inspection. • Statistical methods-Quality, reliable. Types of inspection: • Inspection of variables, inspection of attributes. • Qualitative characteristics-attributes.
  • 45.
  • 46.
    Measurement instruments: Based onquality of component employed. Characteristics: Dimensions, physical properties-quantified. Functionality, appearance-qualified, counted, checked. Measurement instruments for variable inspection:
  • 48.
    Measurement instruments usedfor attributes inspection:
  • 50.
    Selecting measuring instruments(factorsconsidered for selecting measuring instruments):
  • 51.
    Set of documentsrequired for process planning(information required for process planning):
  • 53.
    Economics of processplanning: • Cost estimating, cost accounting, cost types, cost components, calculation and manufacturing of product. • Material type,mfg process, product volume, make or buy, design. • Classification of costs, elements of costs, total cost of product. Break even analysis: • Cost-volume-profit analysis studies the inter-relationship among firm sales, costs, operating profit, output levels. • Fixed costs, variable costs, prices, sales mix. • Effect of changes in volume on profit. • Cost and revenues are equal-break even point. Aims of Break even analysis: • Profit level of o/p, cost and revenues, fixed budgeted sales, make or buy decision, product mix, promotion mix, plant expansion decisions, equipment replacement decisions, margin of safety, profit, business enterprises, facility locations.
  • 54.
    Break-even point: • Saleslevel at which the total revenues and total costs are equal. • No profit-No loss point. • Sells above BEP-profit, Sells below BEP-loss. • Changes fixed cost, variable cost, selling price. Determination of break-even point: Algebraic method, graphical method. Algebraic method: Break even point in terms of physical units: • FC=fixed cost, • VC=variable cost, • TVC=total variable cost, • TC=total costs, • TR=total revenue • Q=sales volume
  • 55.
    • SP= sellingprice per unit • Total costs = fixed cost + variable cost Total costs=FC+(VC×Q) • Total revenue=Selling price/unit × quantity sold TR=SP×Q BEP,Total costs=Total revenue TC=TR FC+(VC×Q)=SP×Q QBEP=FC/(SP-VC) Break even quantity= Fixed costs/(Selling price per unit- Variable cost per unit) • Break-even point in terms of sales value Break even sales(BEP in Rs)=Fixed costs/1-(variable cost per unit/selling price per unit) BEP in rupees=FC/(1-(VC/SP)
  • 56.
    Contribution • C=SP-VC • Companionvalue of revenue product sale covers fixed costs with remainder takes profit. • Contribution ratio=contribution/selling price • Contribution ratio=selling price-variable cost/selling price P/V ratio(profit-volume ratio) p/v ratio=contribution/sales The graphical method(break even chart):
  • 57.
    Margin of safety: •Difference between the existing level of output and the level of output at BEP. • Margin of safety(in %)=sales-sales at BEP/sales×100. • > MOS- > Profit • <MOS- > incurring losses