The document discusses fundamentals of process capability including:
1) Achieving process control is key to reducing variation and non-conforming parts to achieve quality and cost targets.
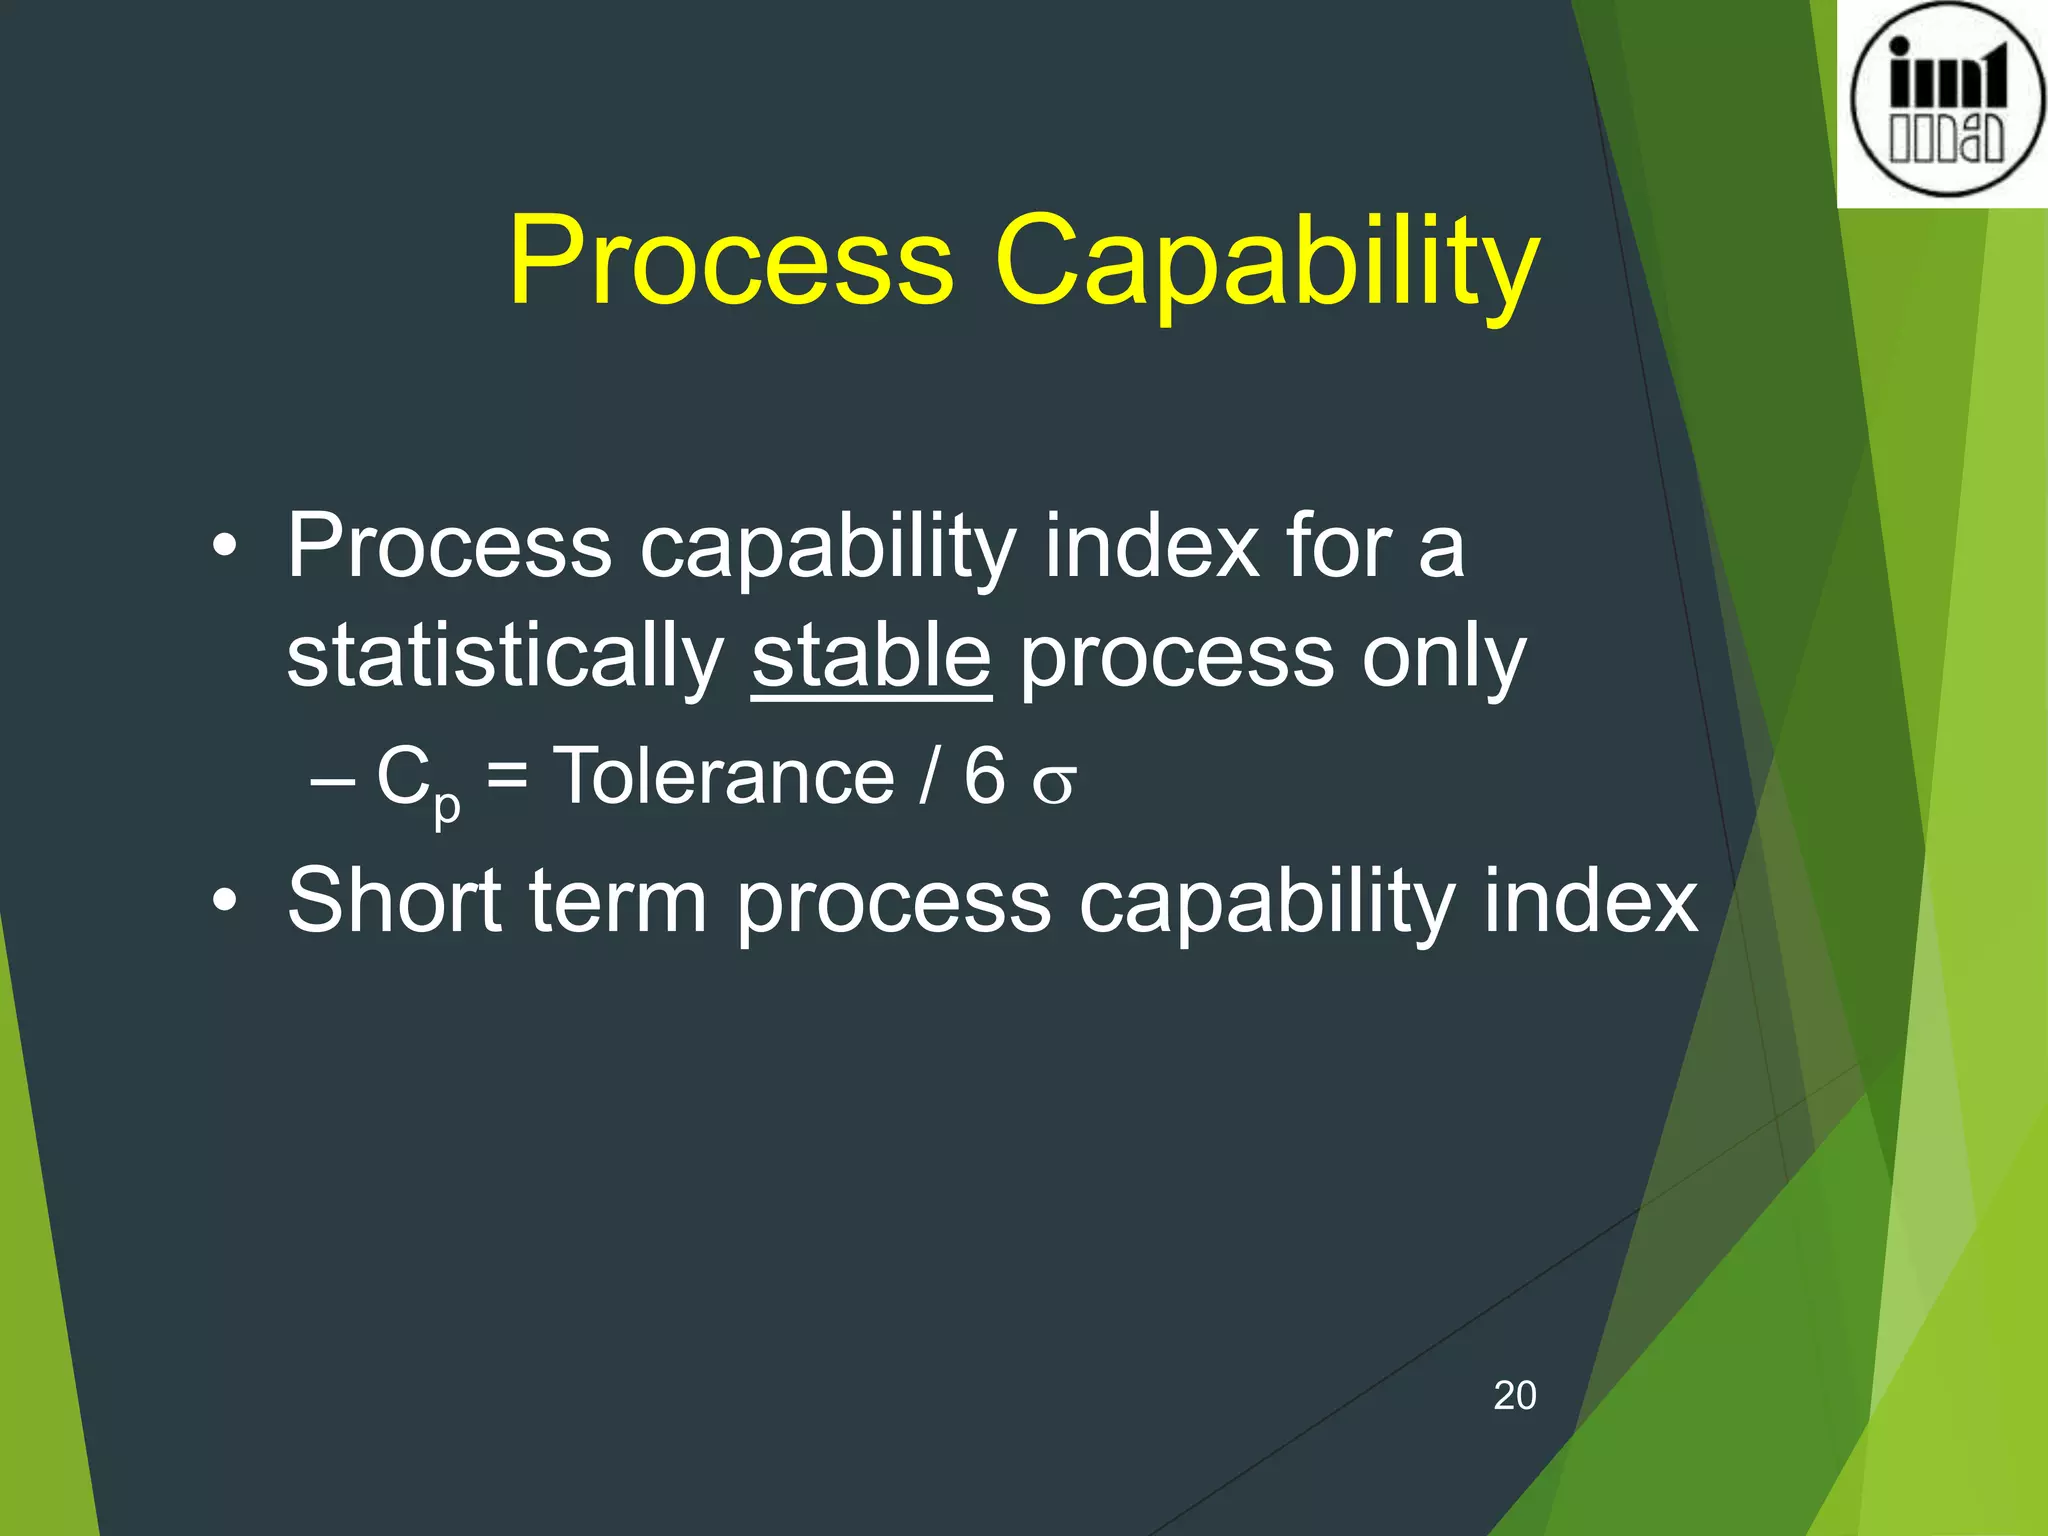
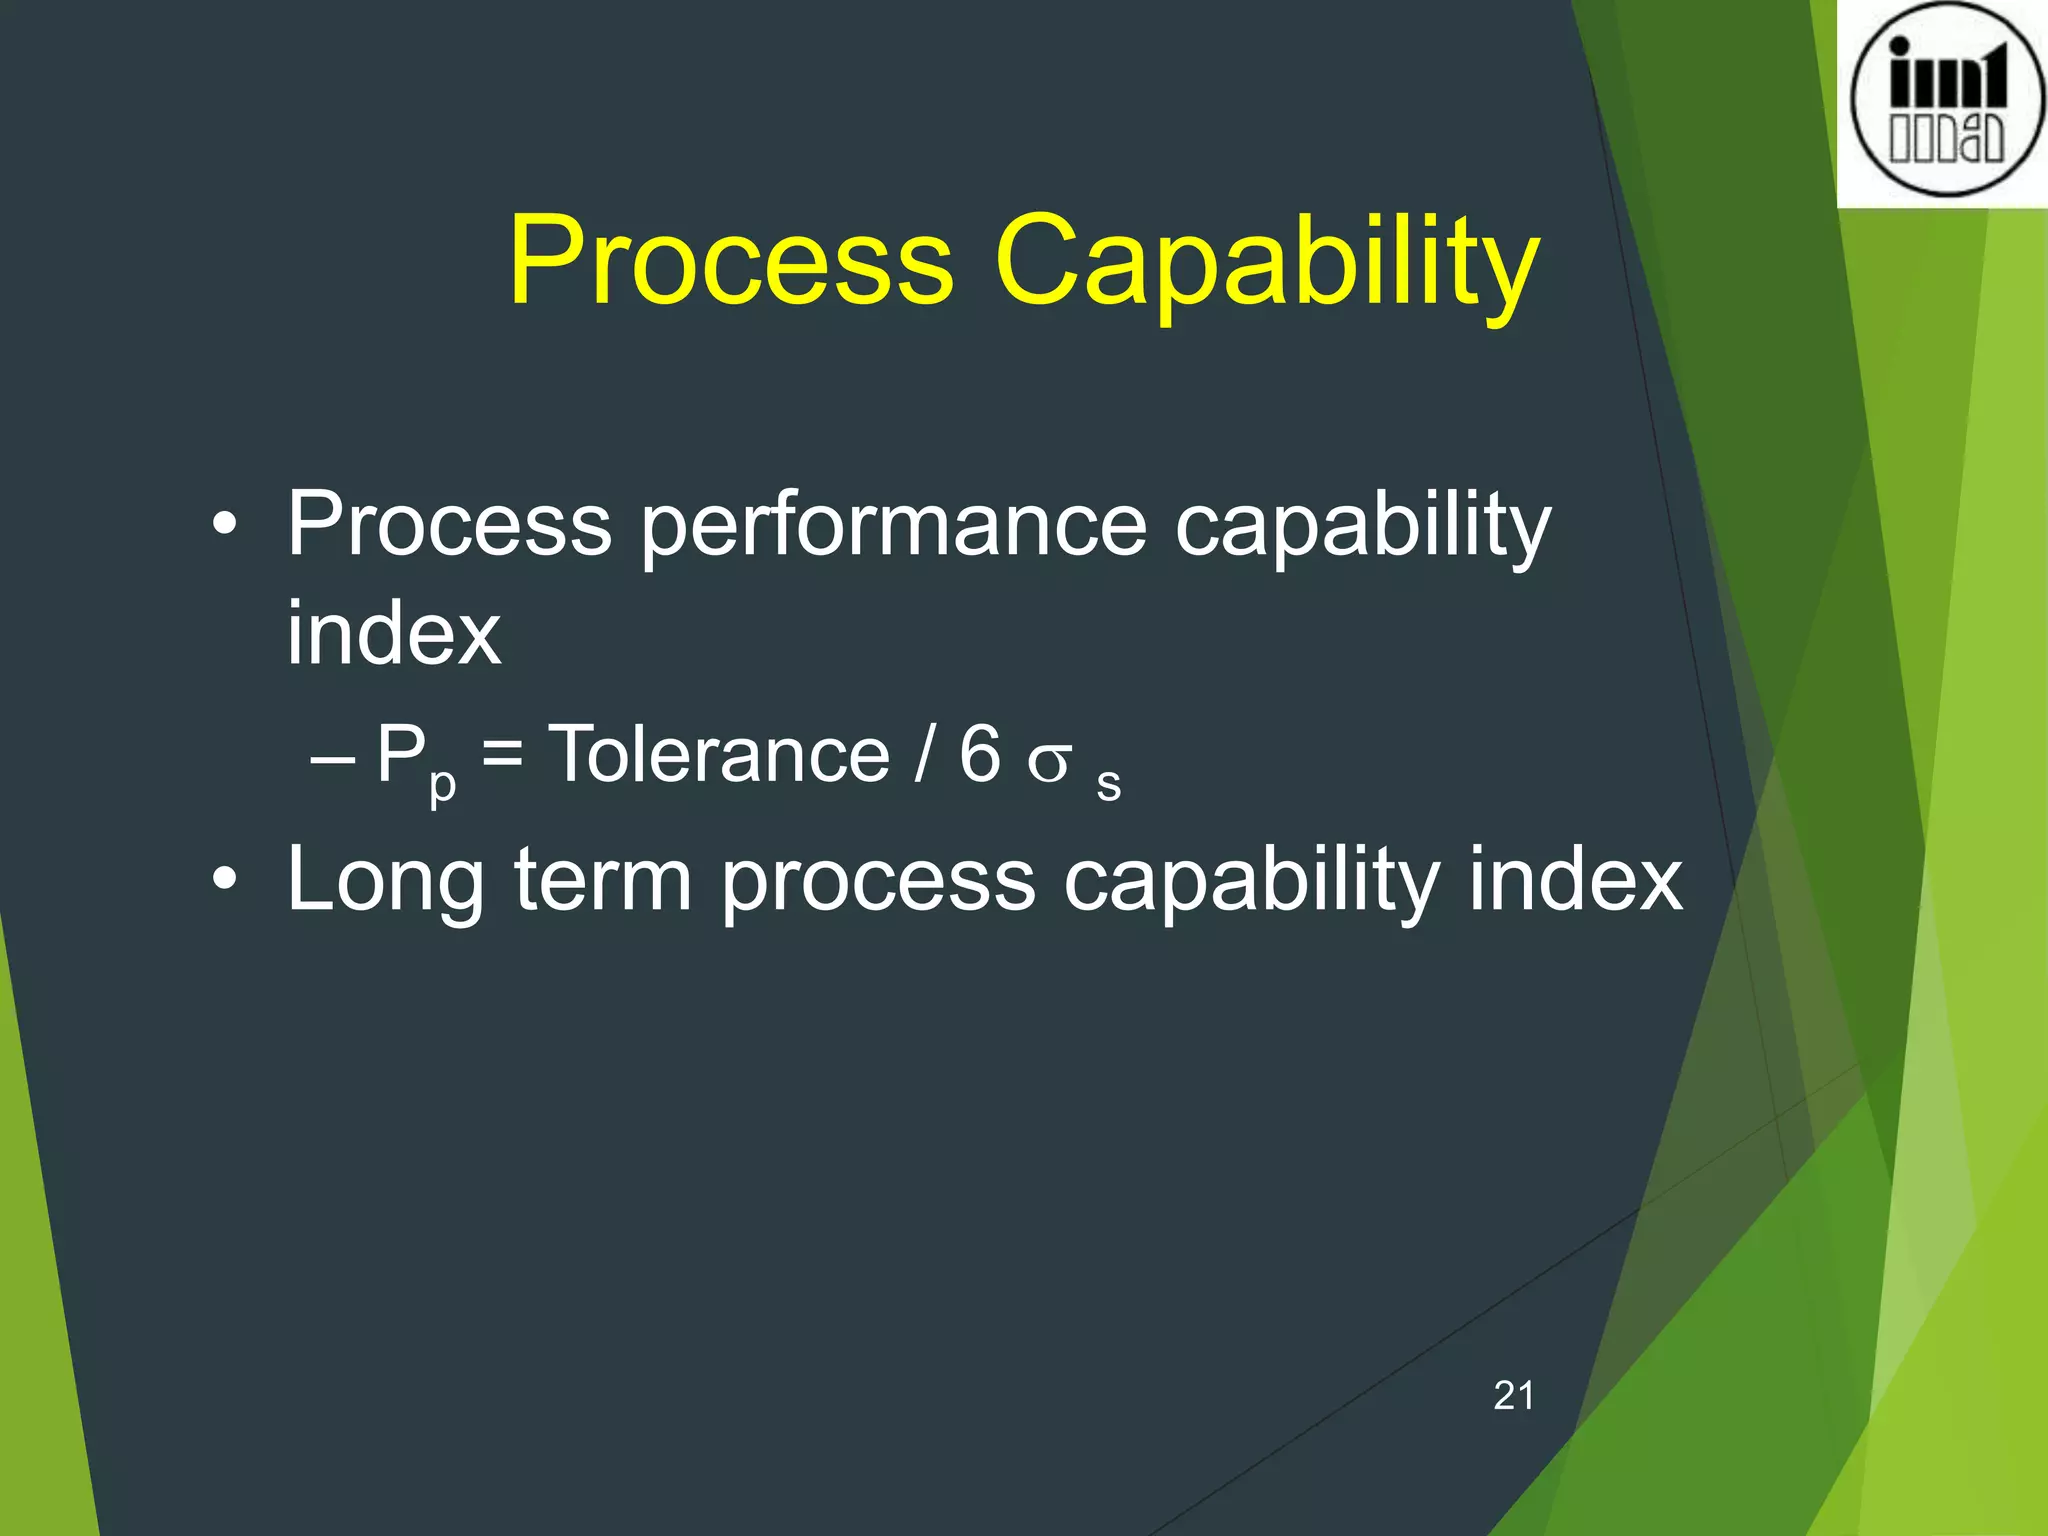
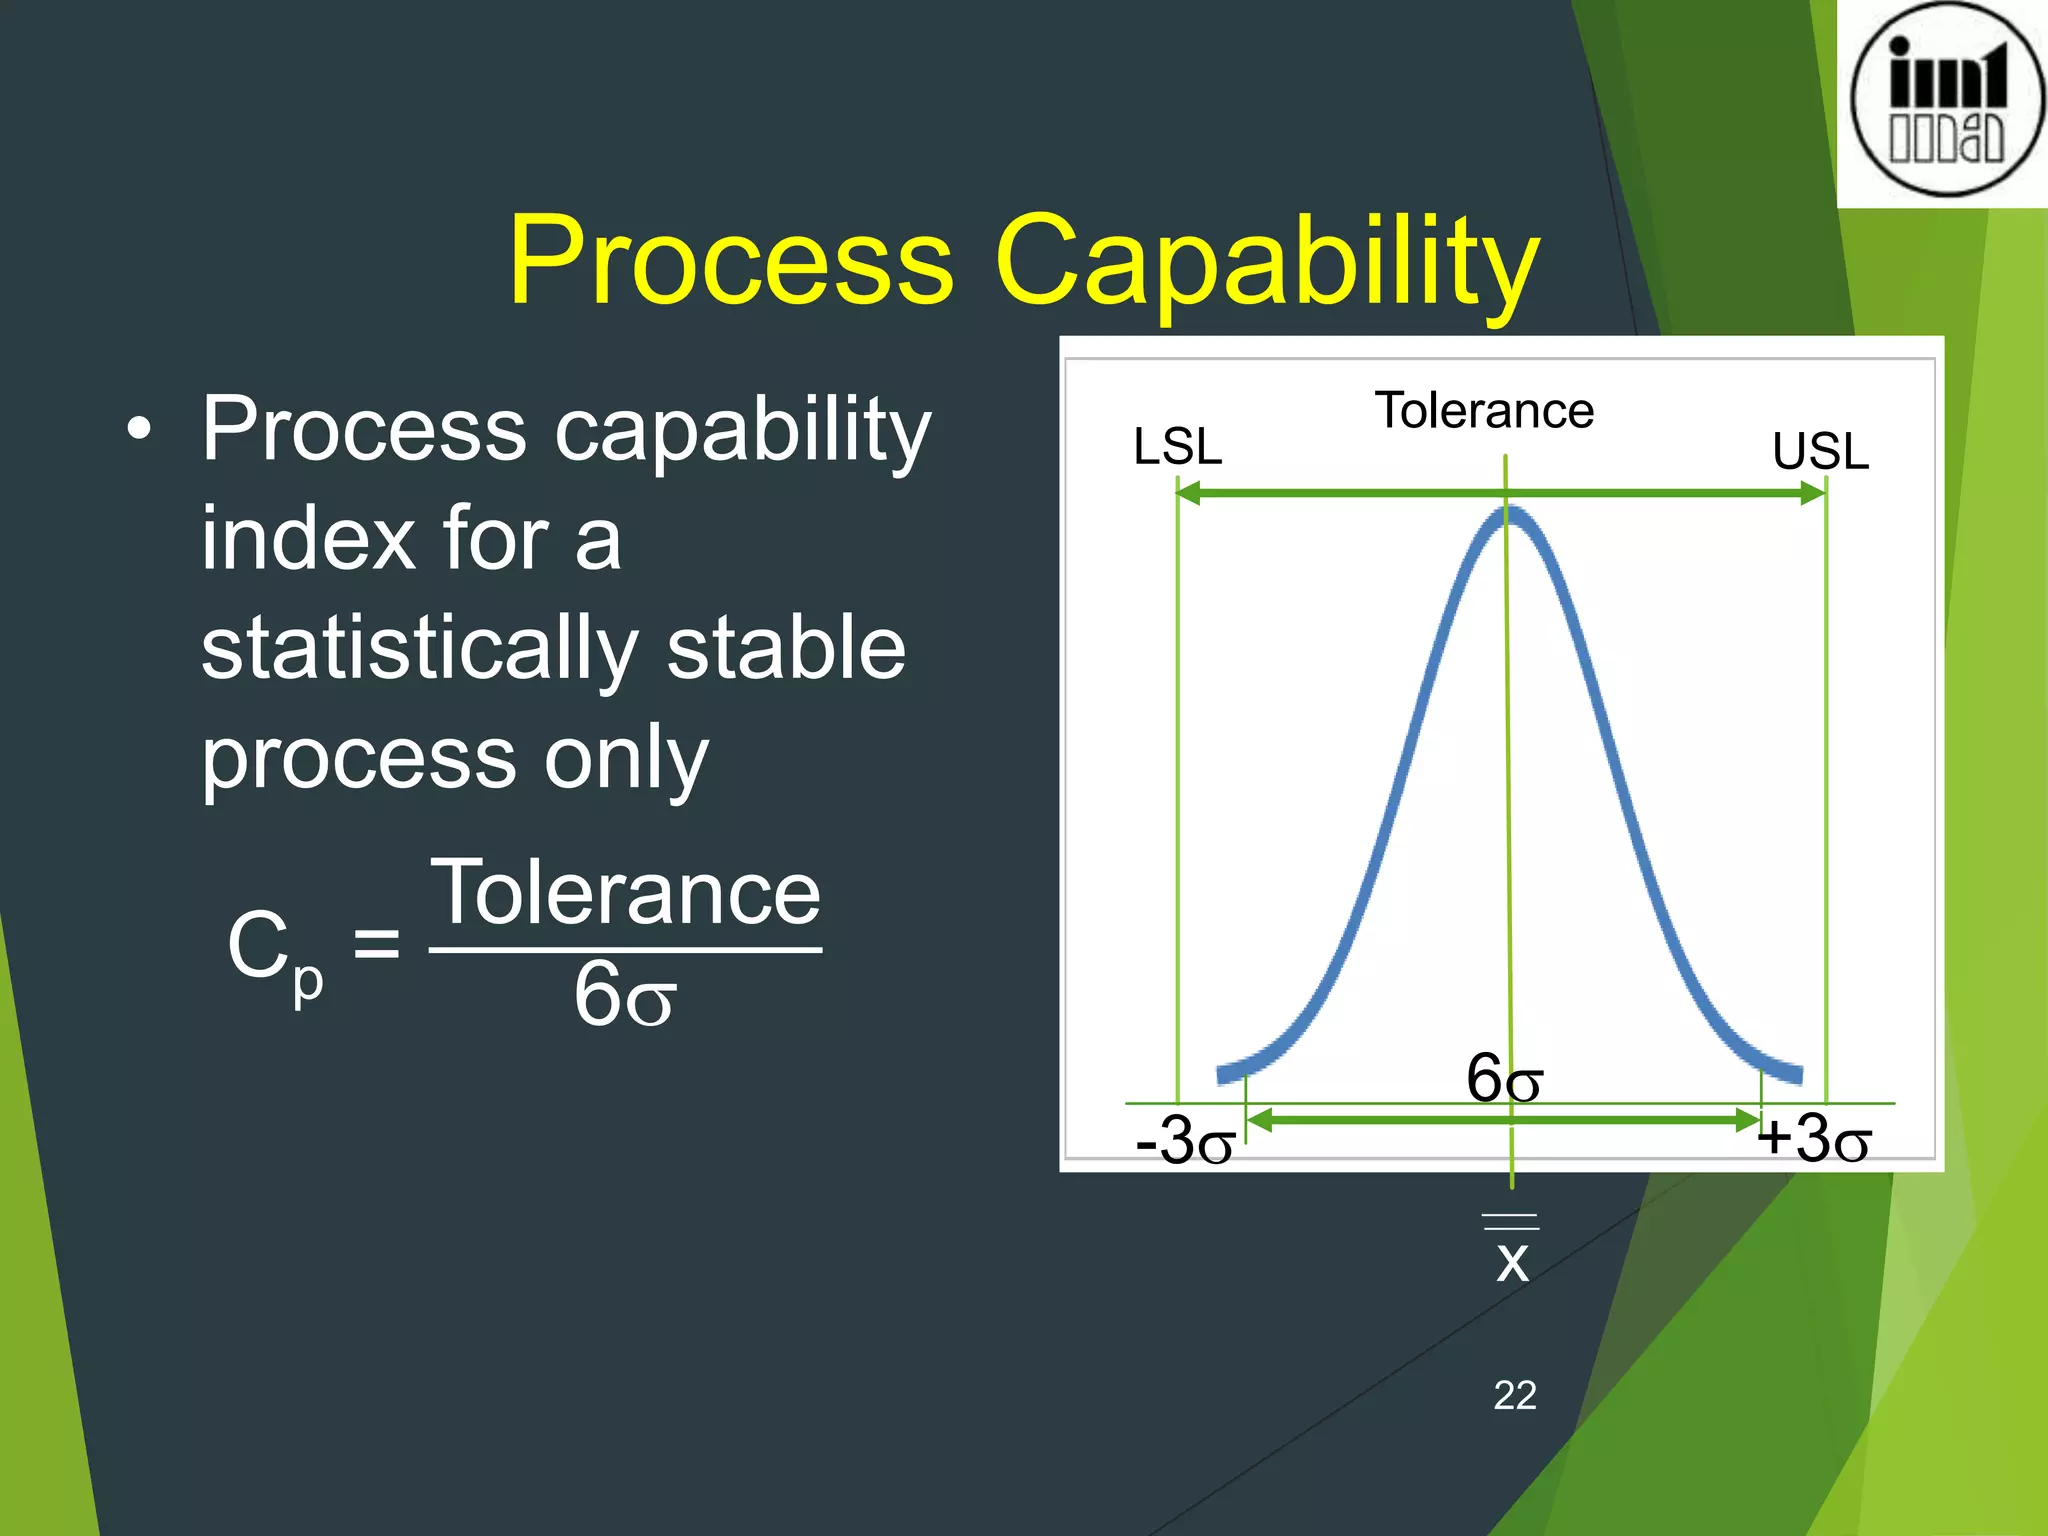
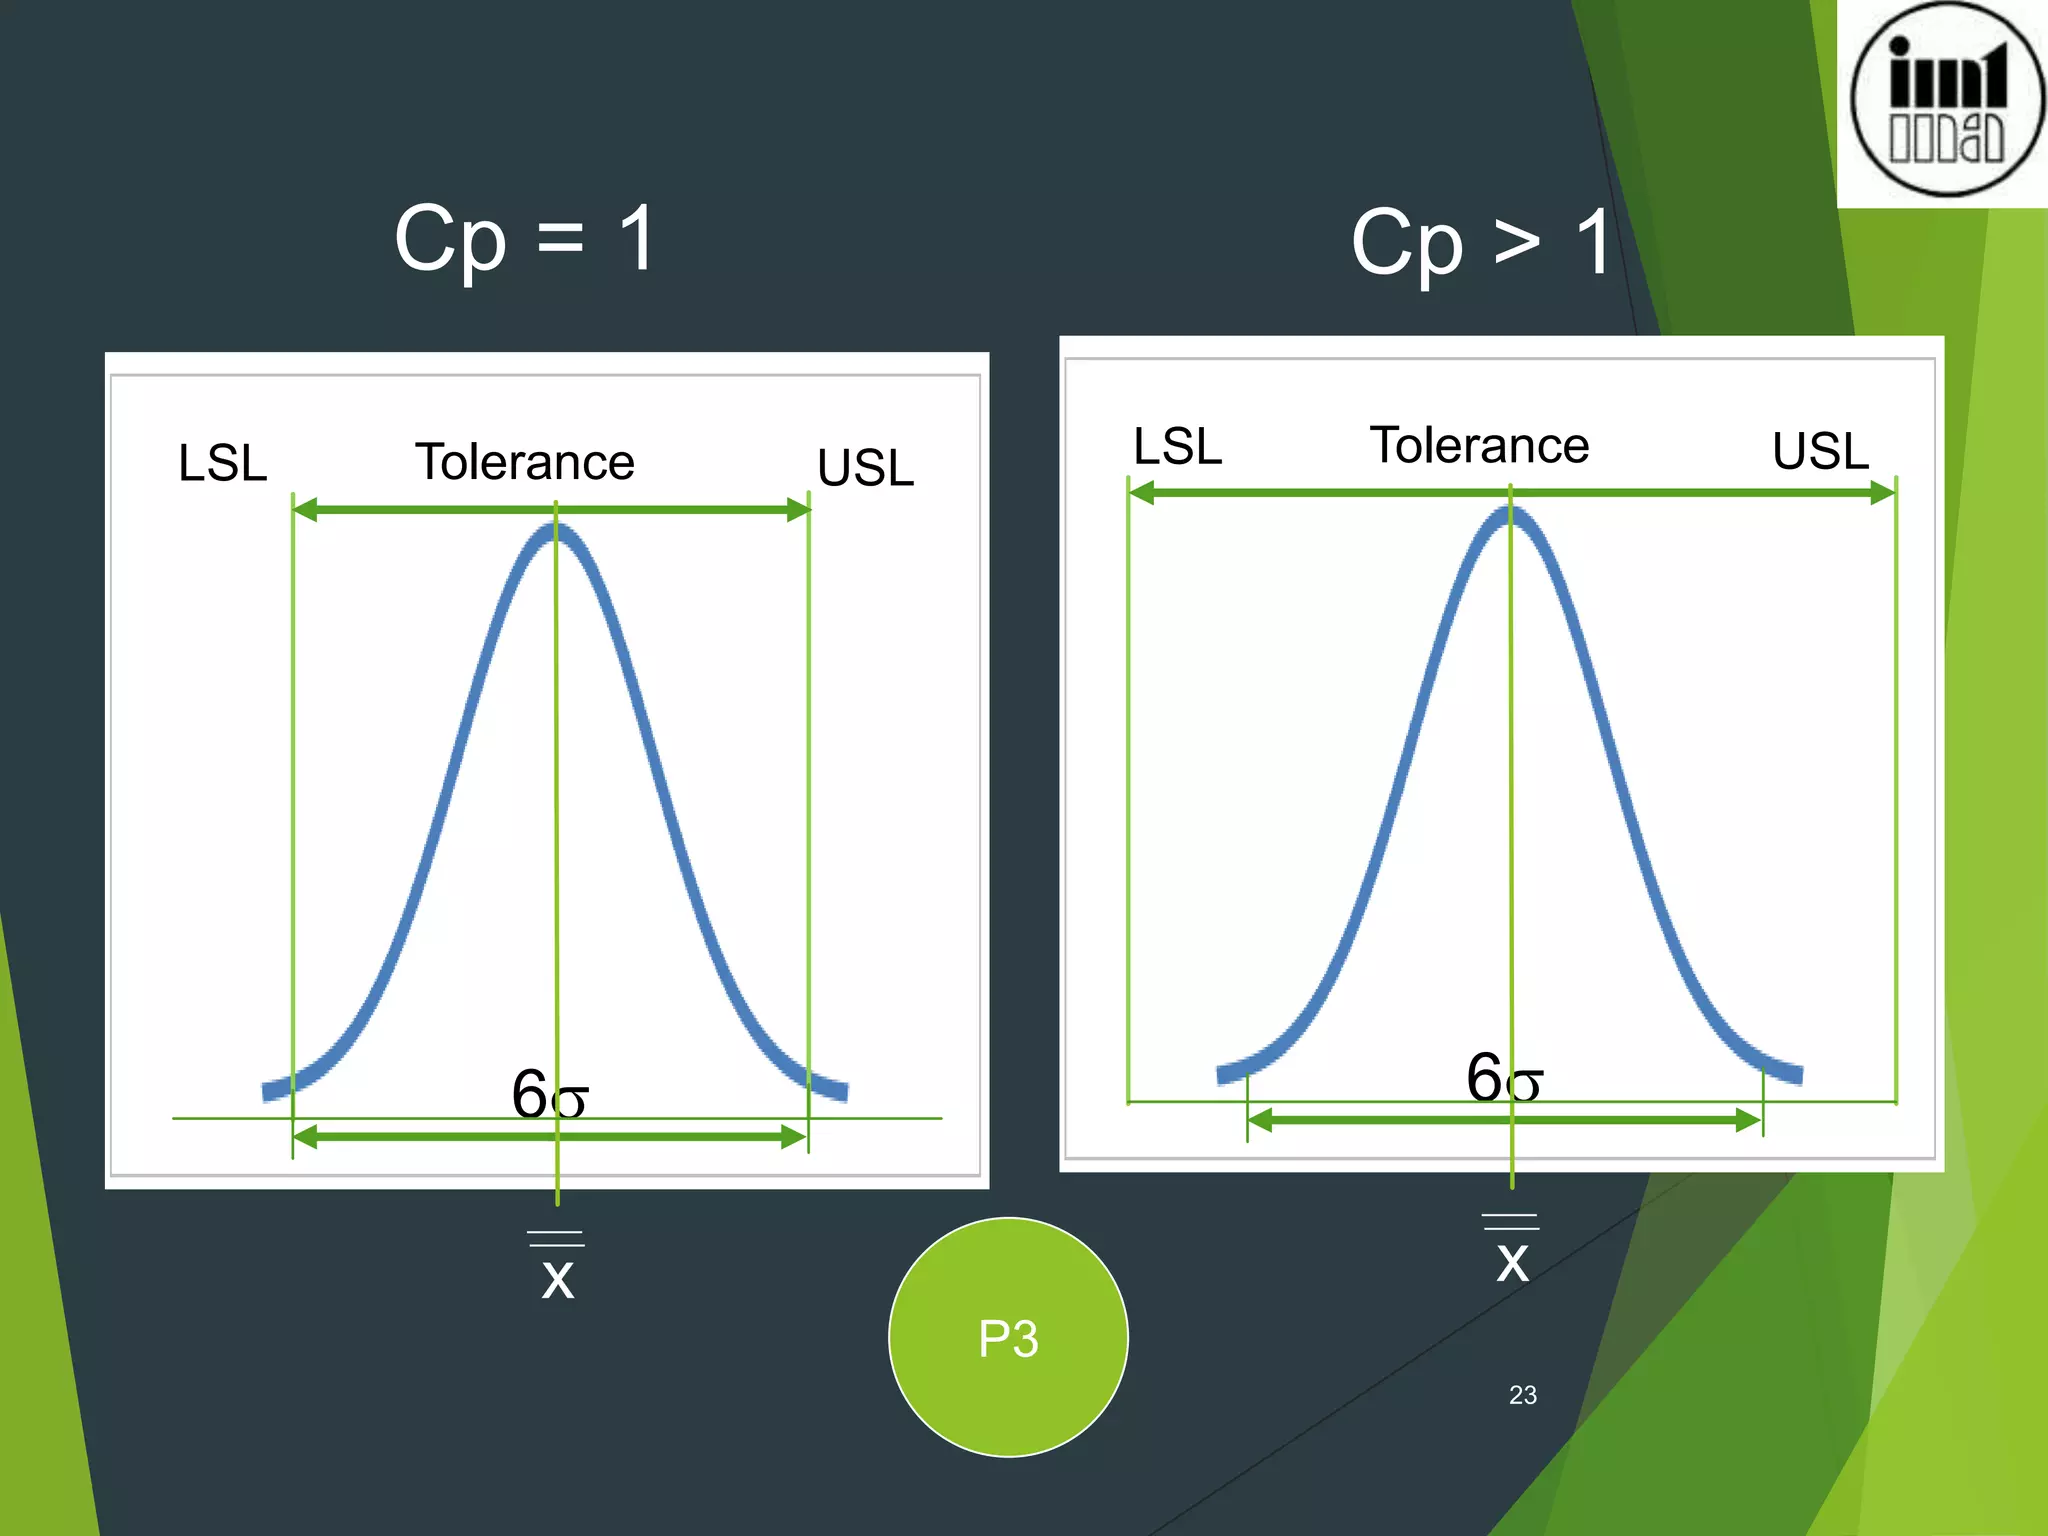
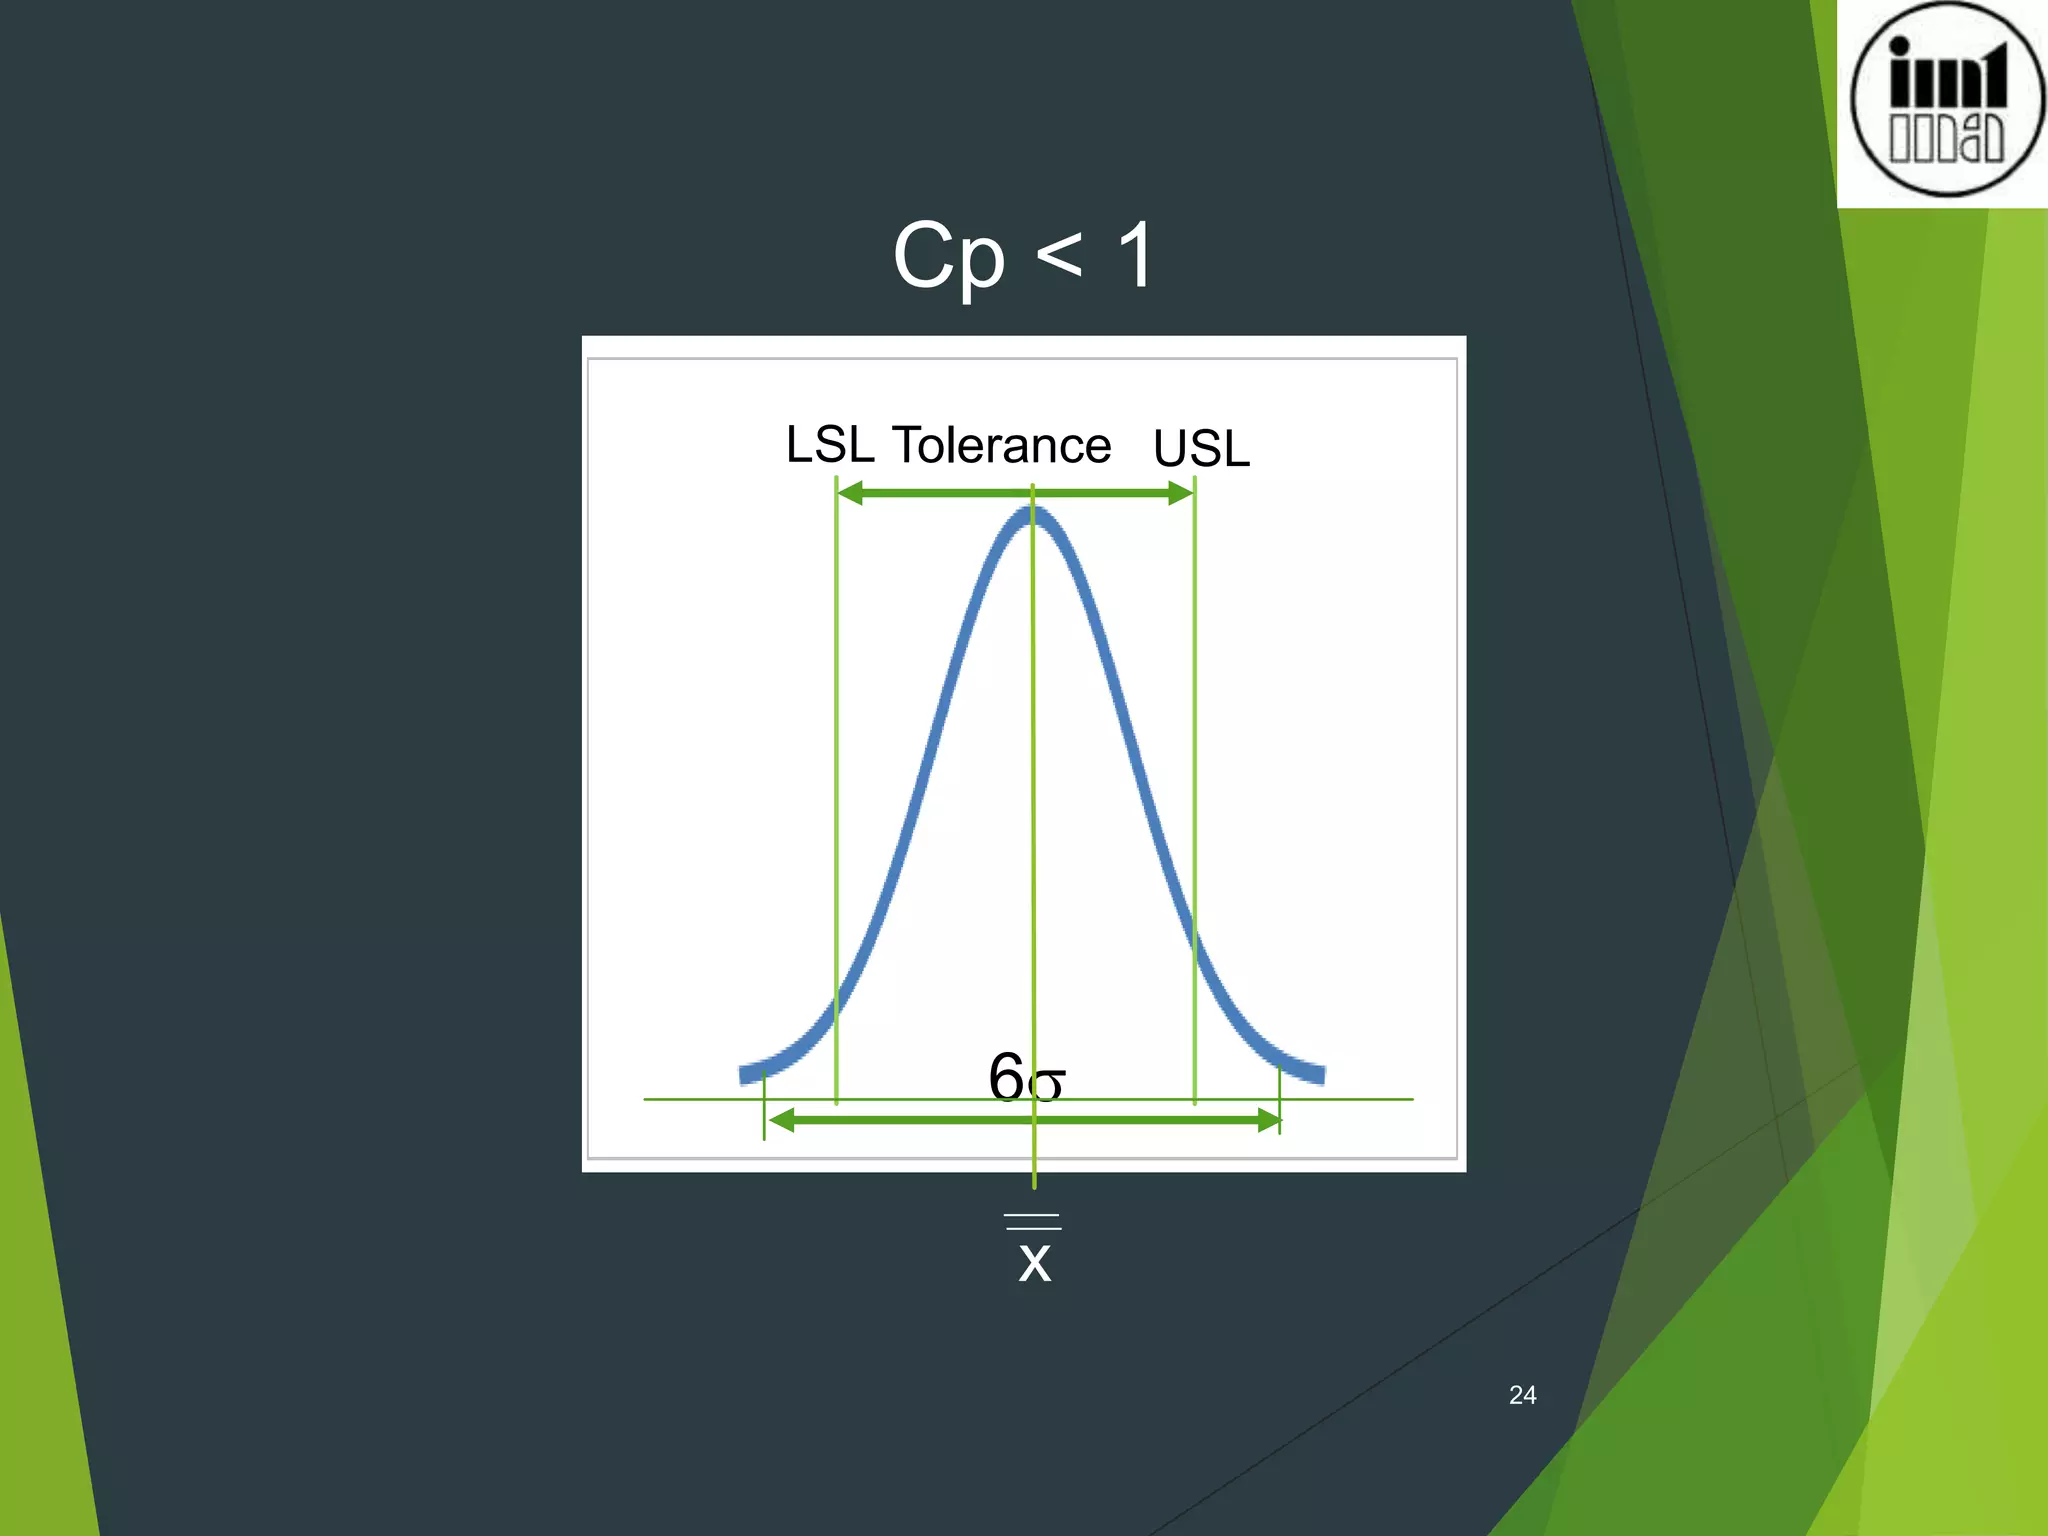
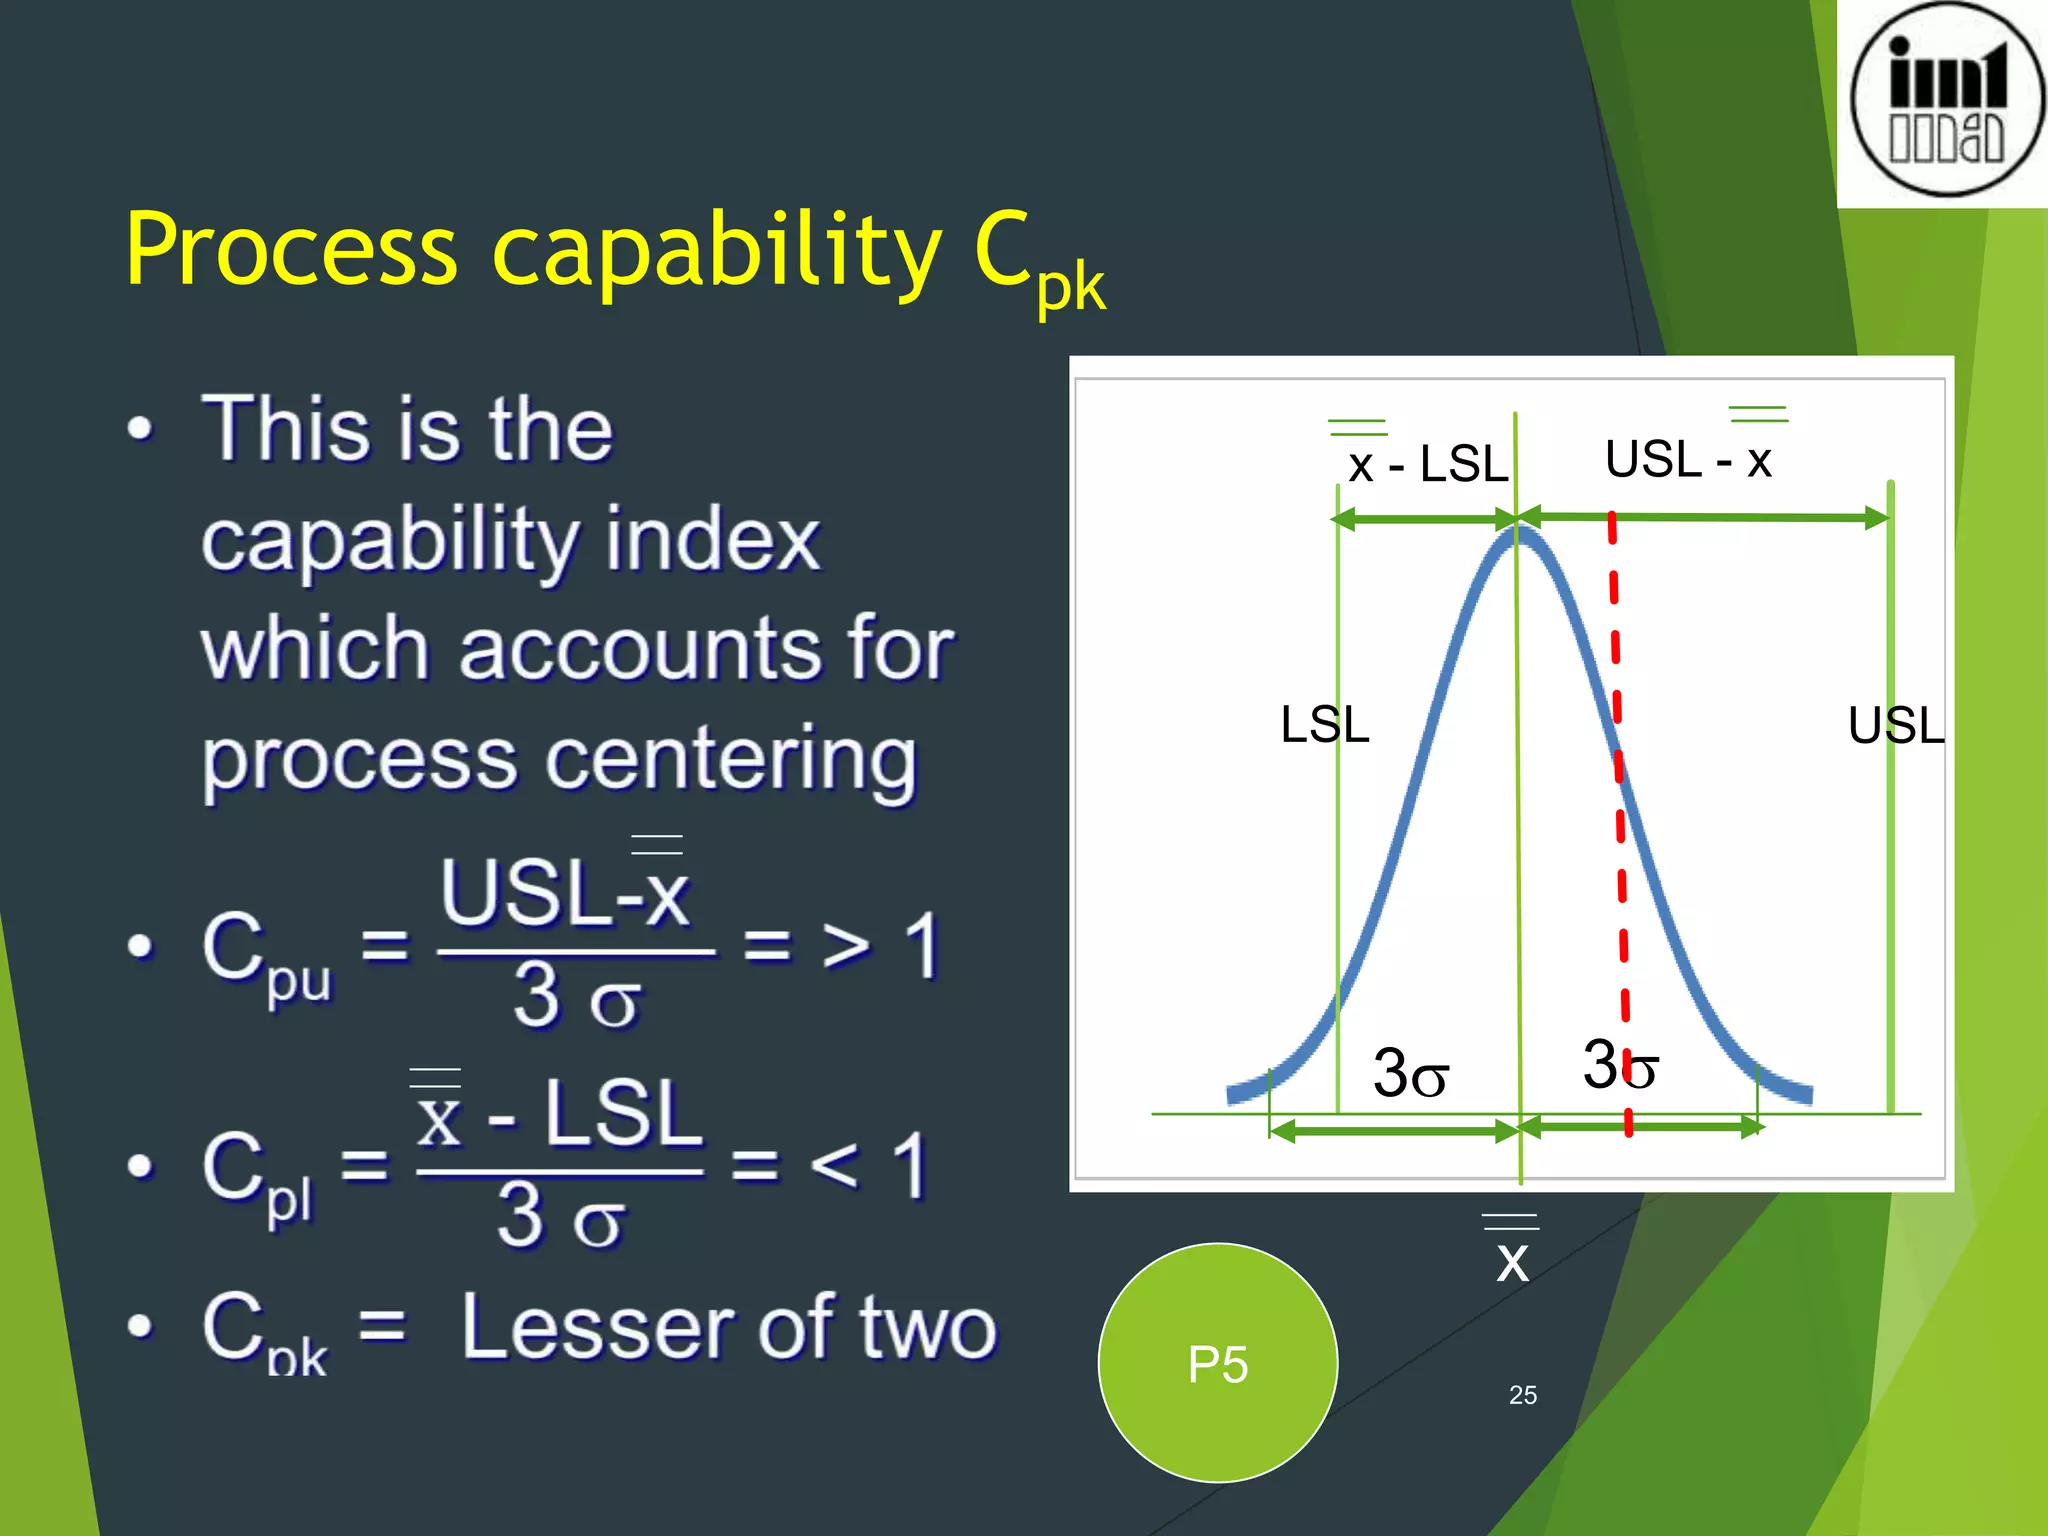
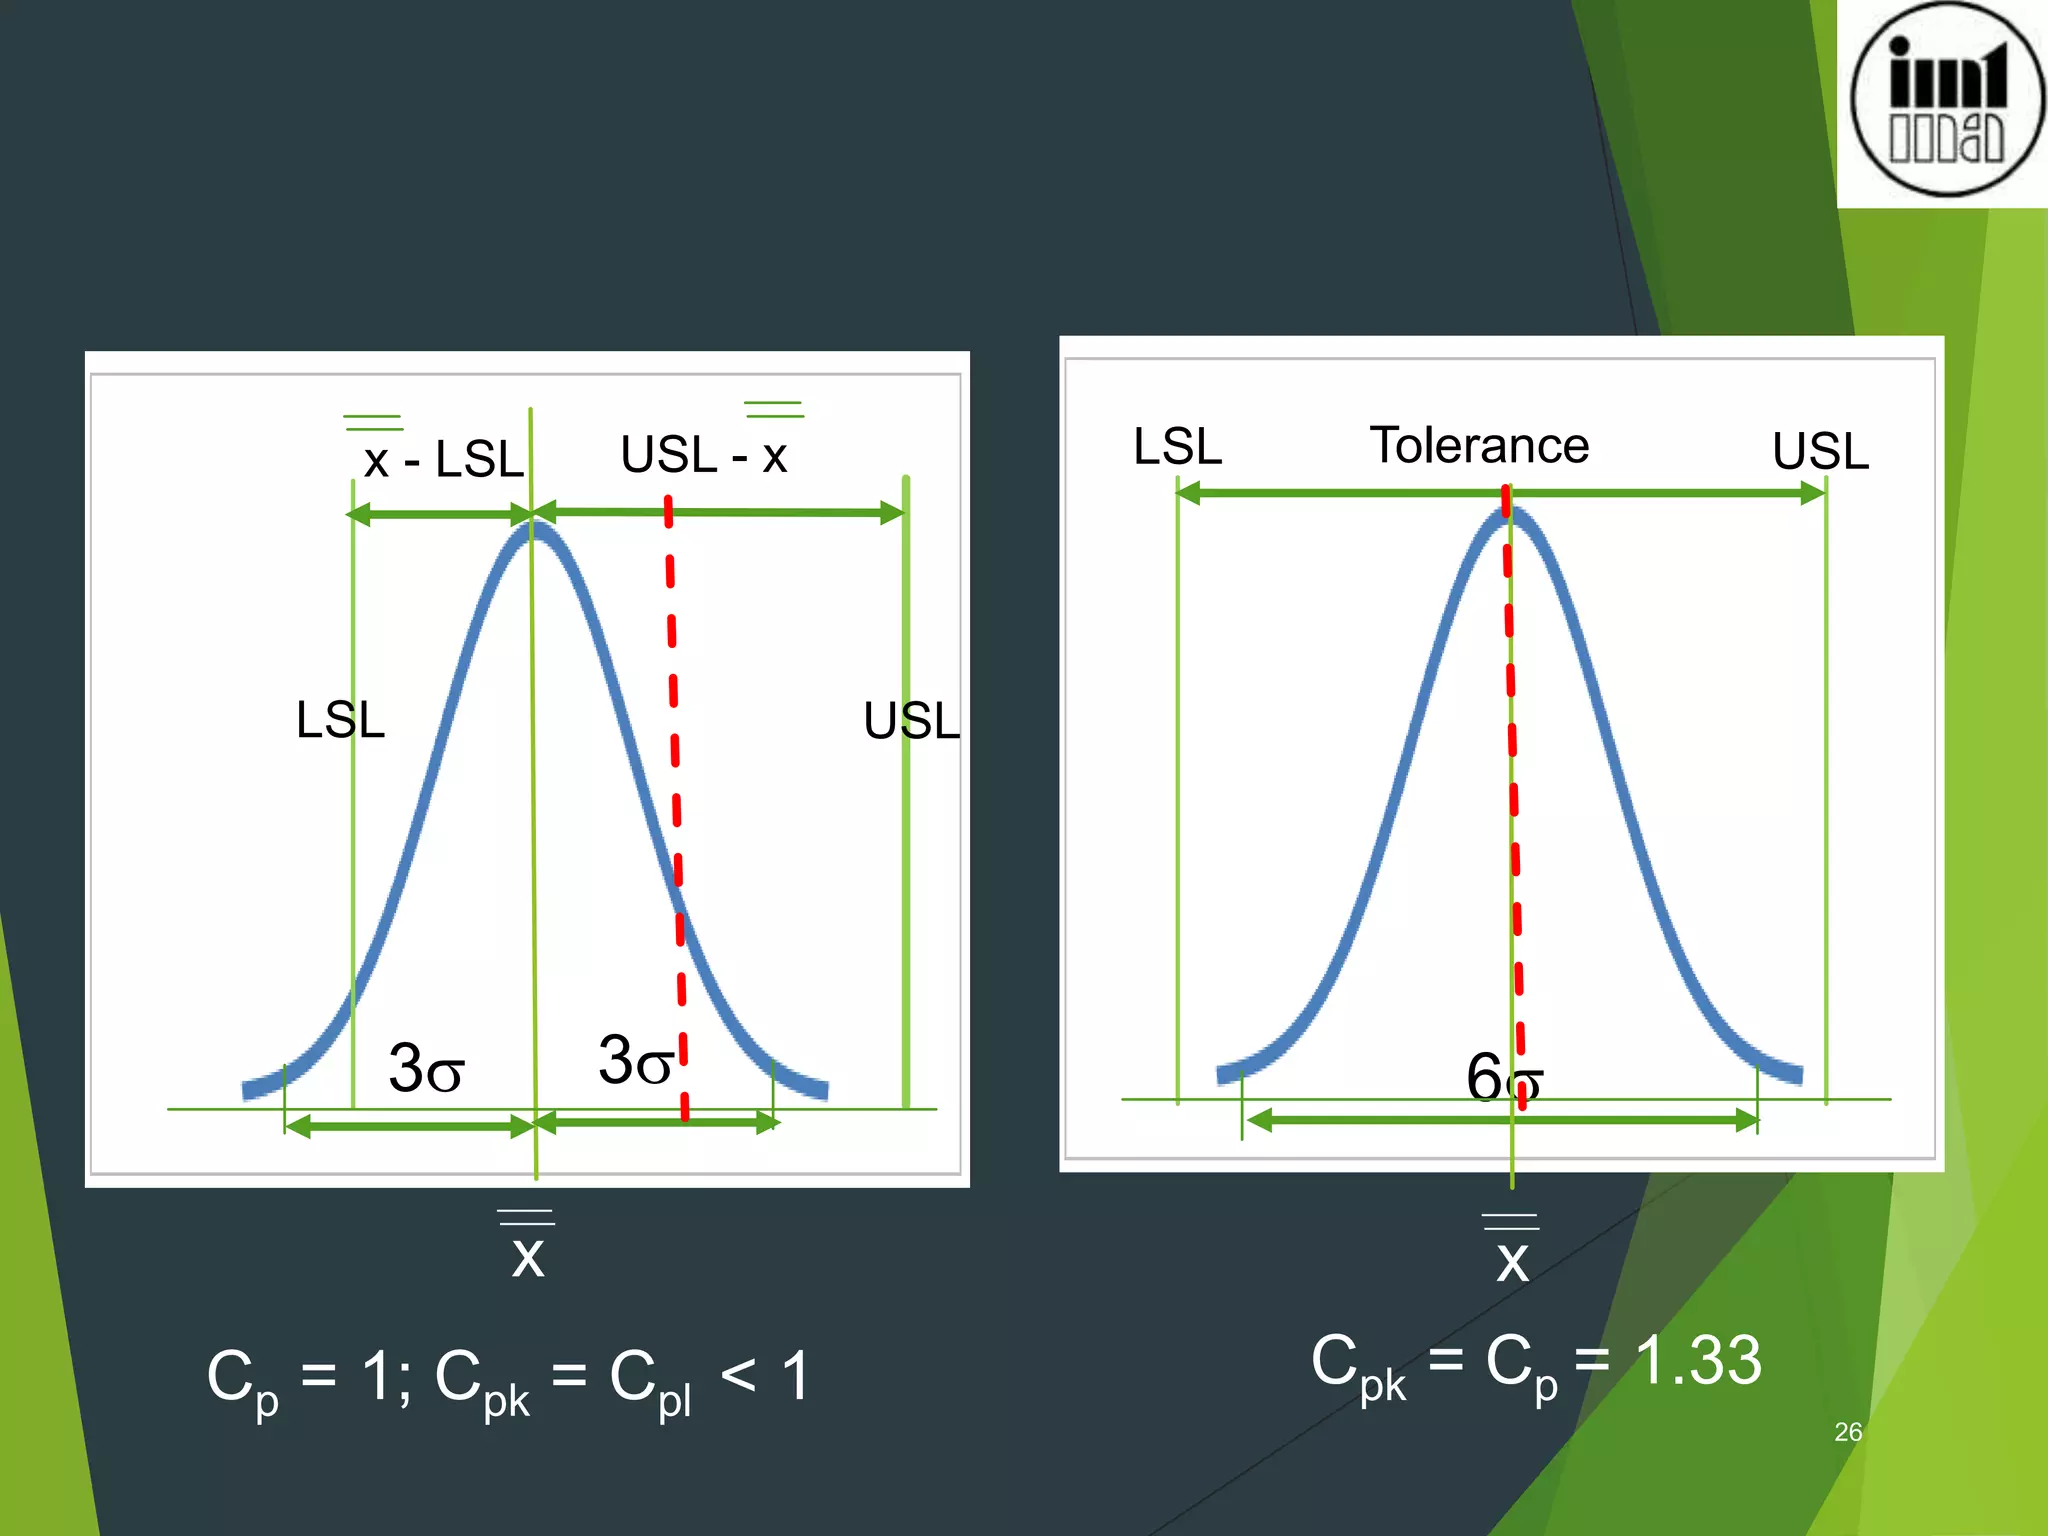
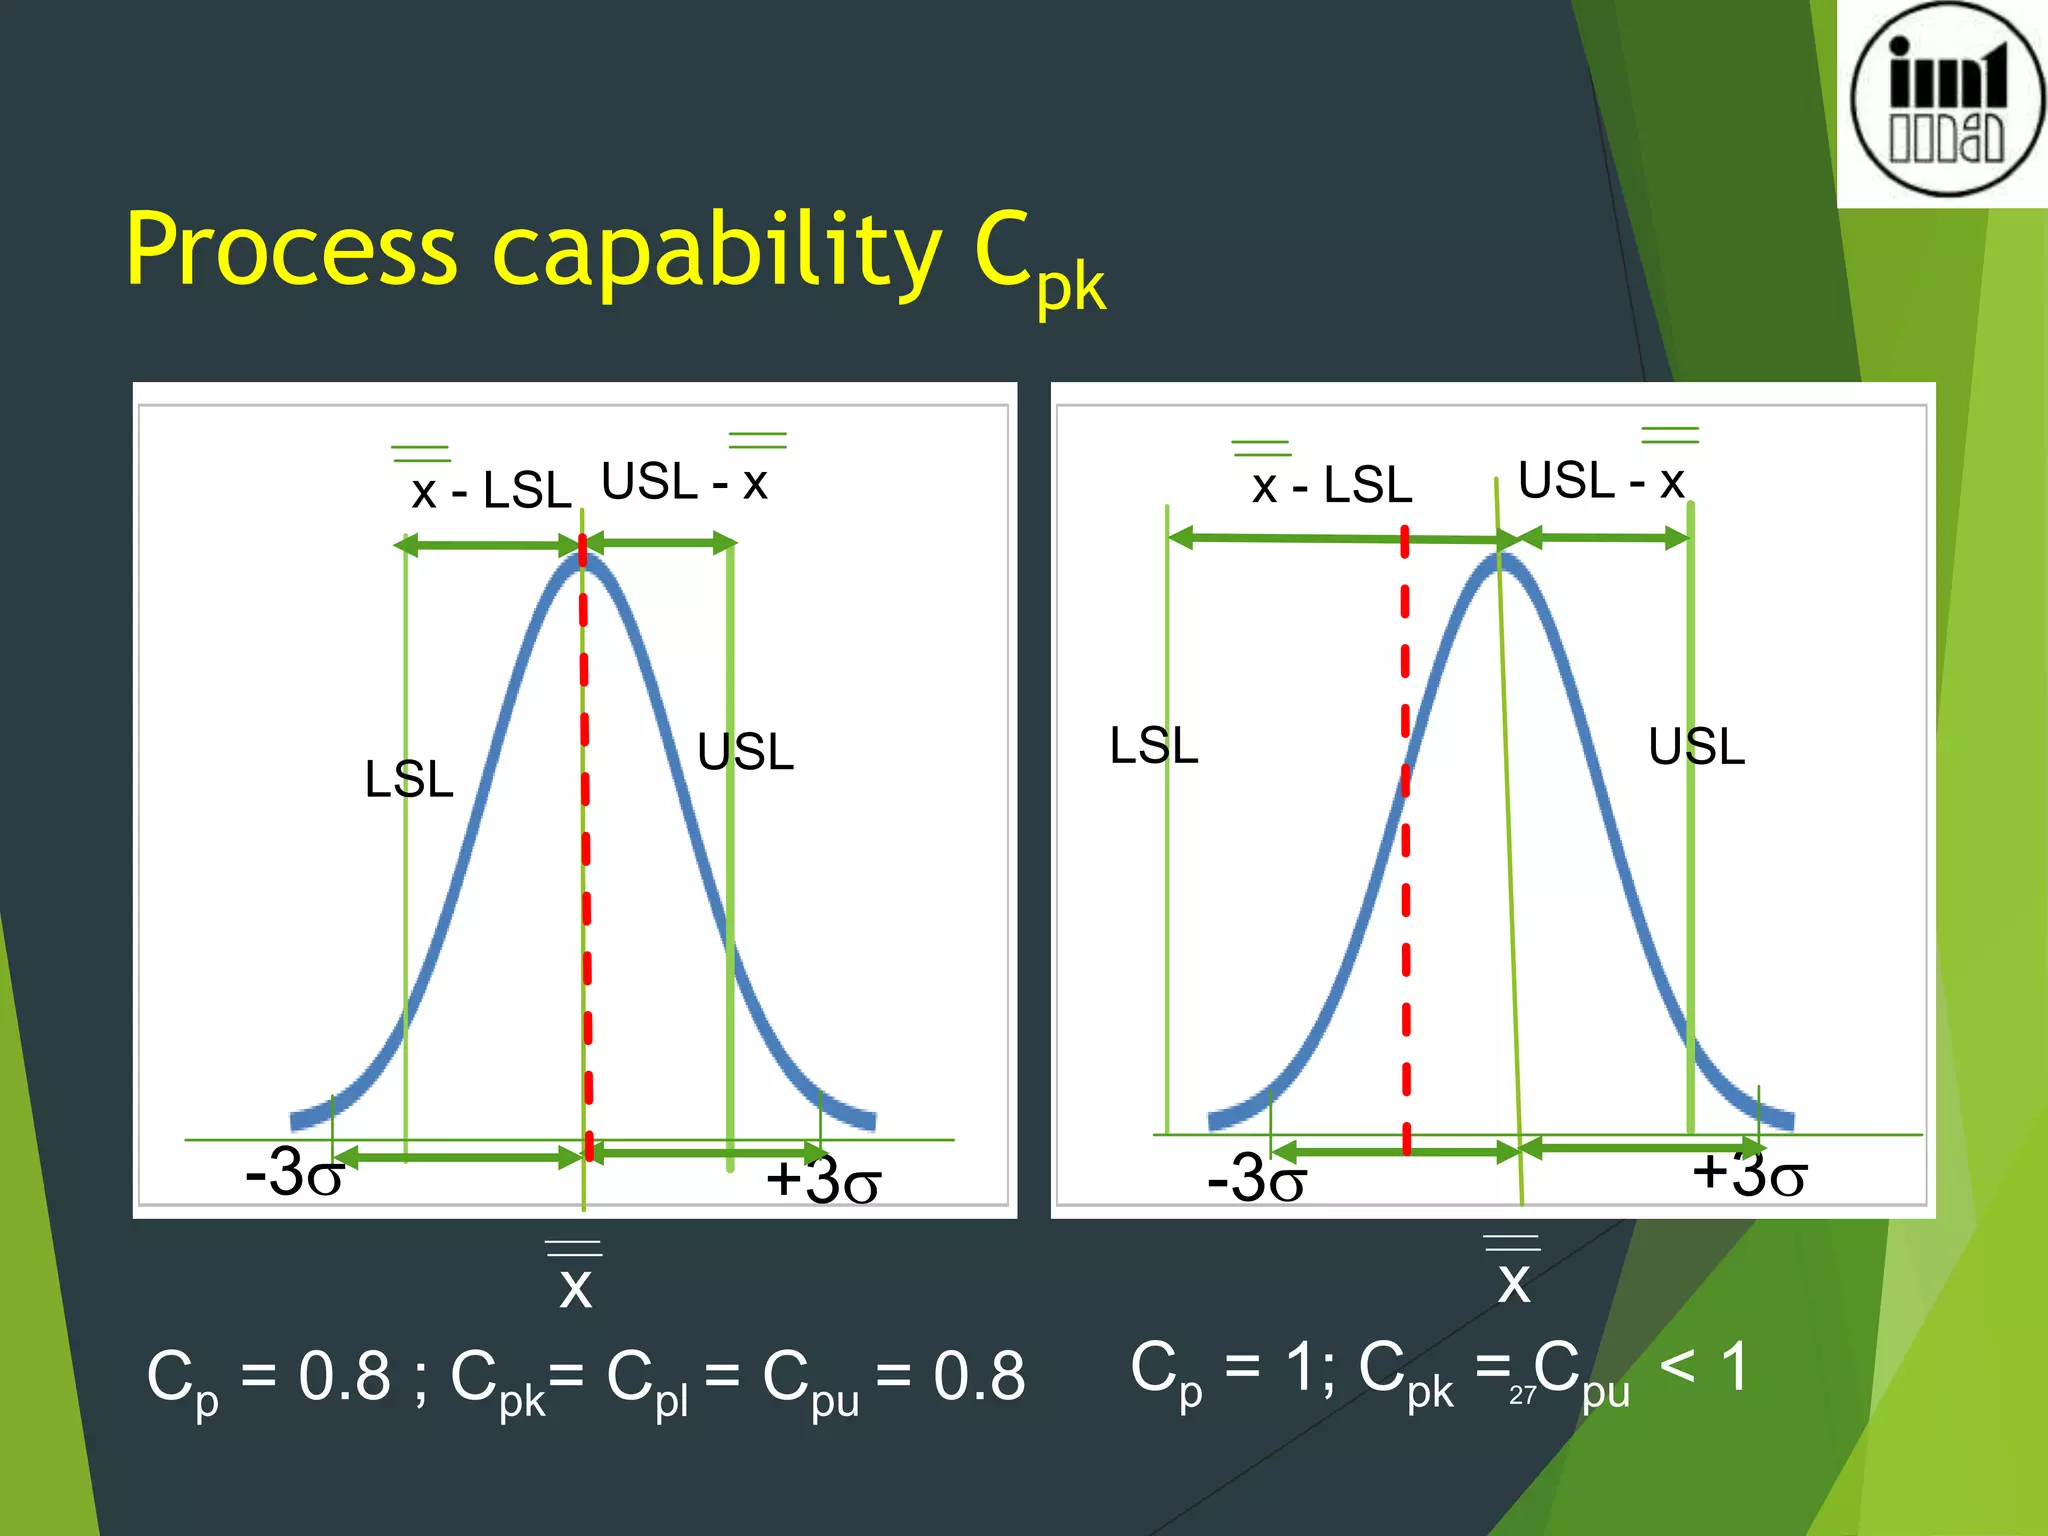
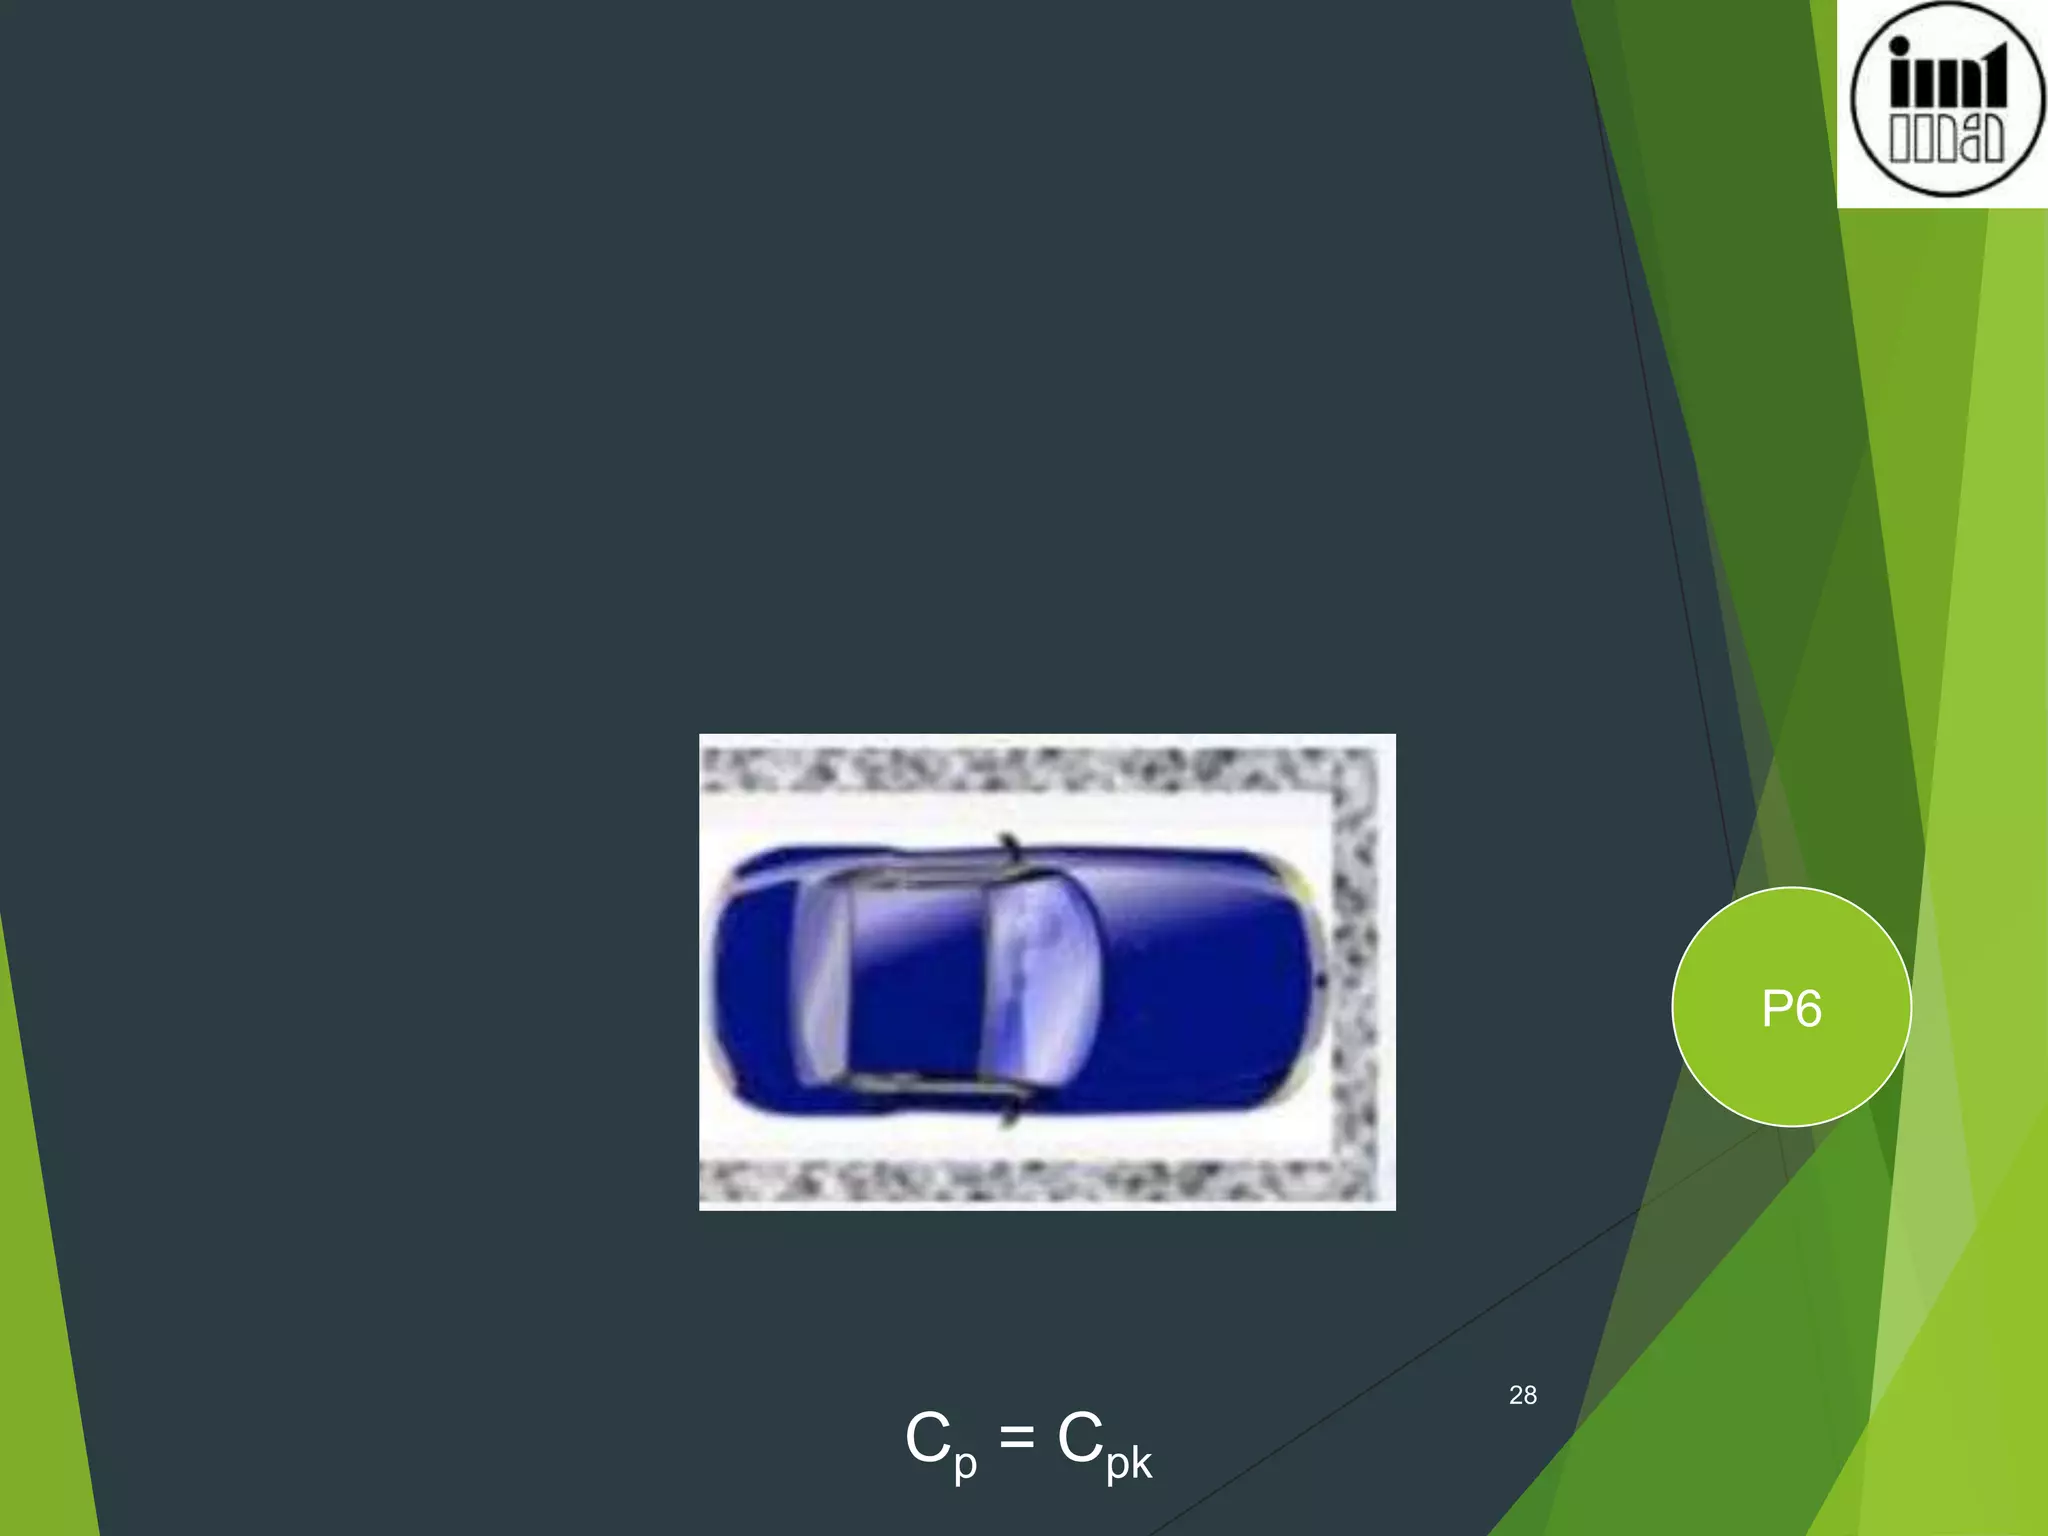
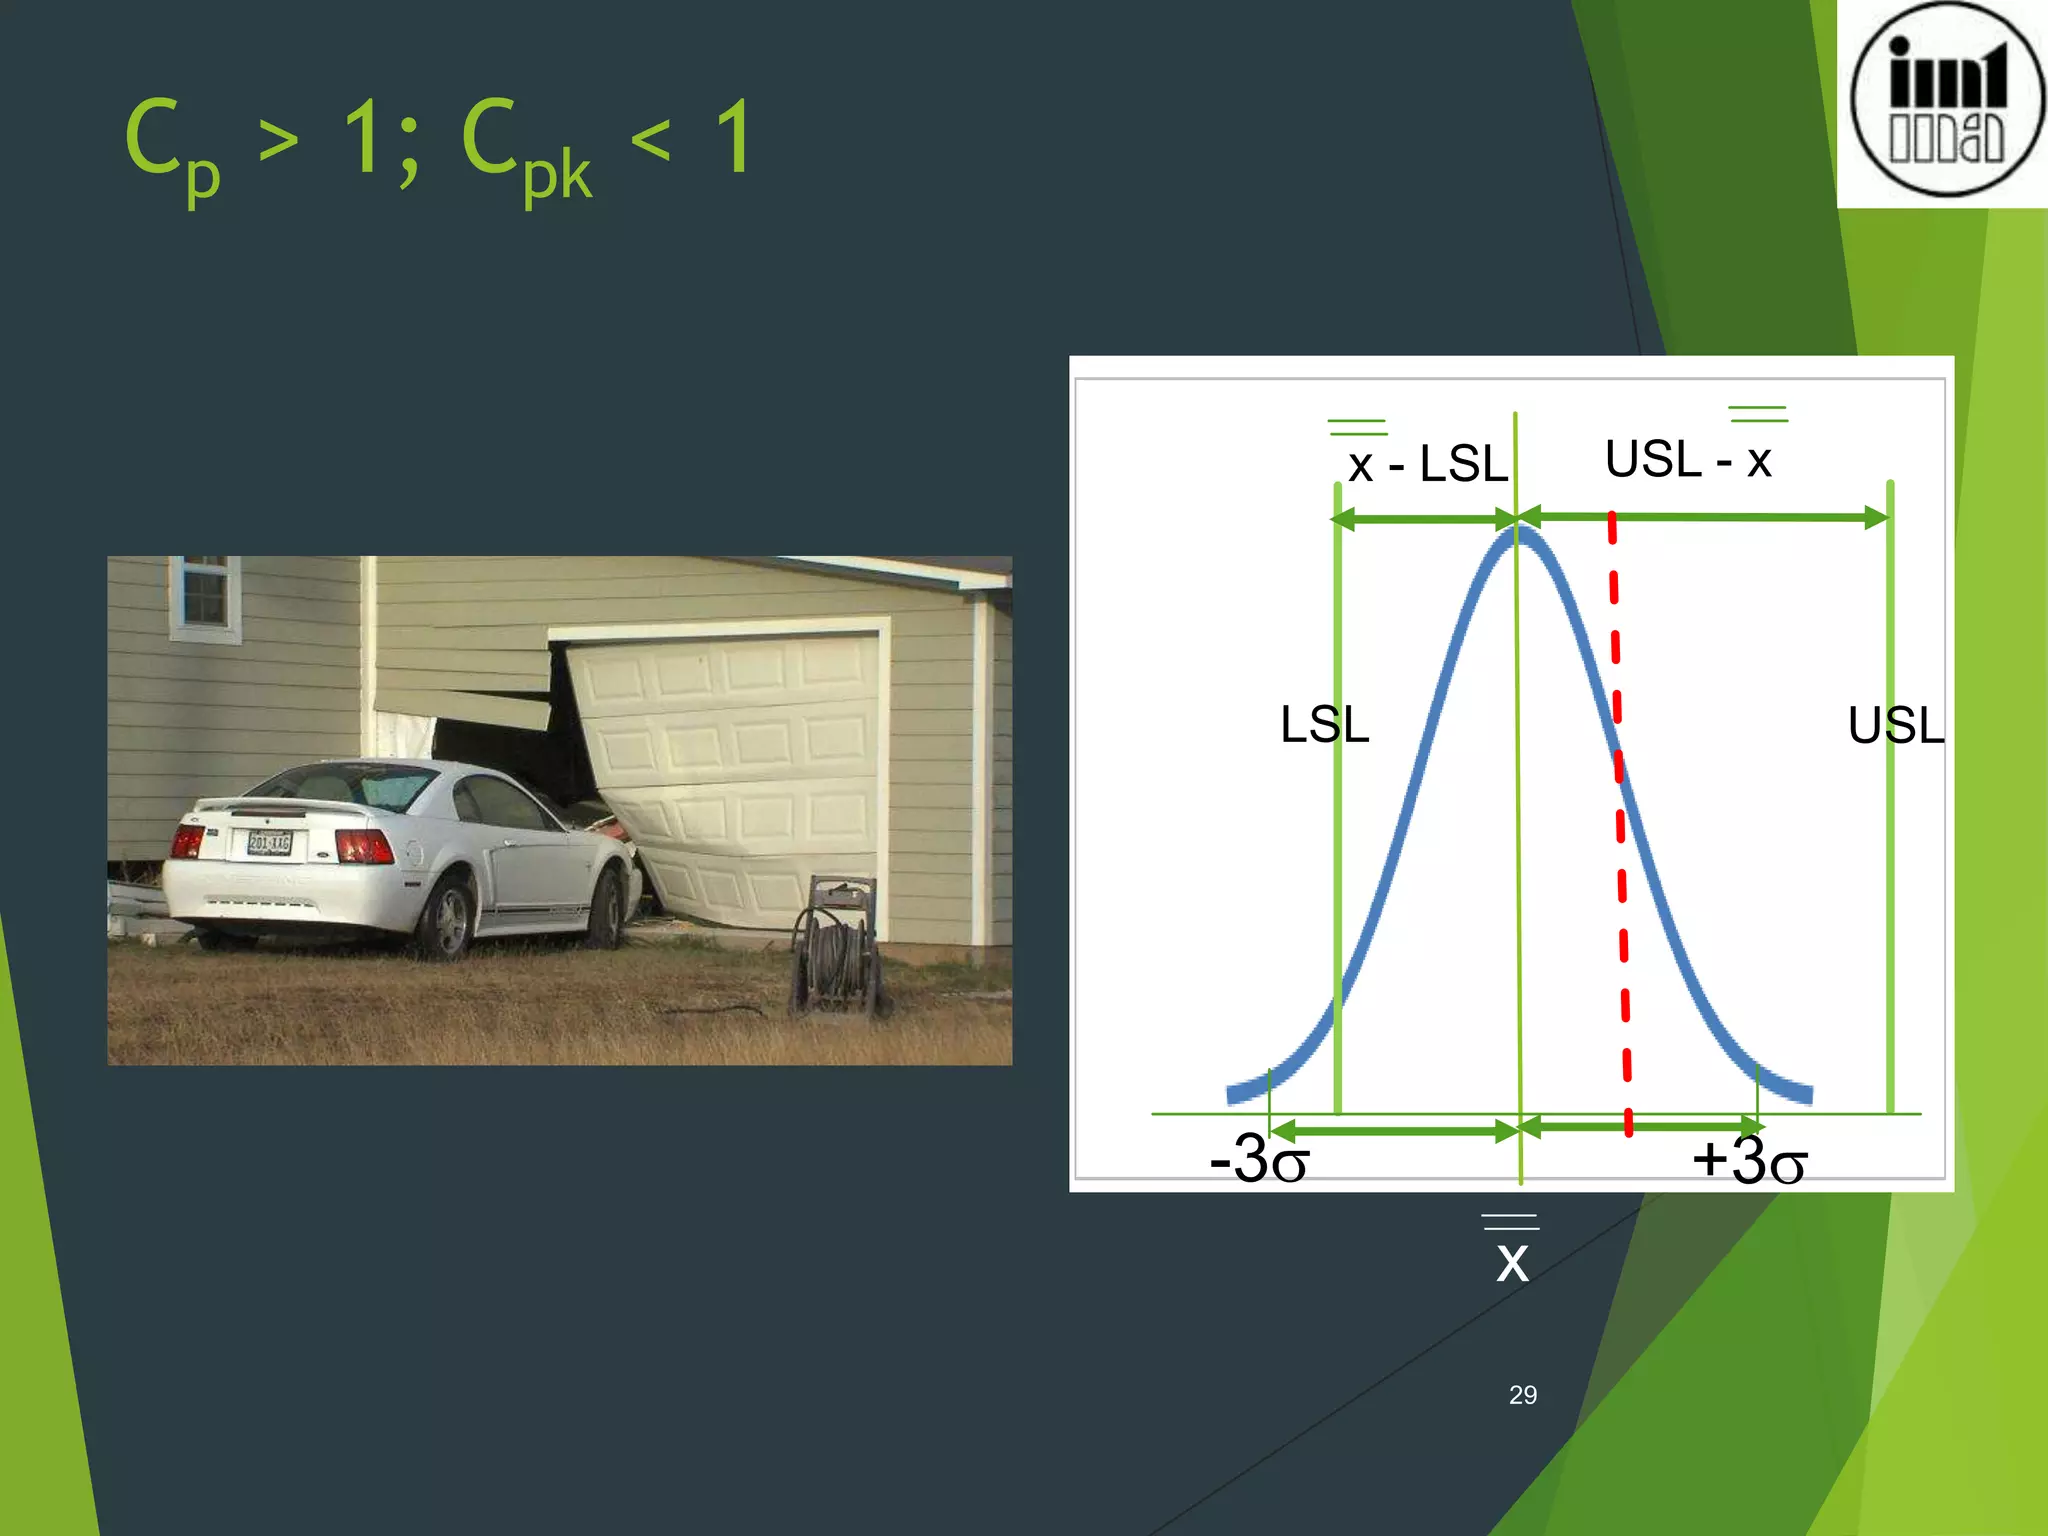
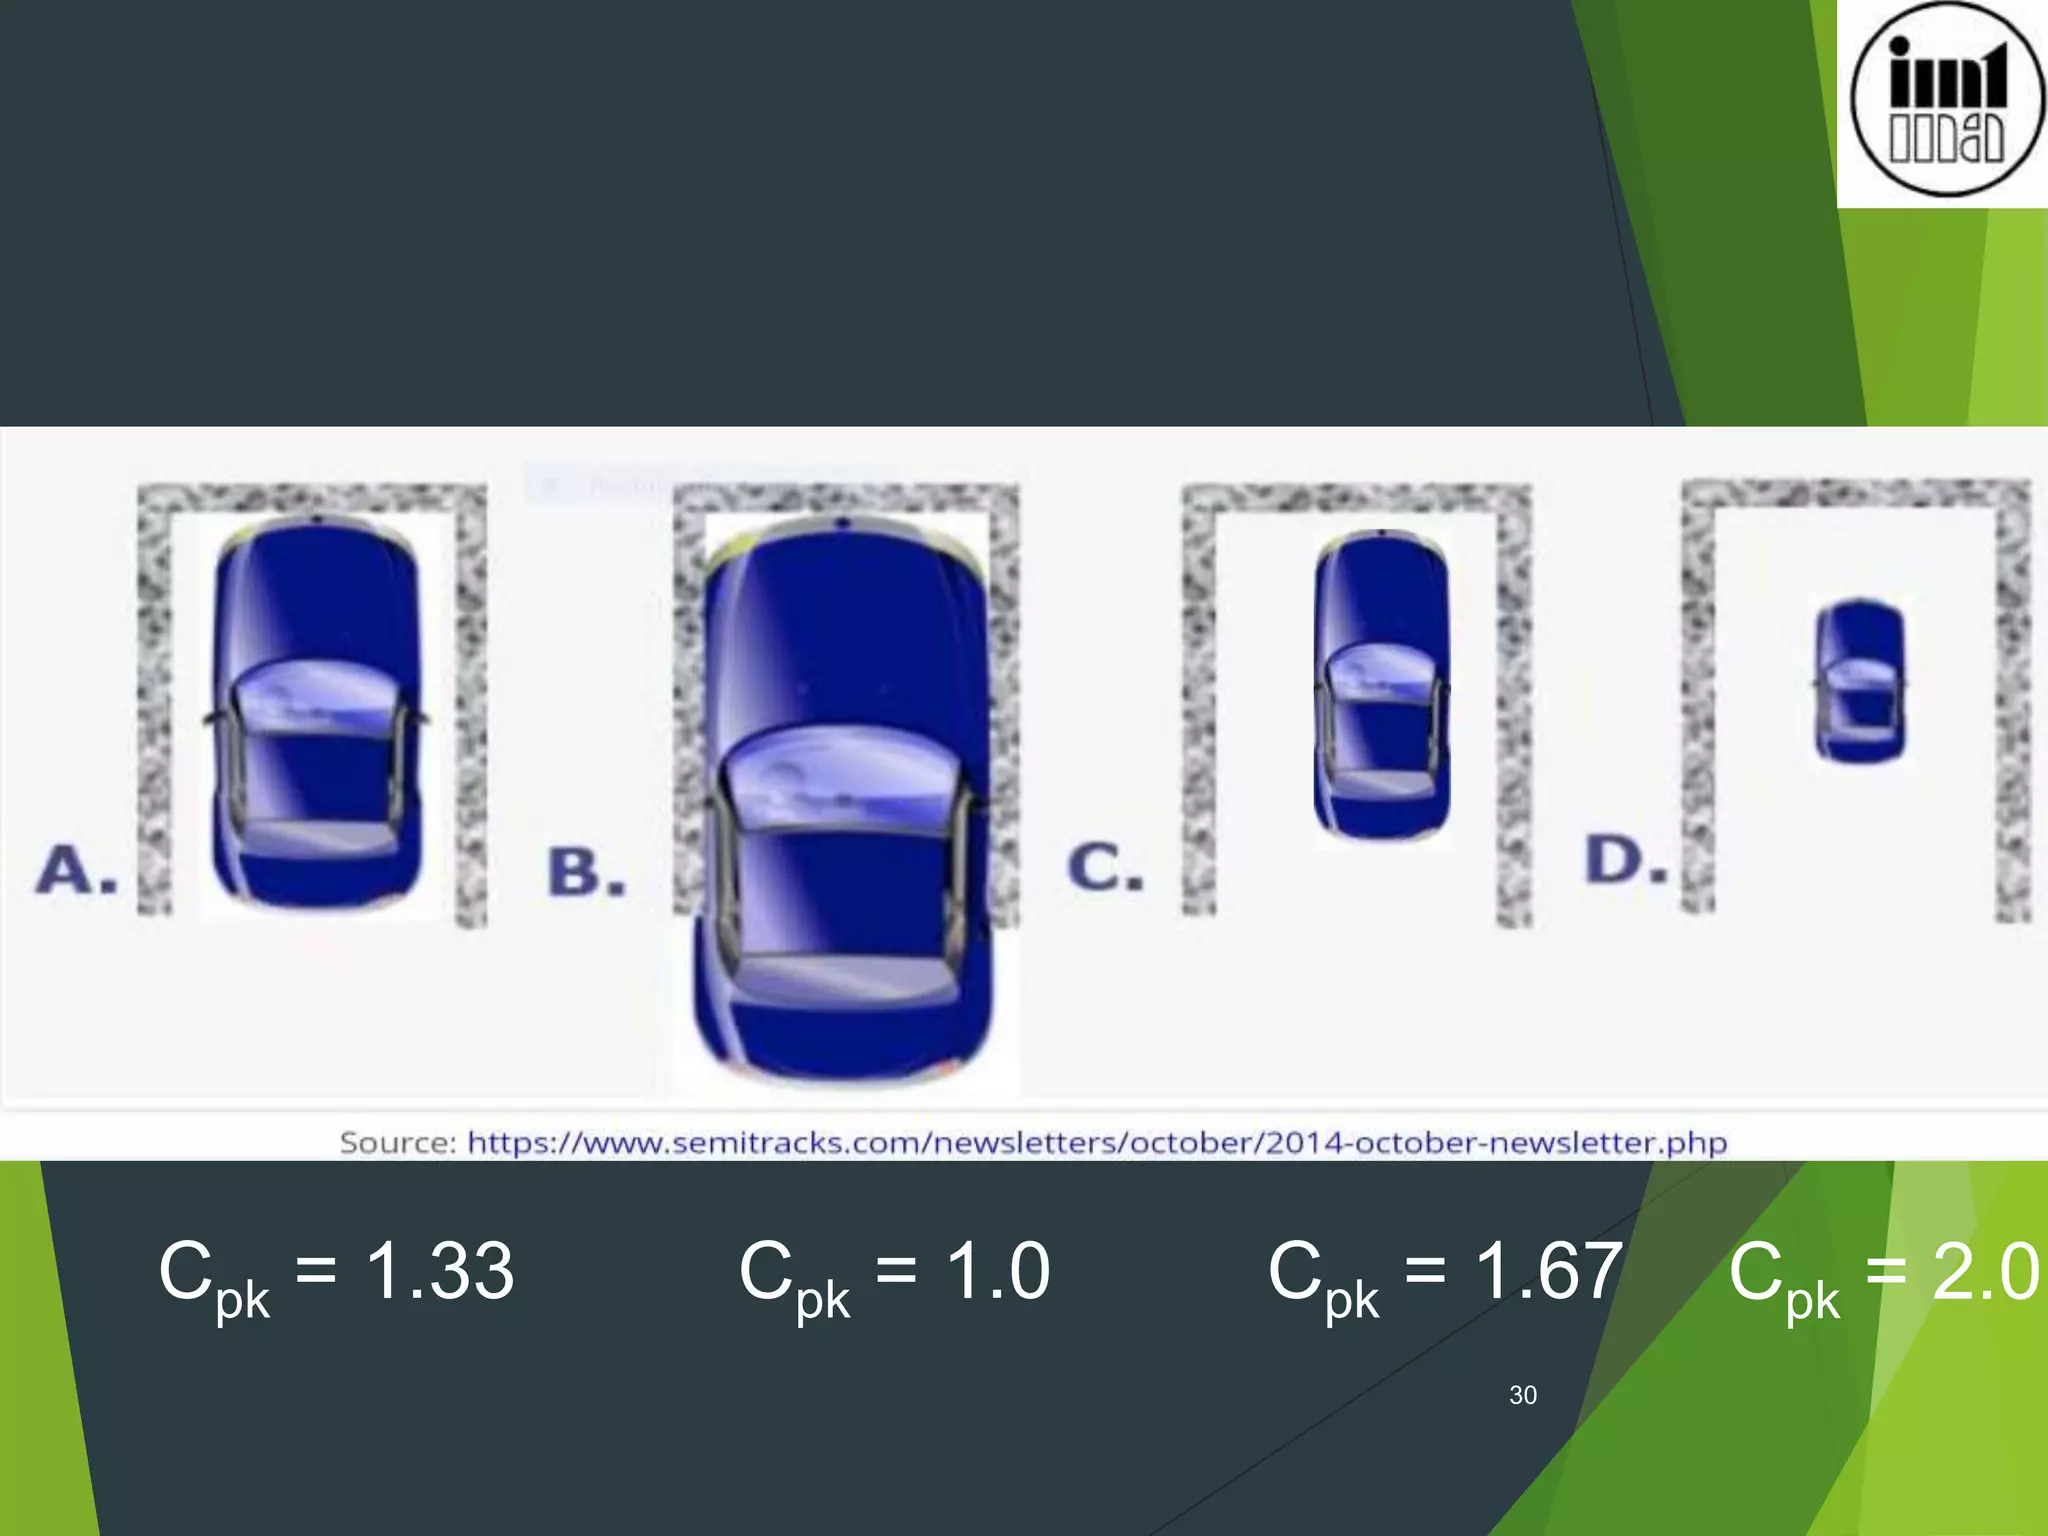
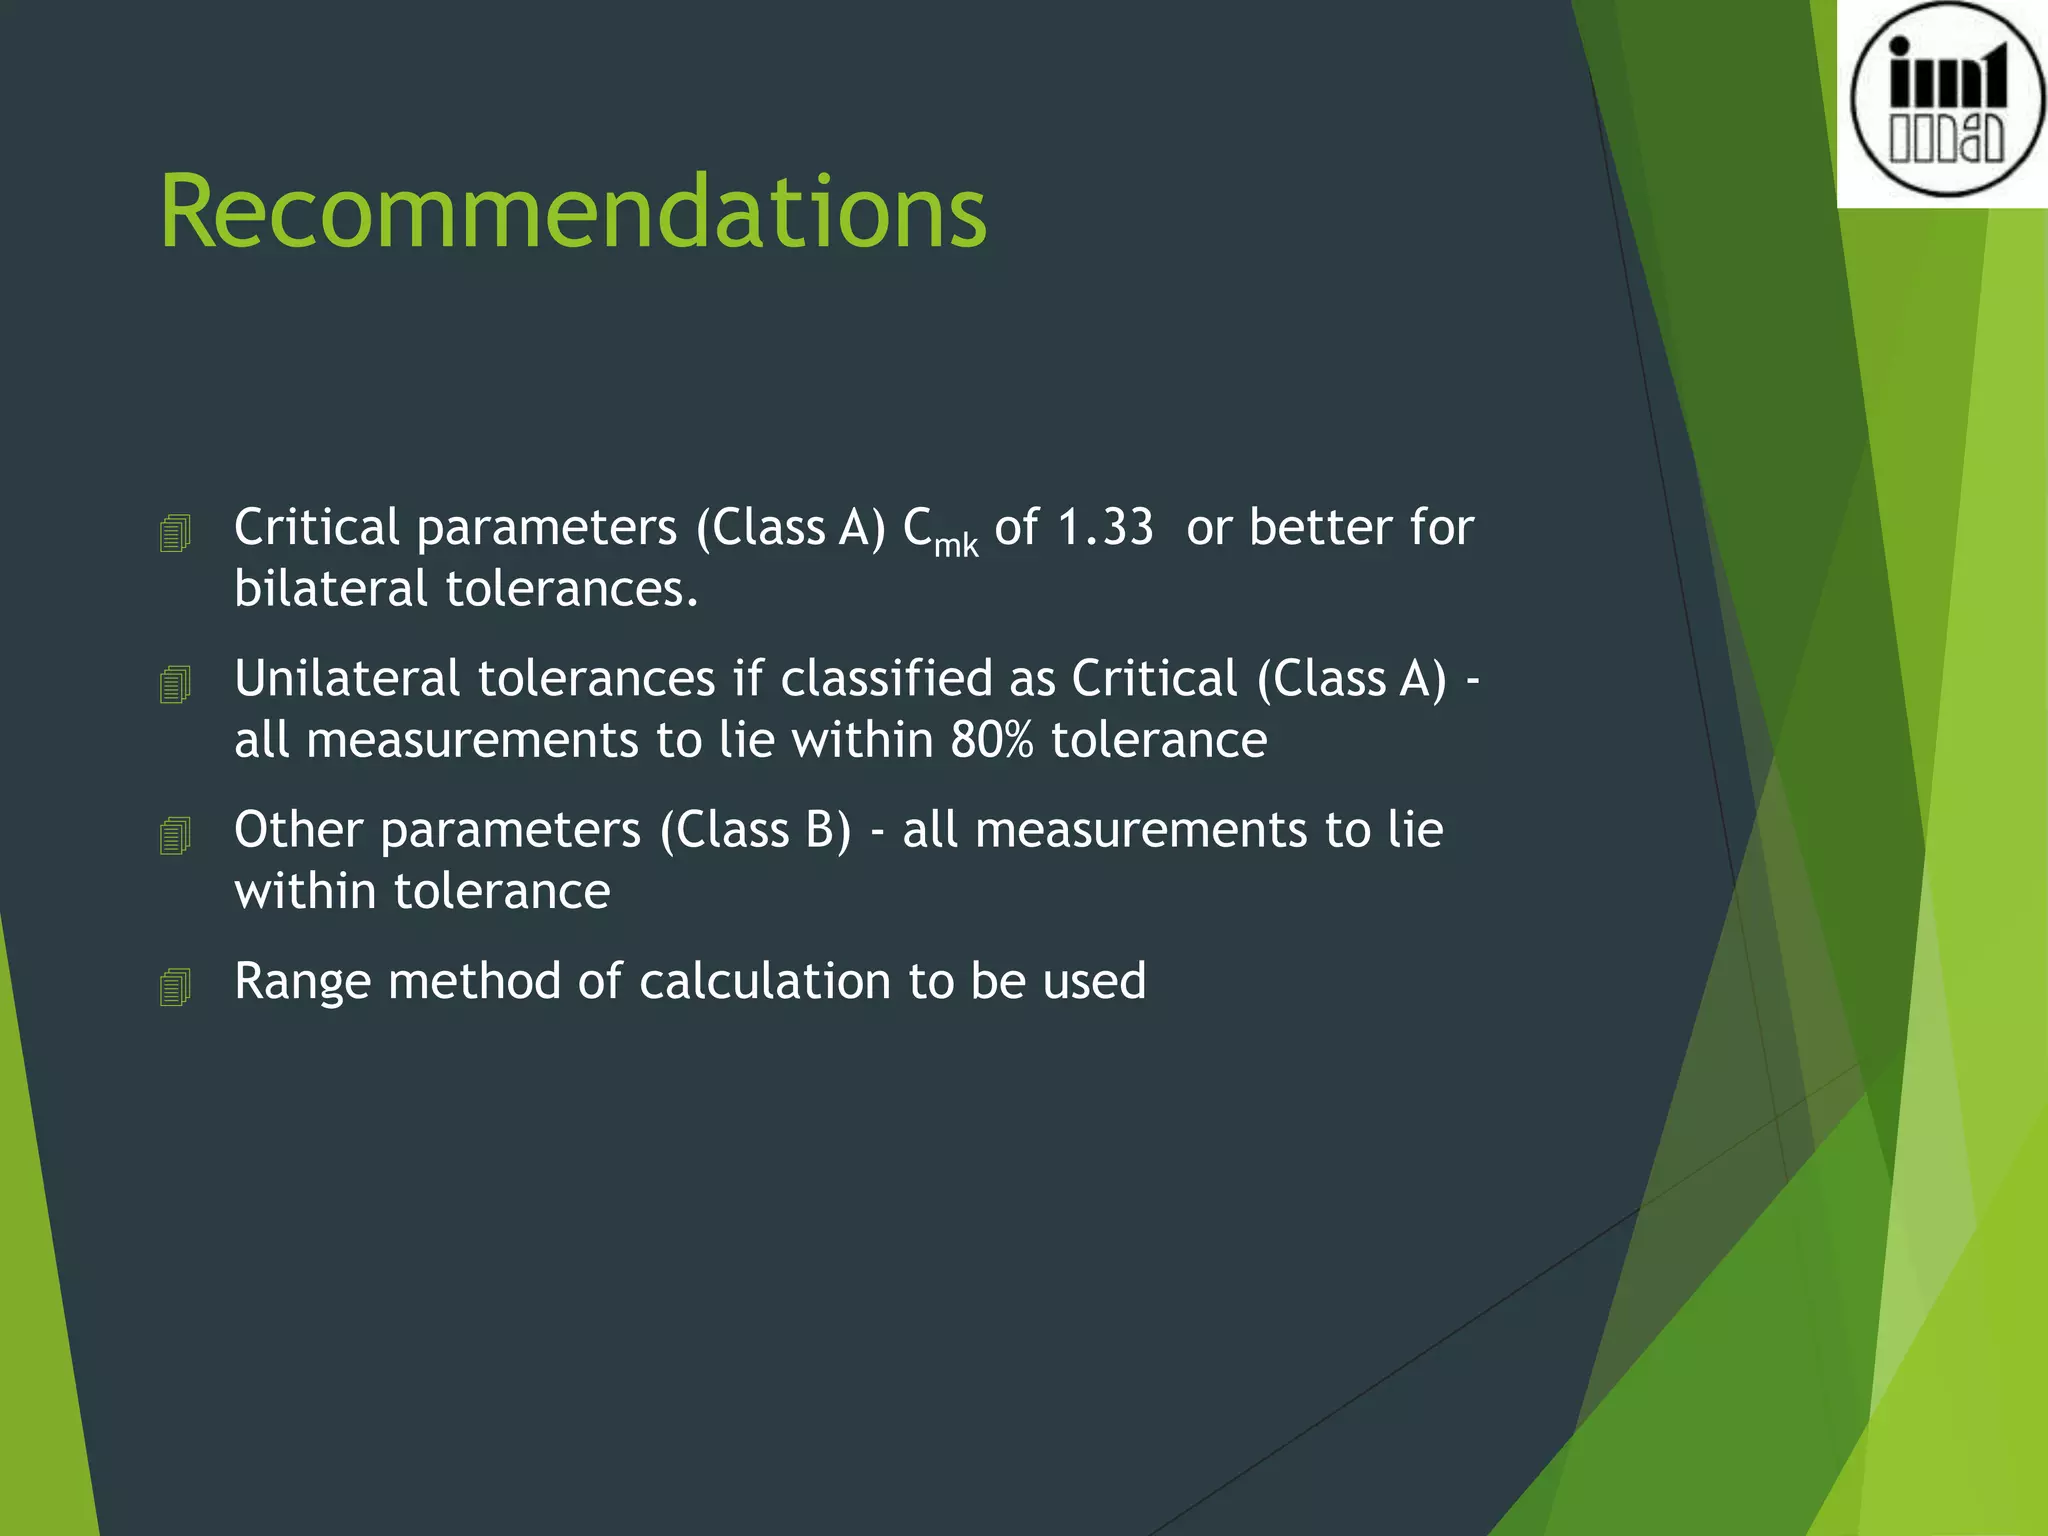
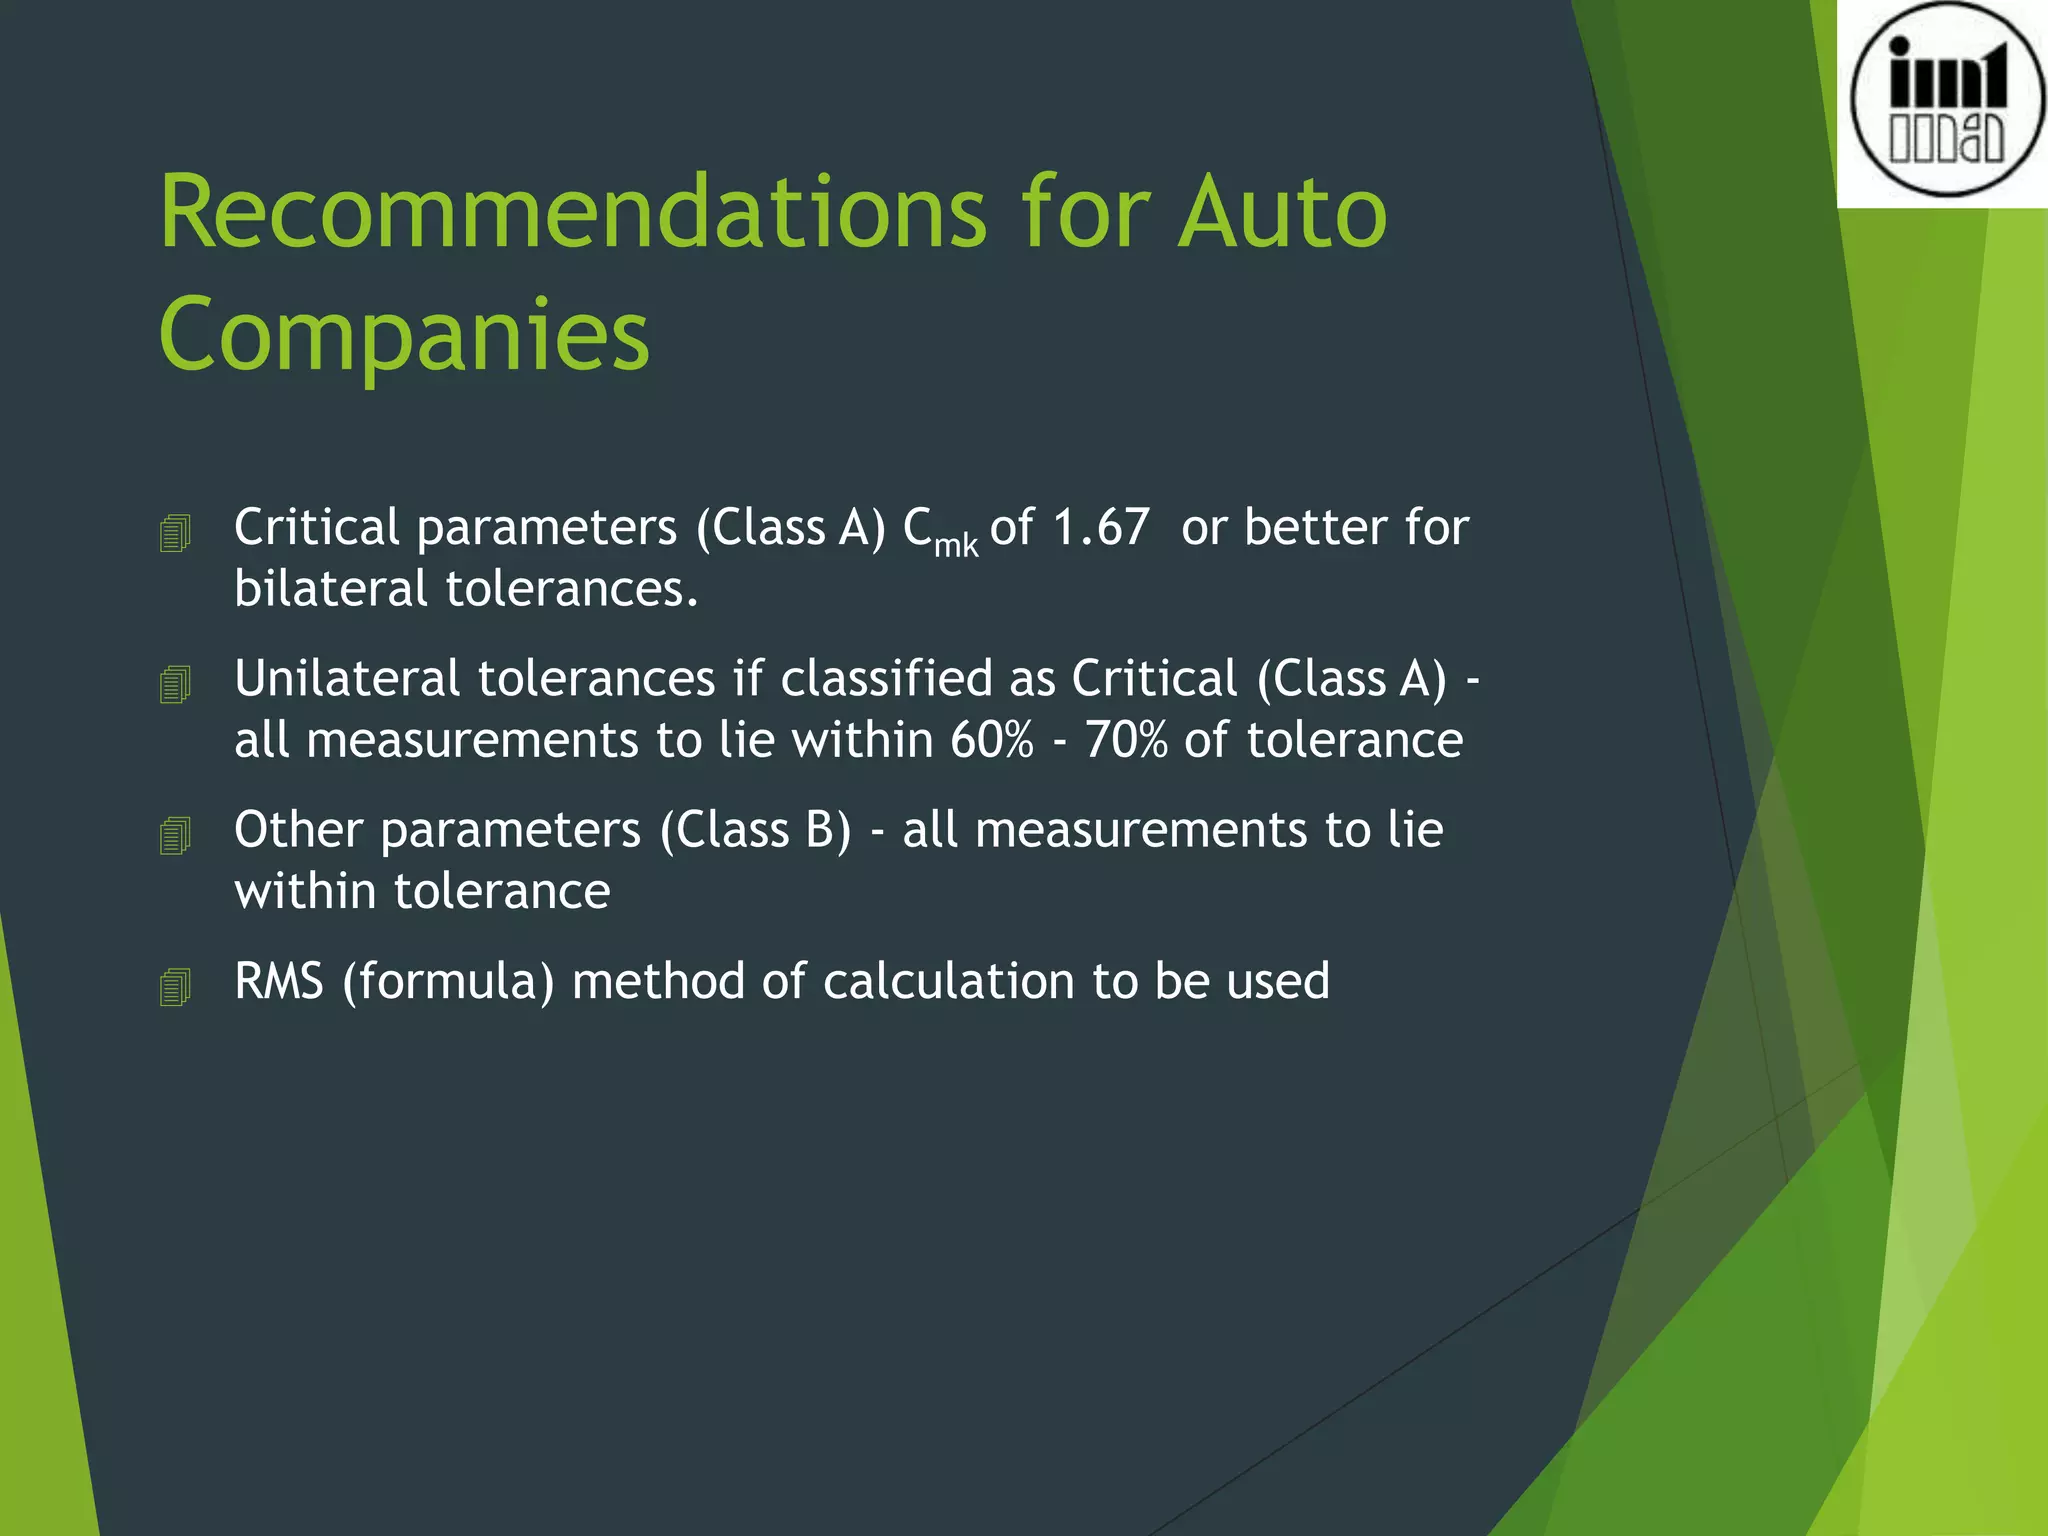
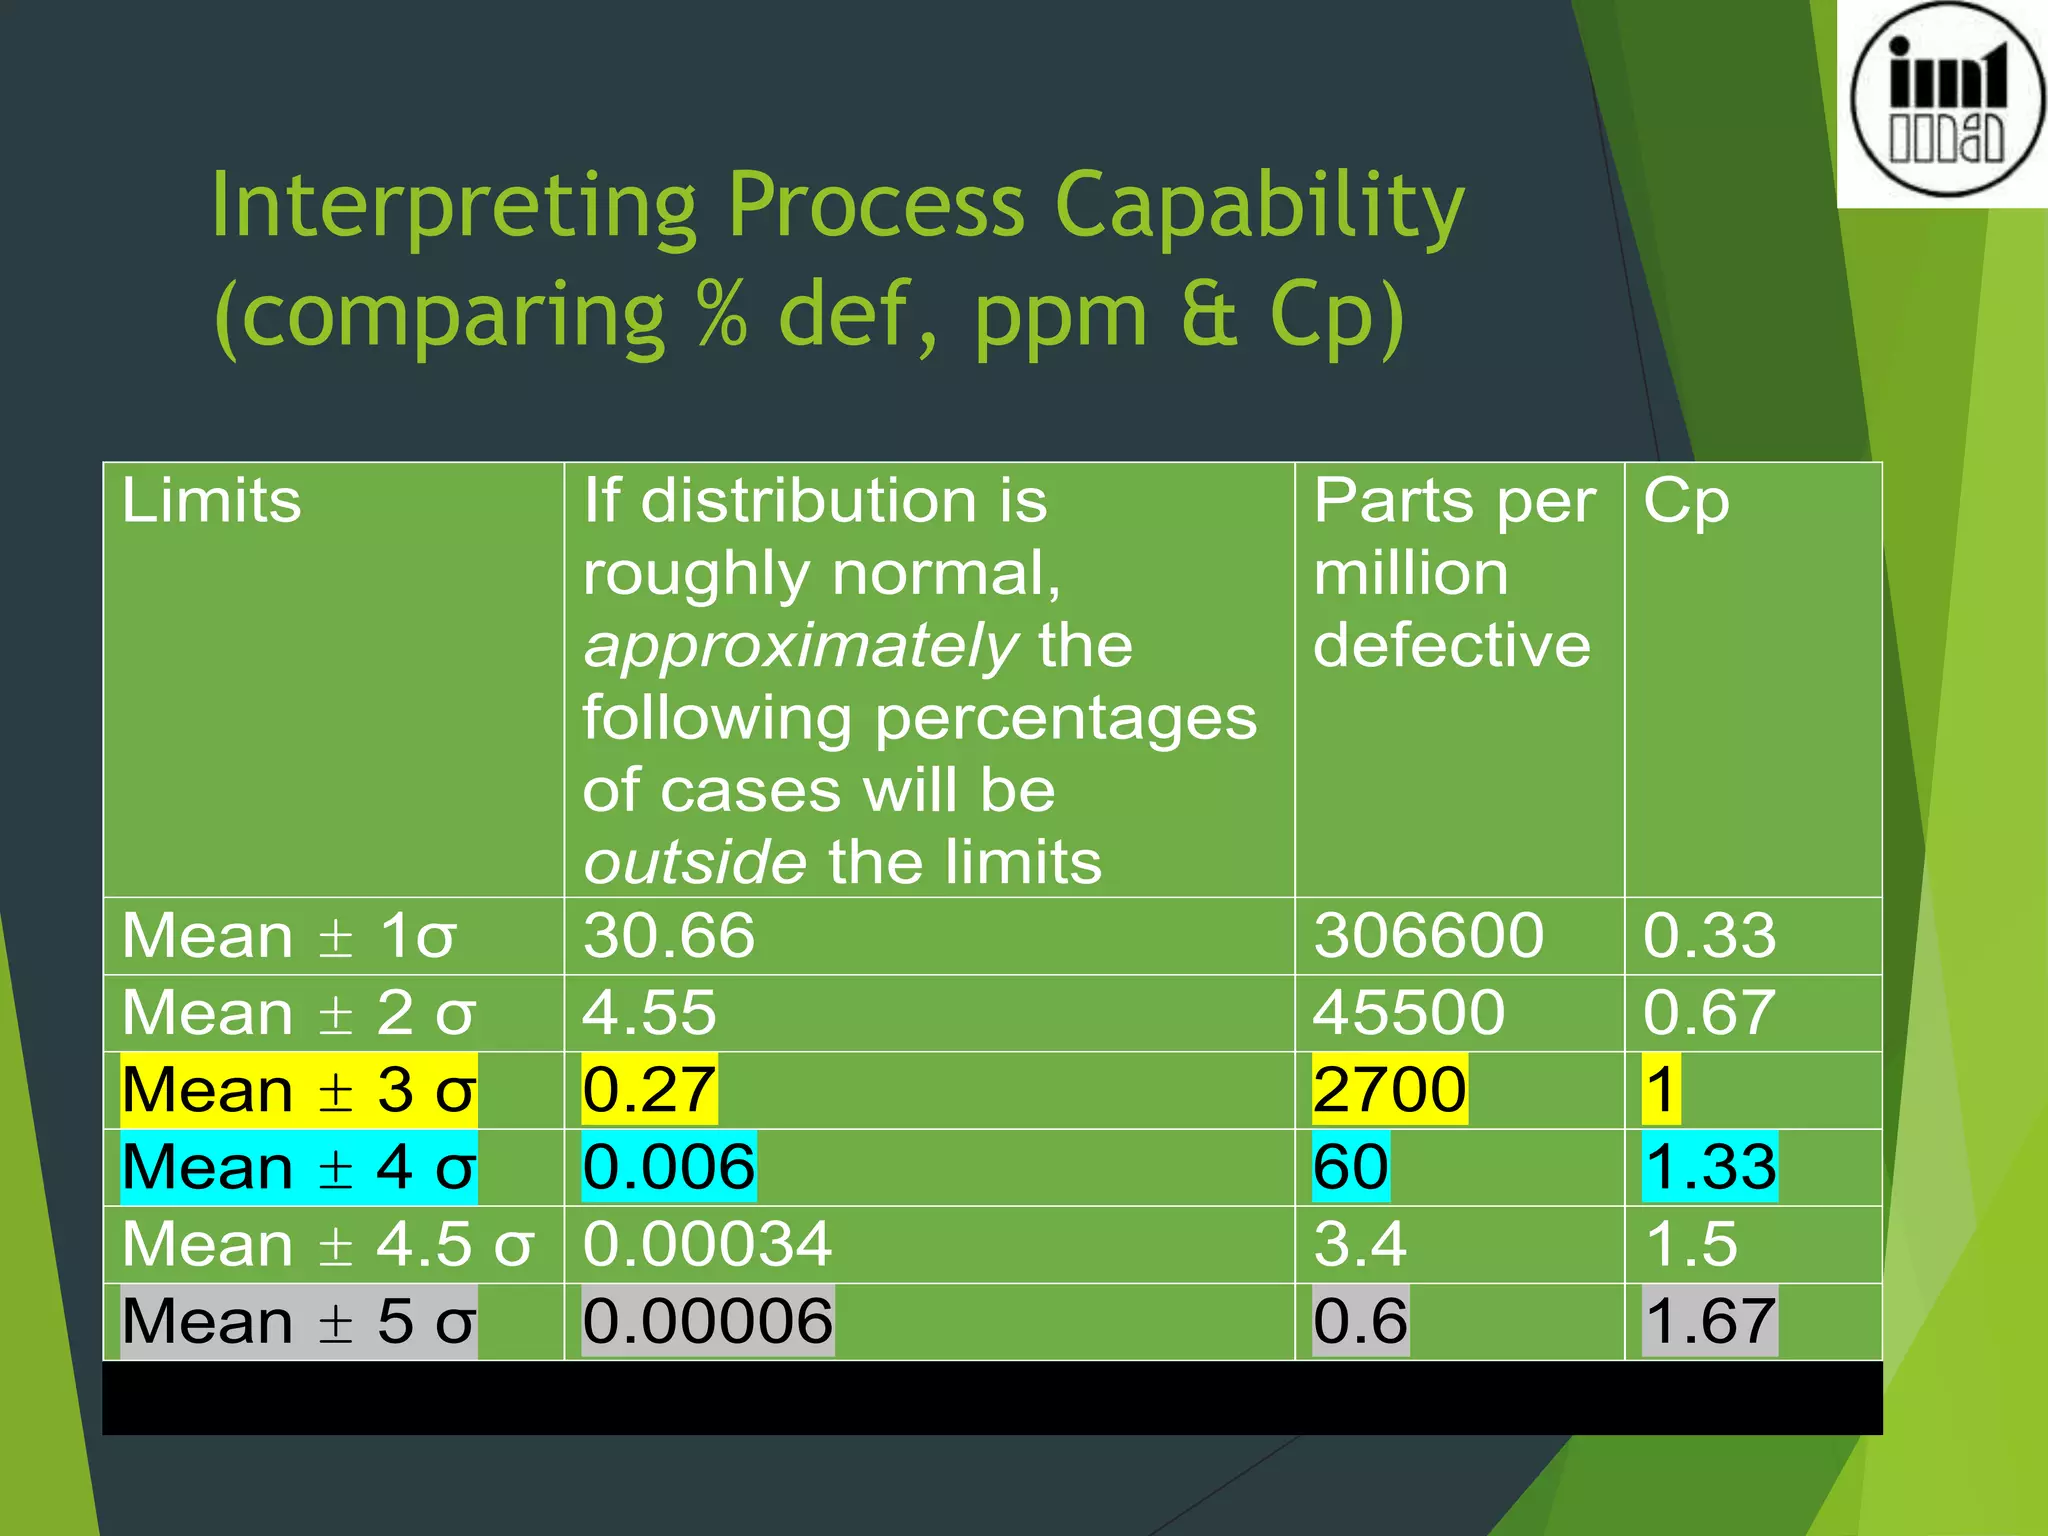
2) Process capability indices like Cp, Cpk measure how well a process performs versus specifications and a value of 1.33 or higher indicates a stable and capable process.
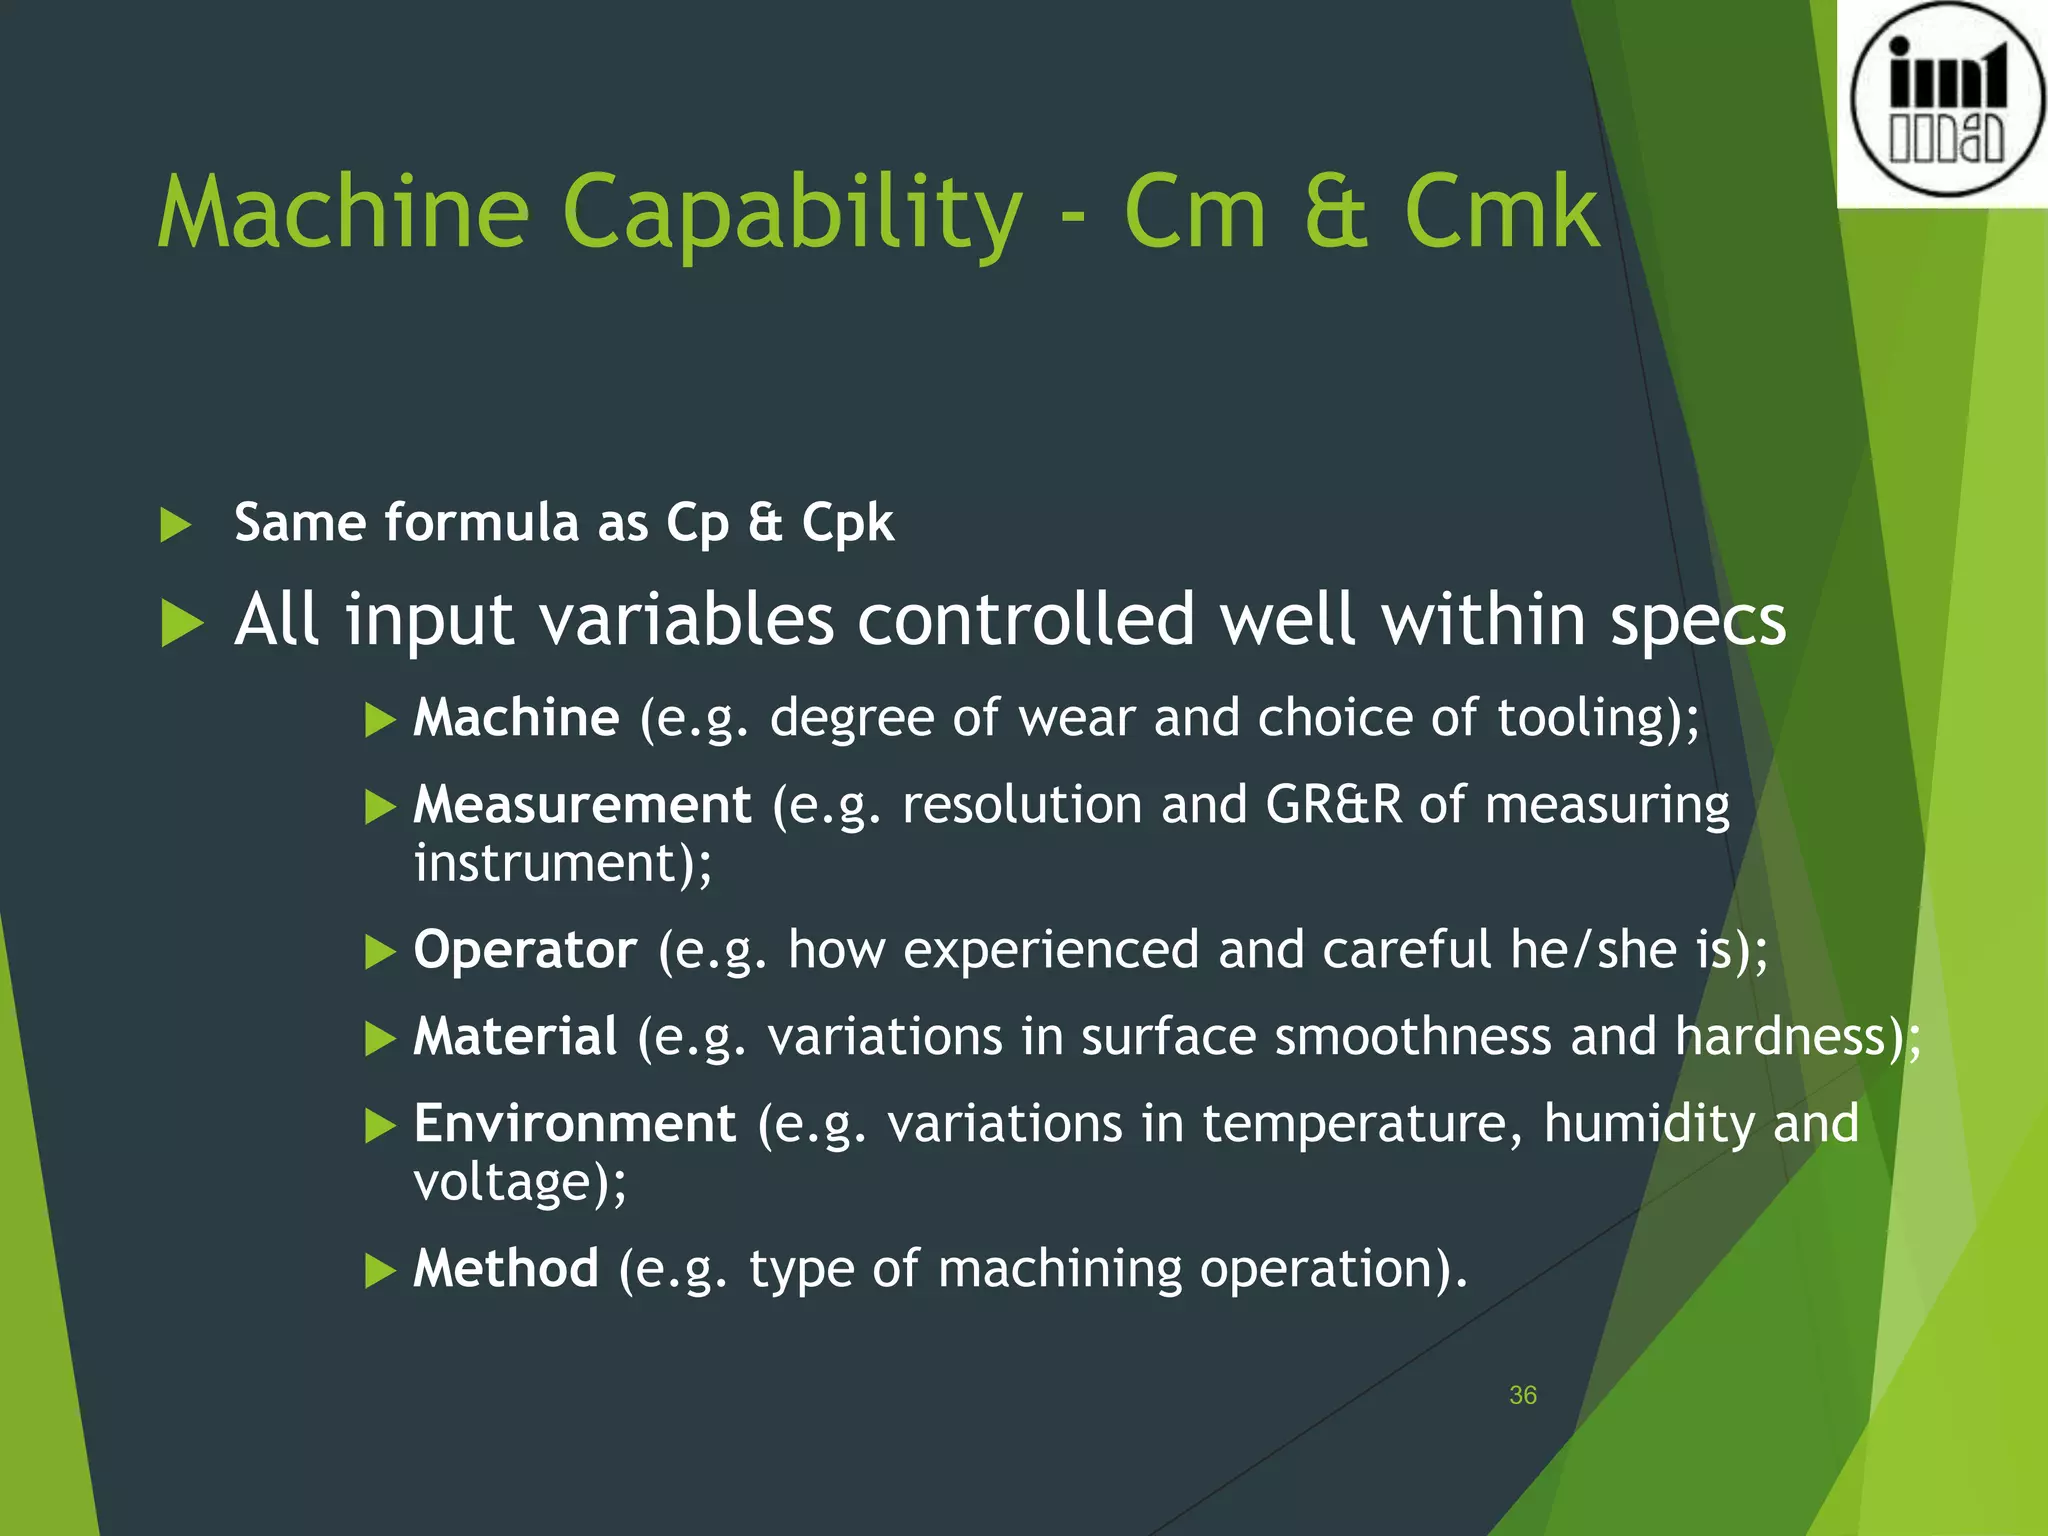
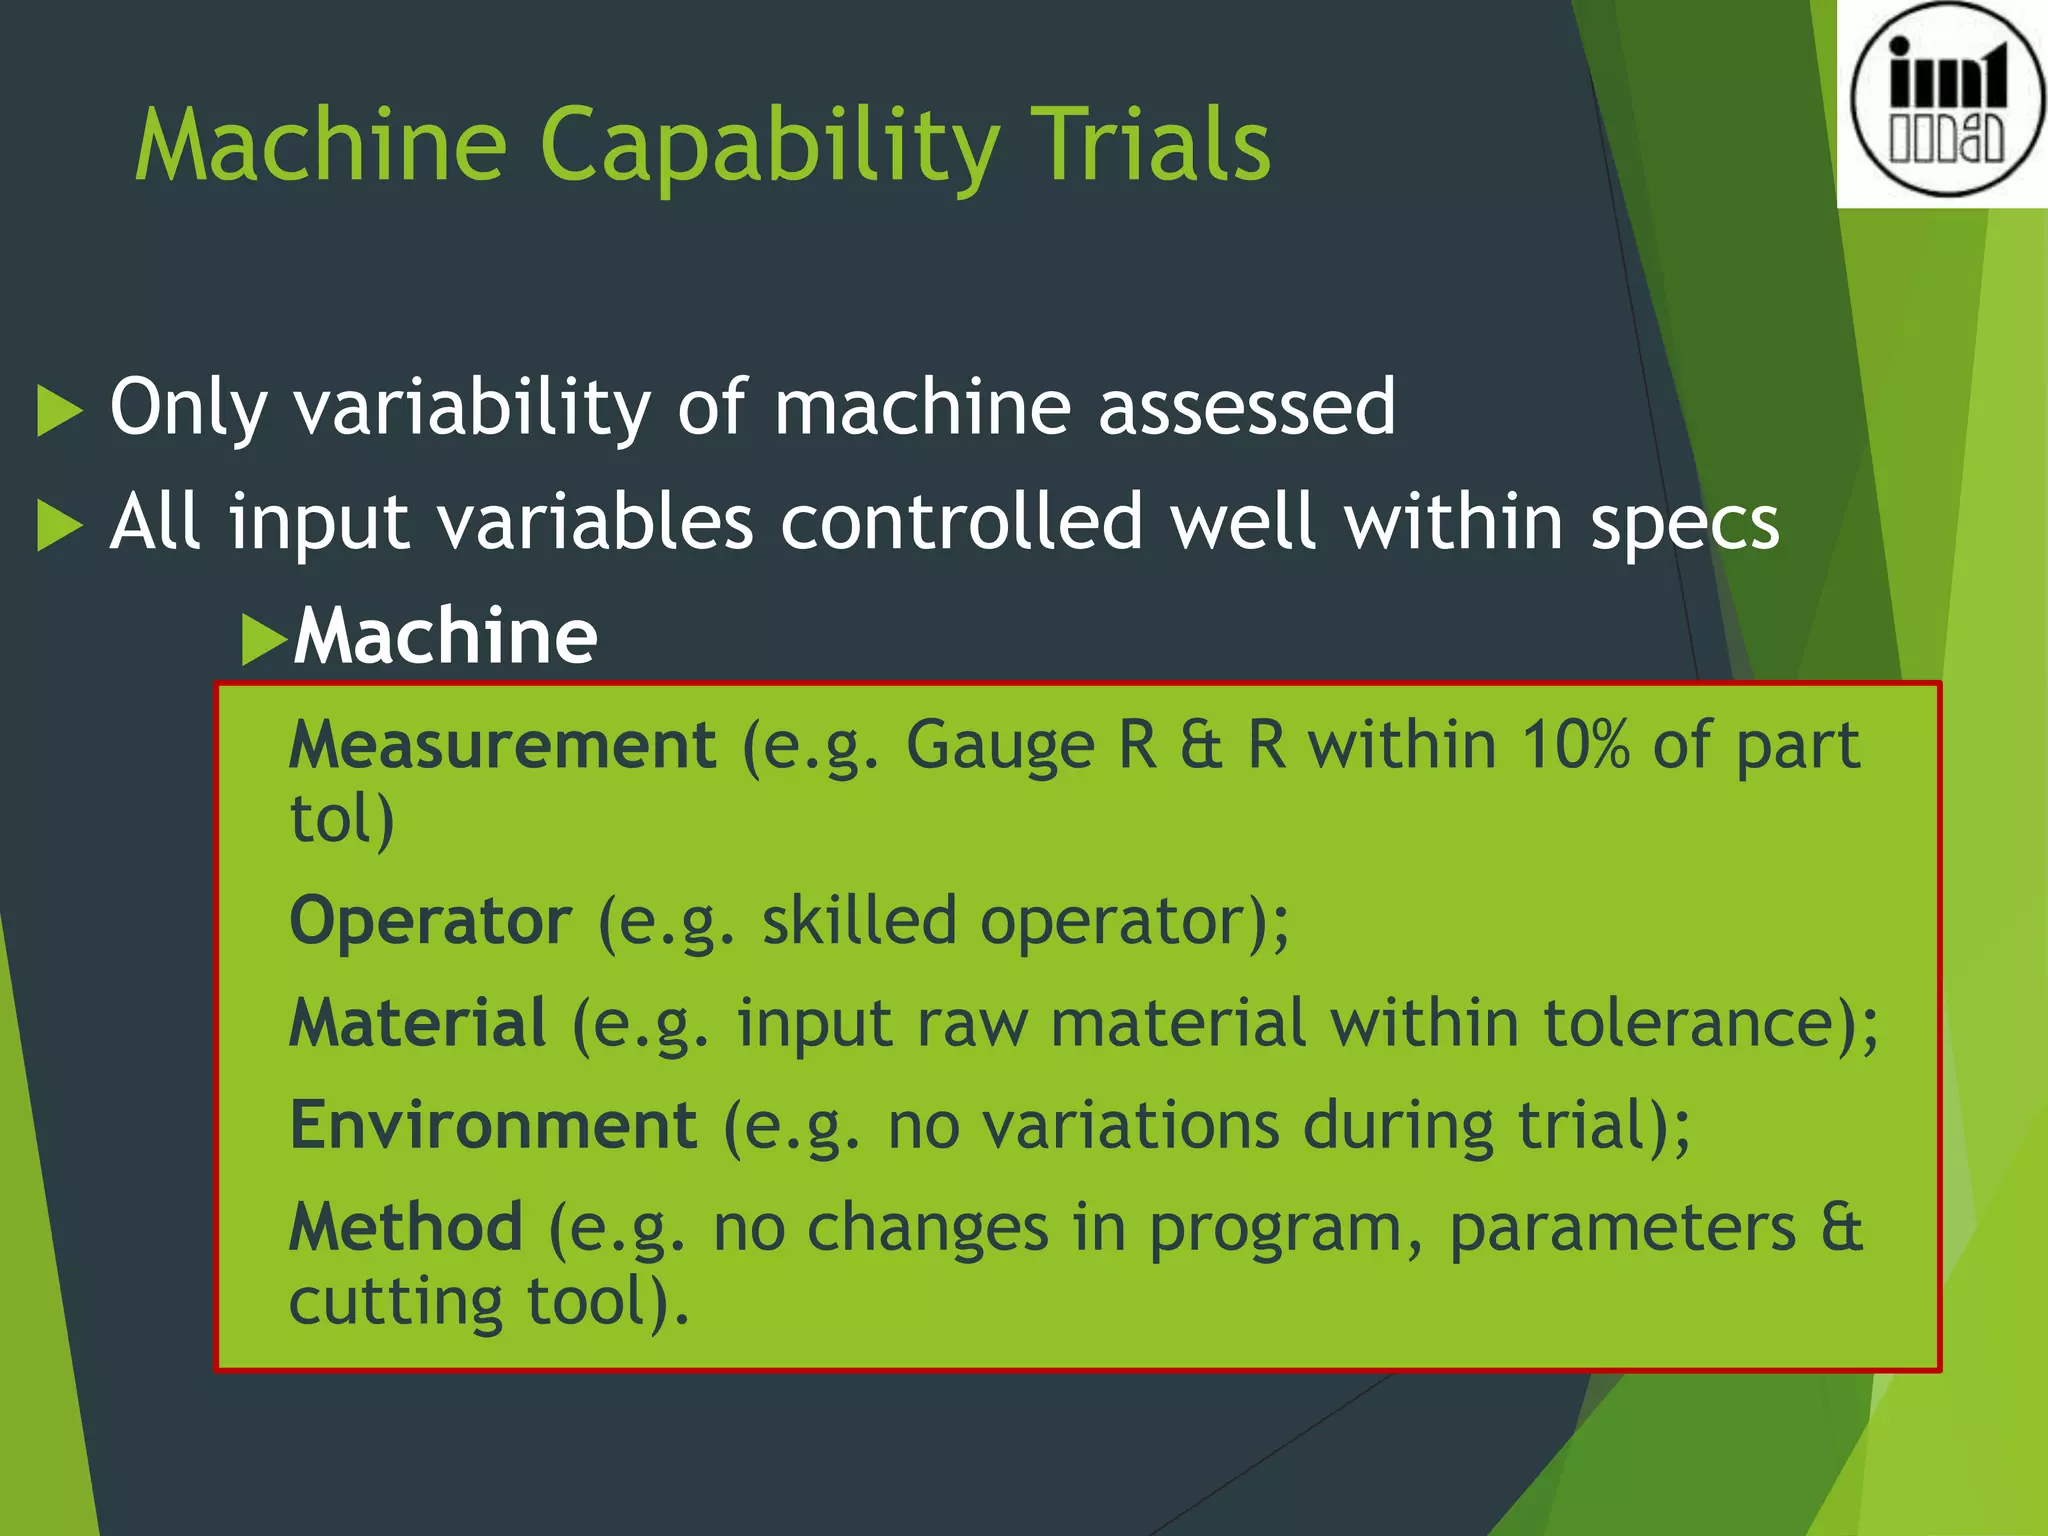
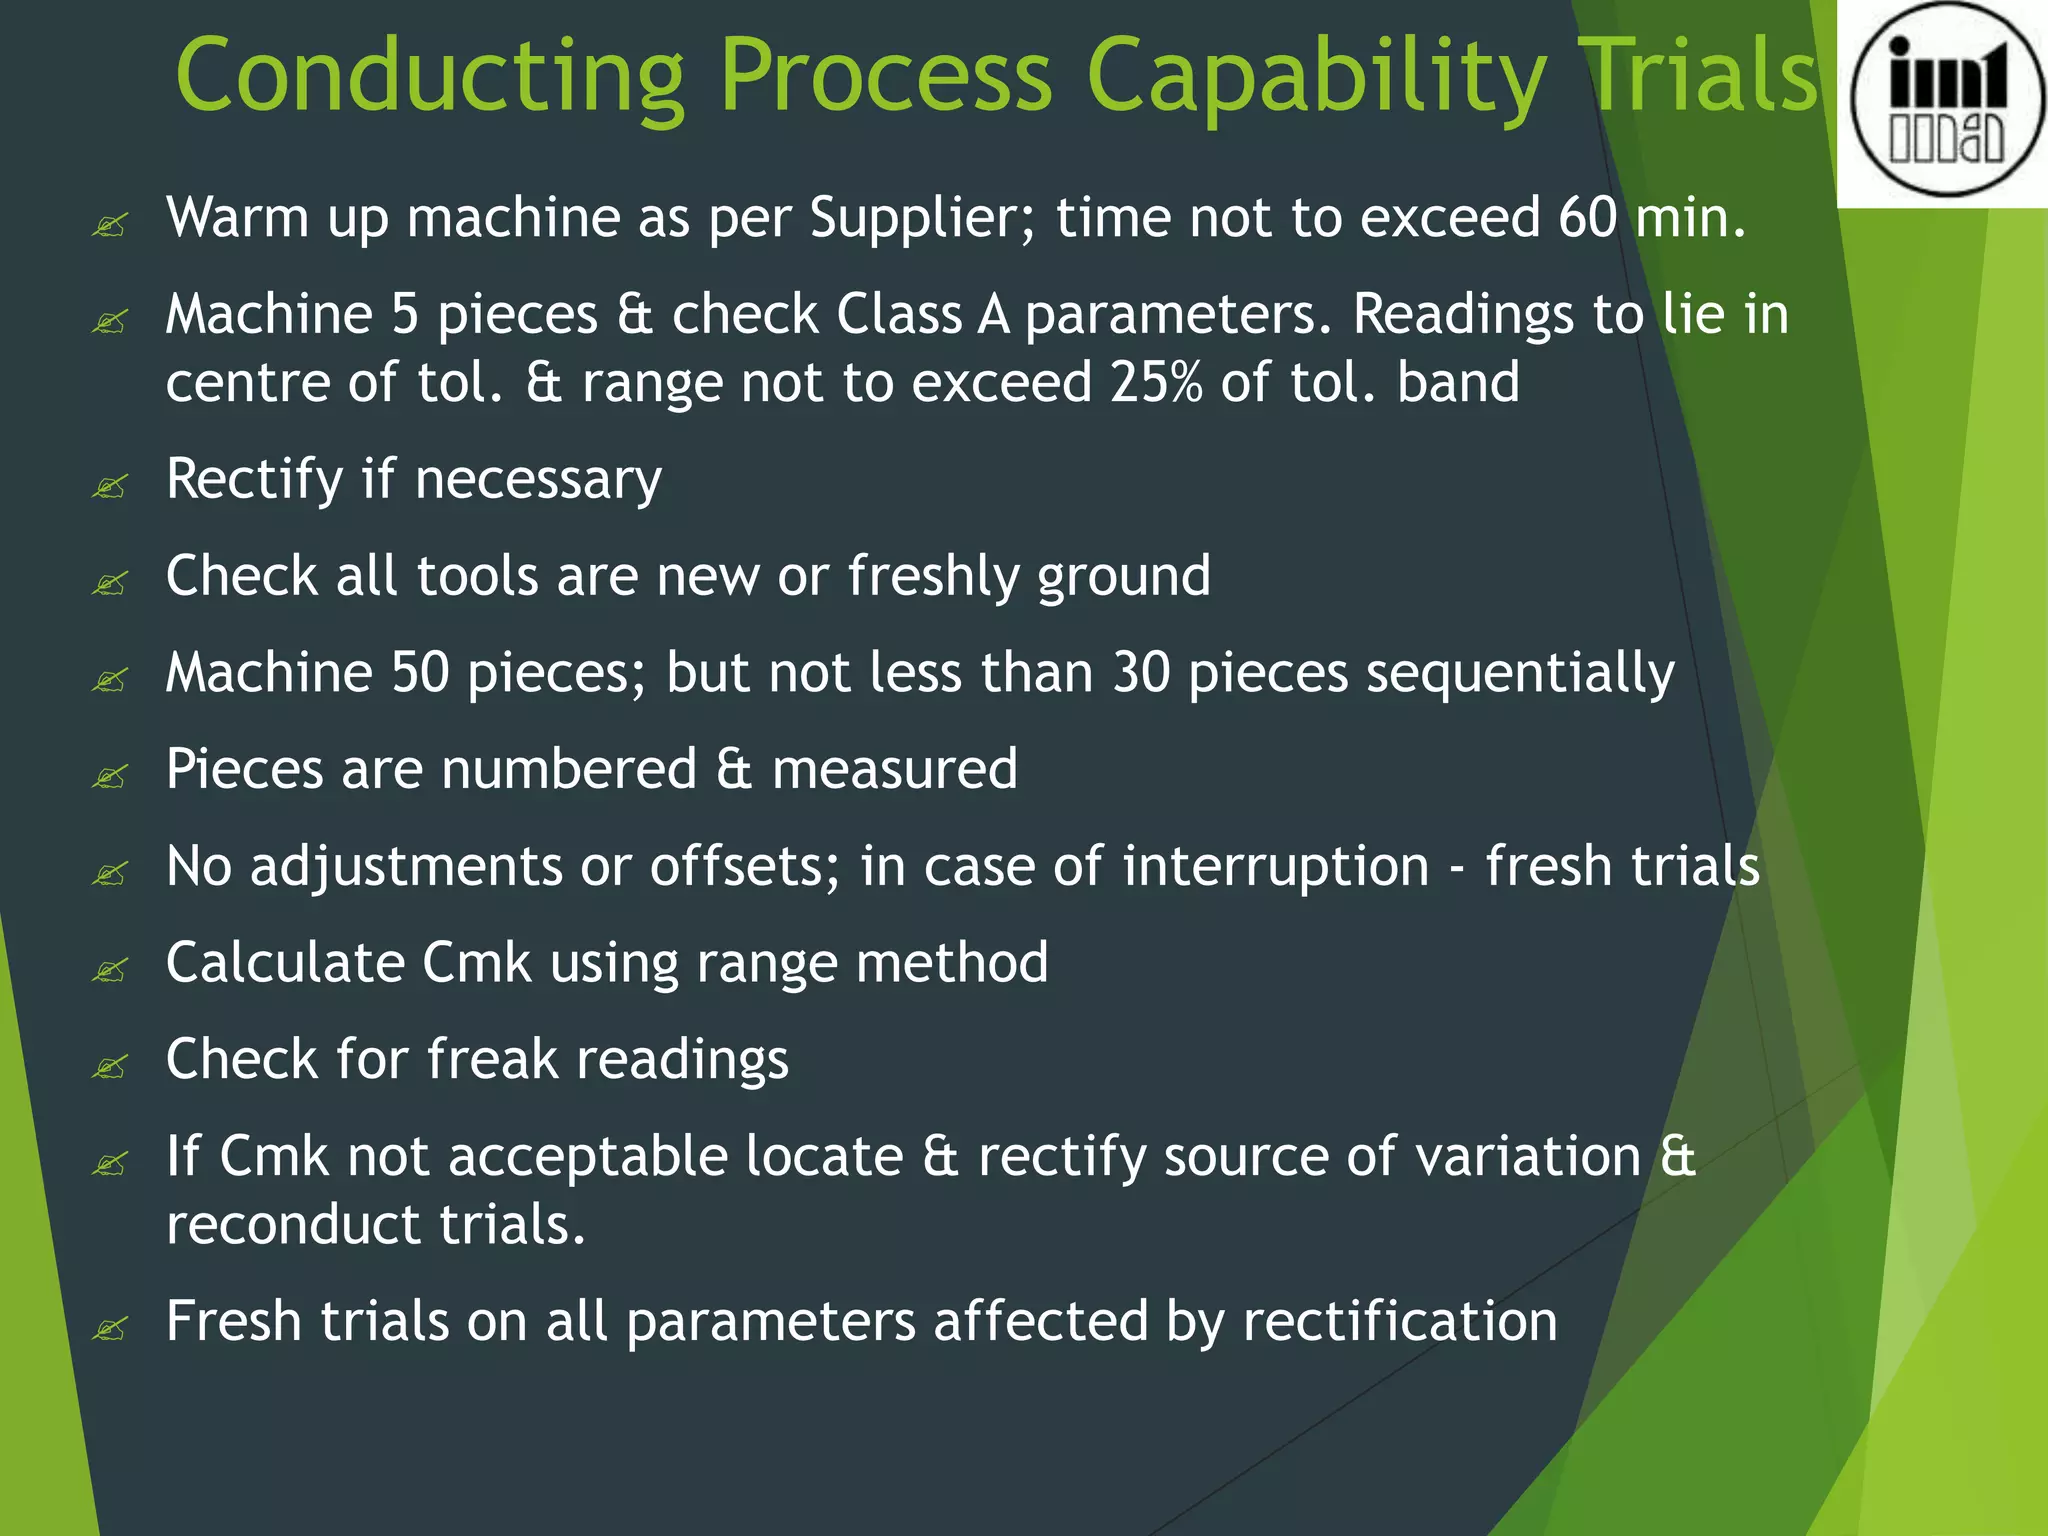
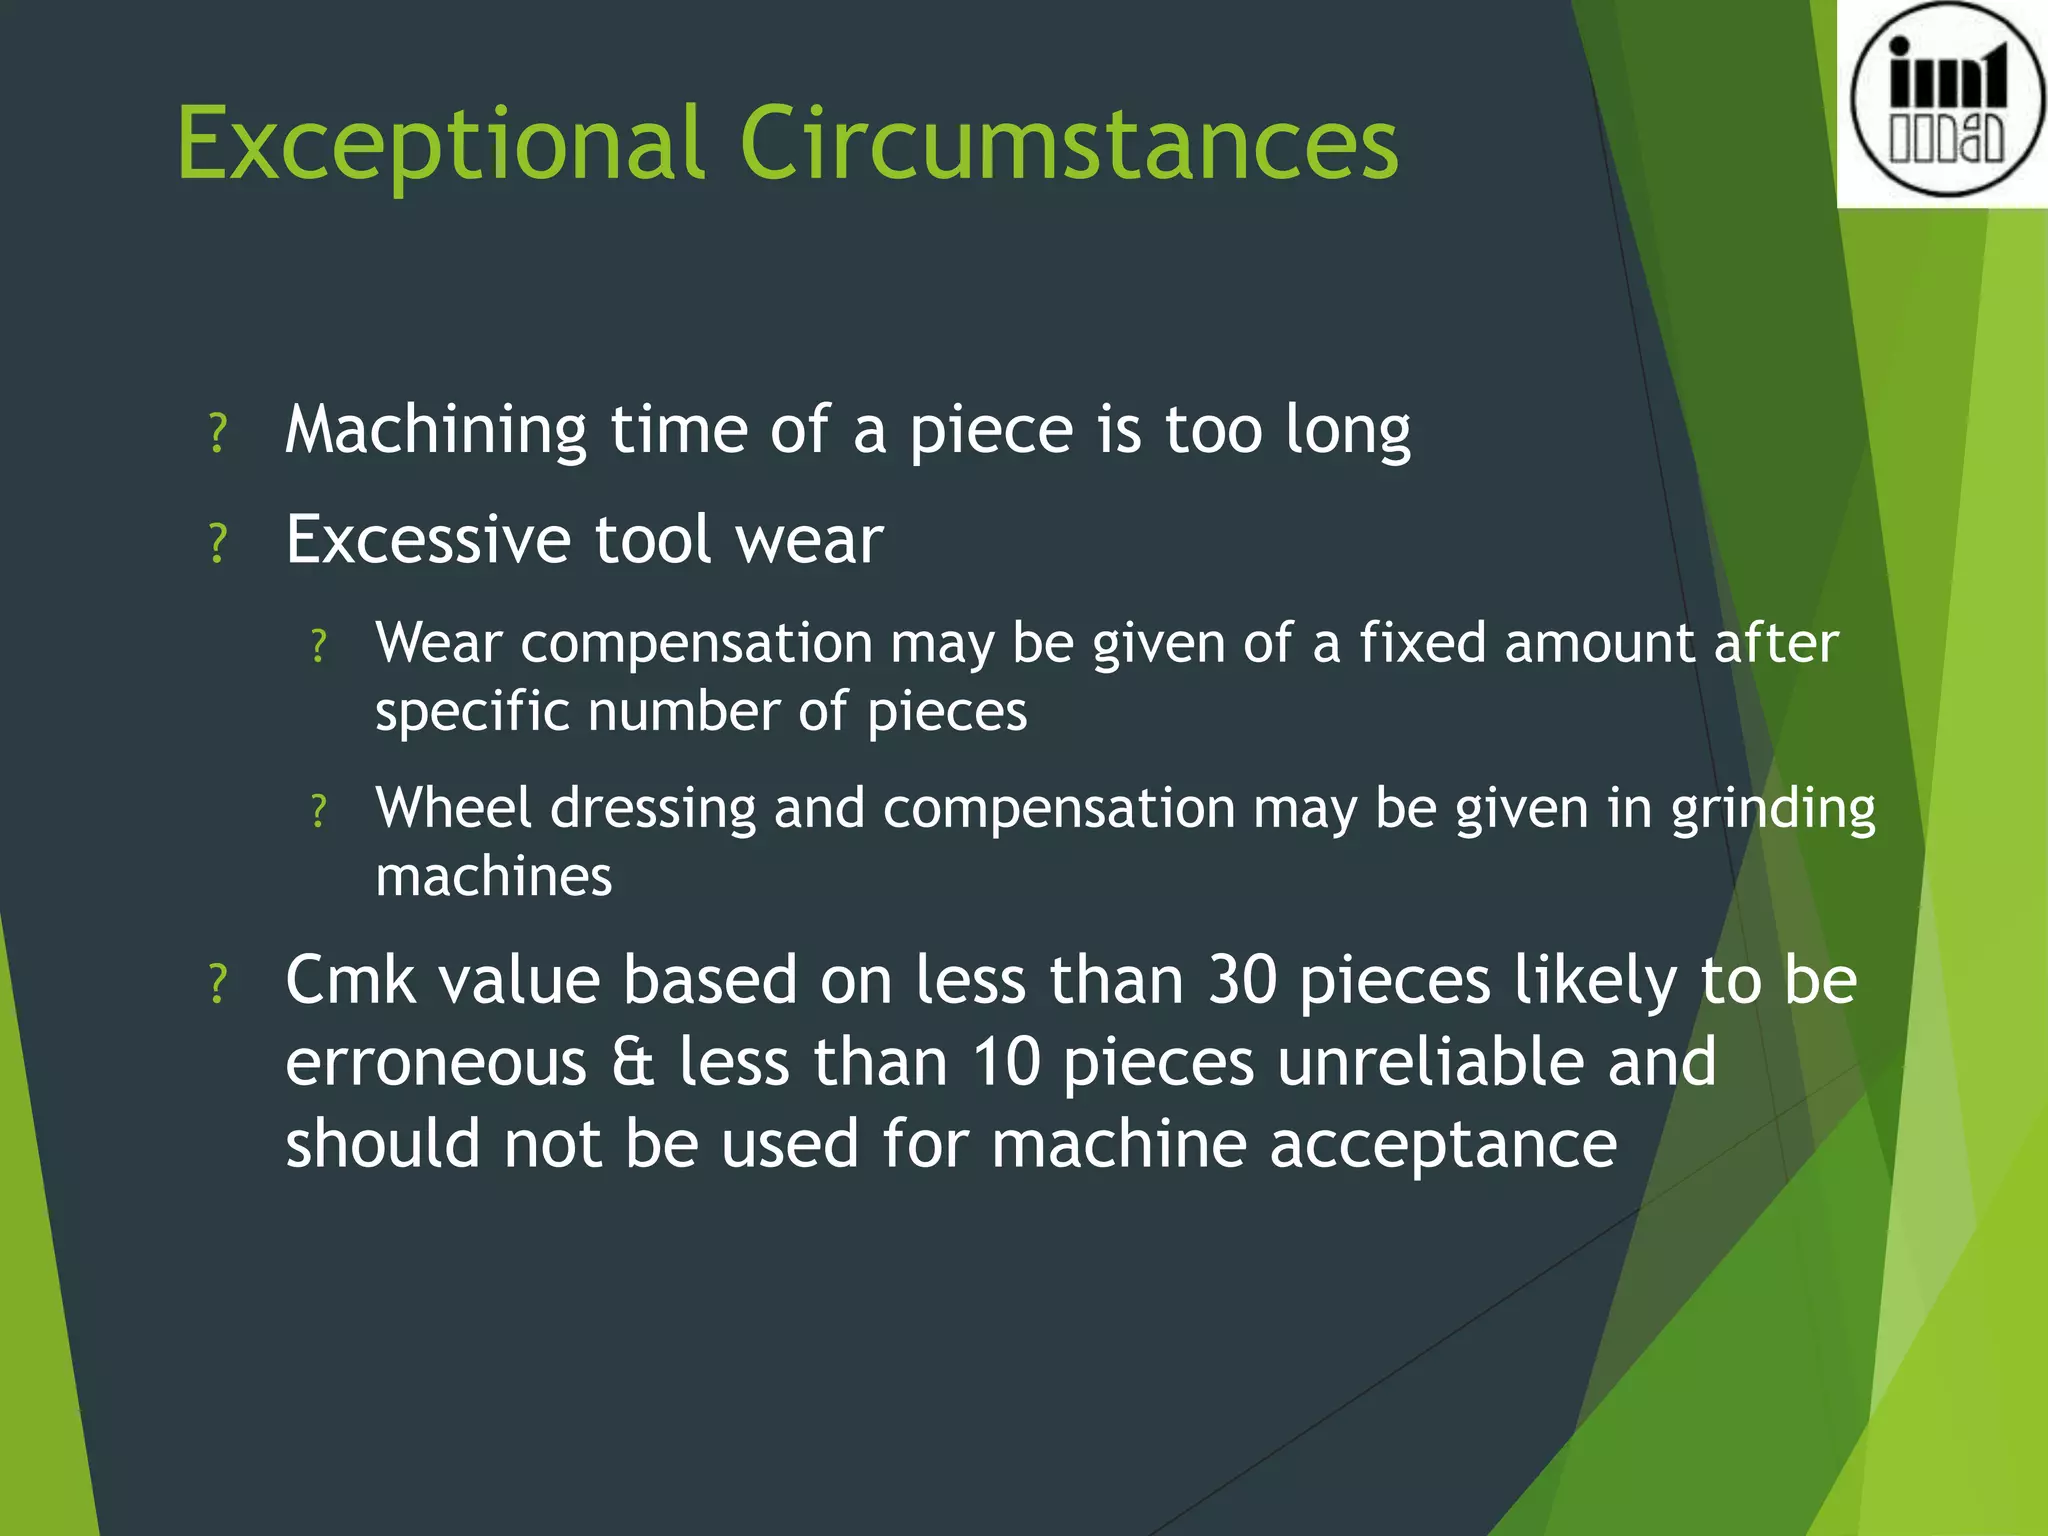
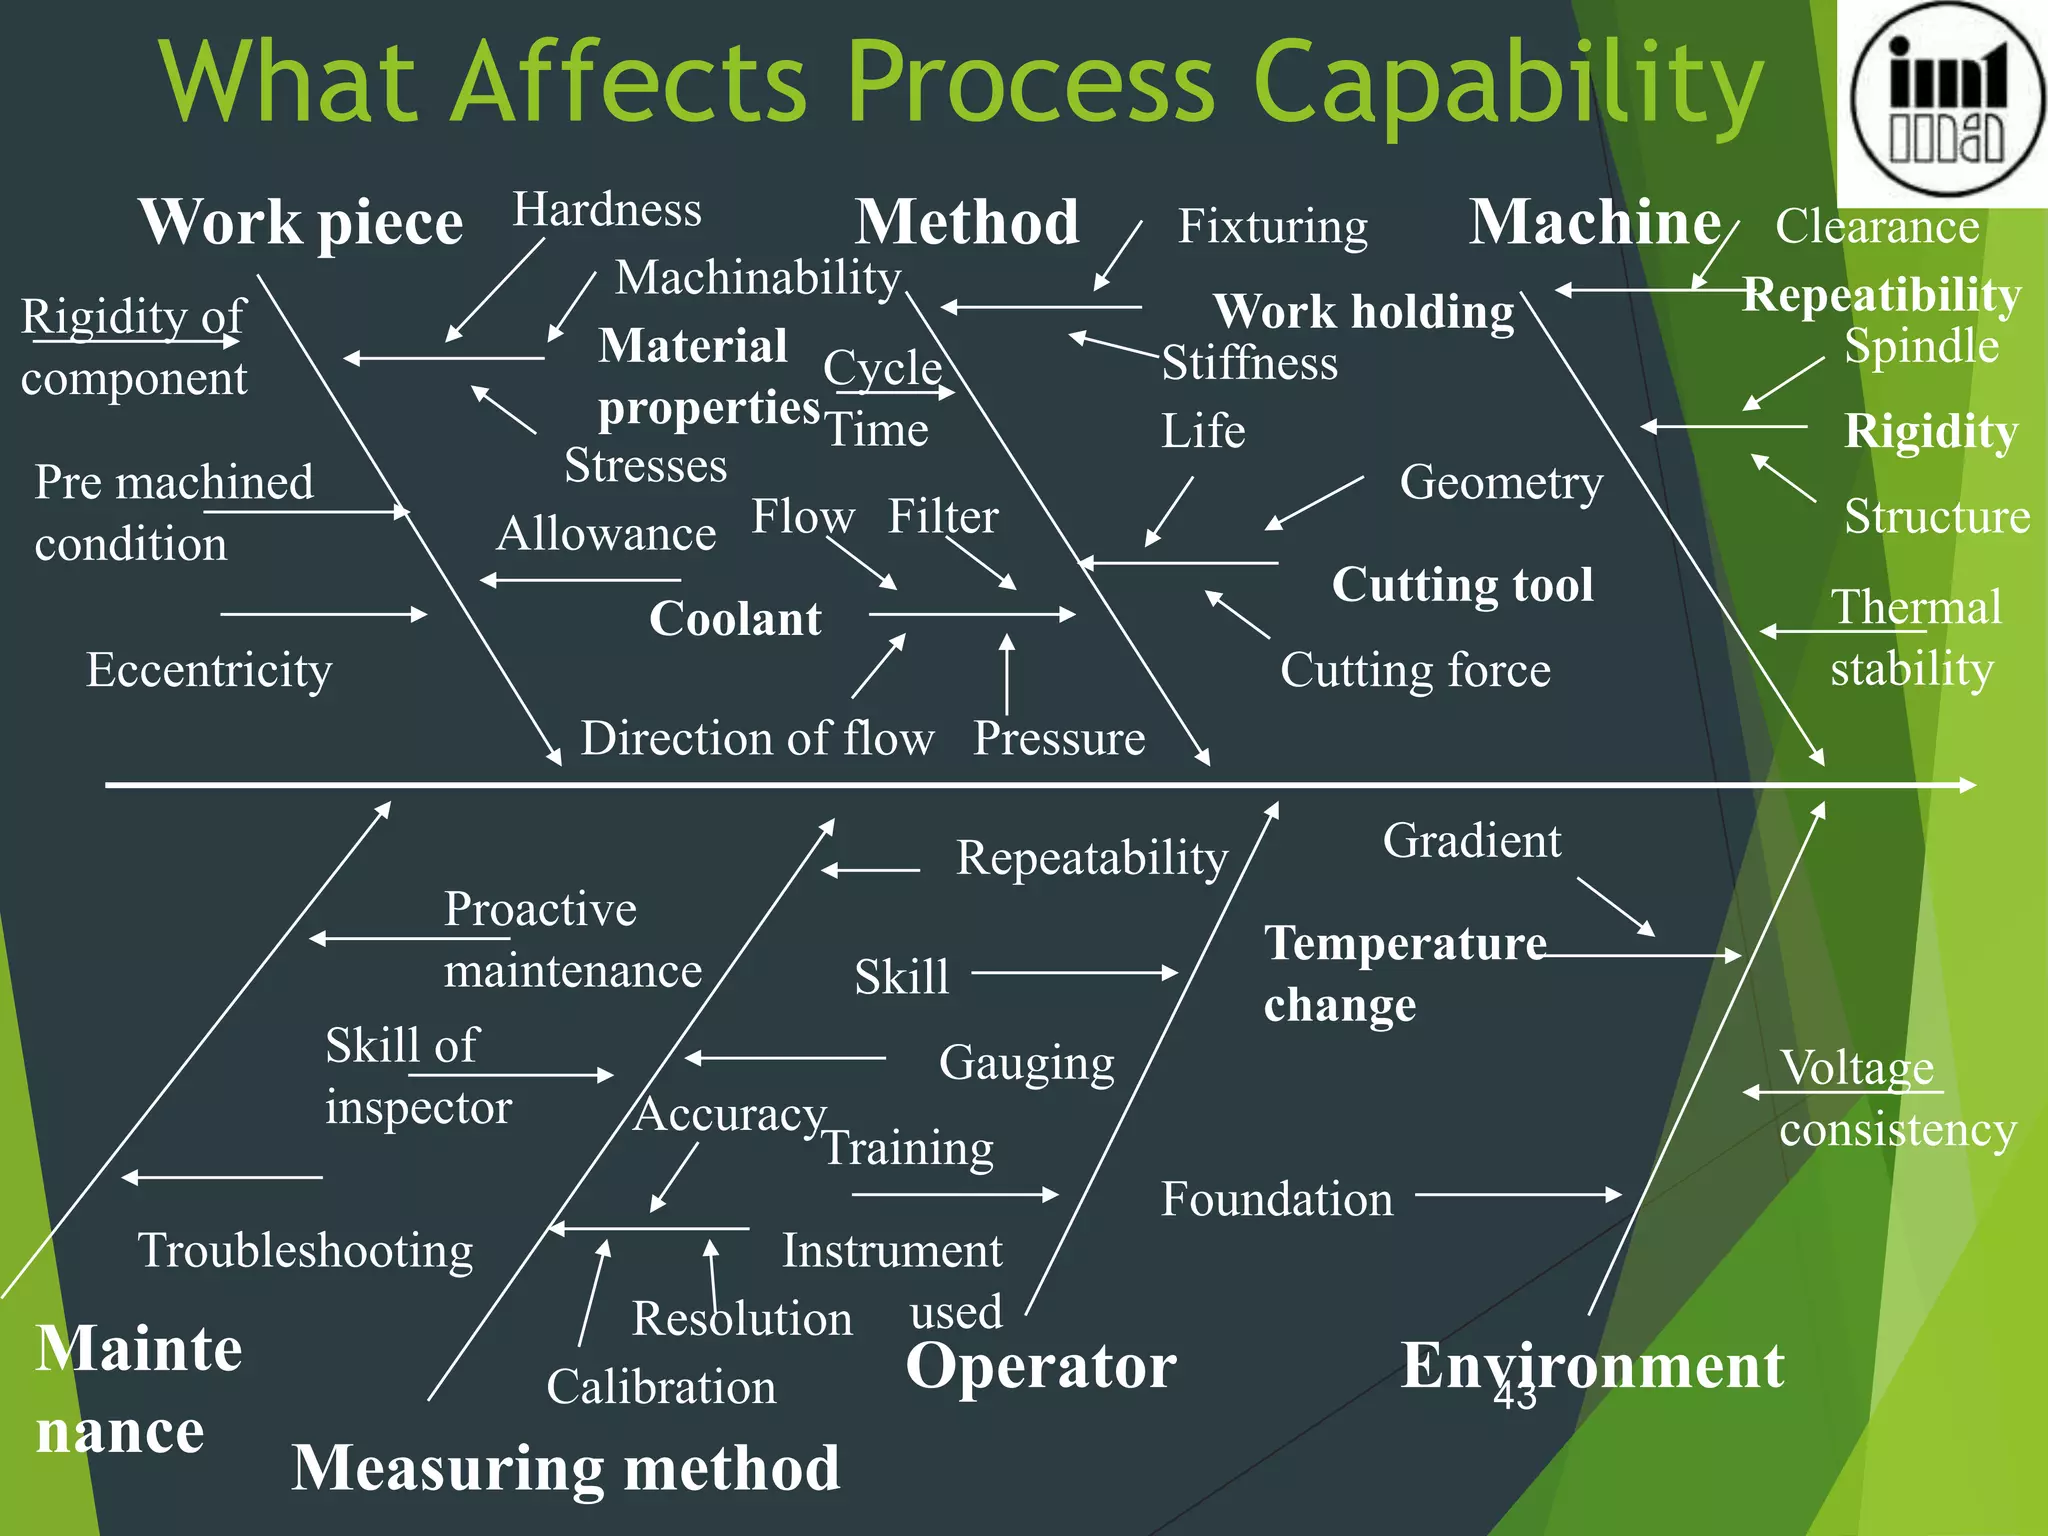
3) Many factors can impact a process's capability including the machine, environment, operator, material and more; conducting process capability studies helps evaluate a process and identify sources of variation.


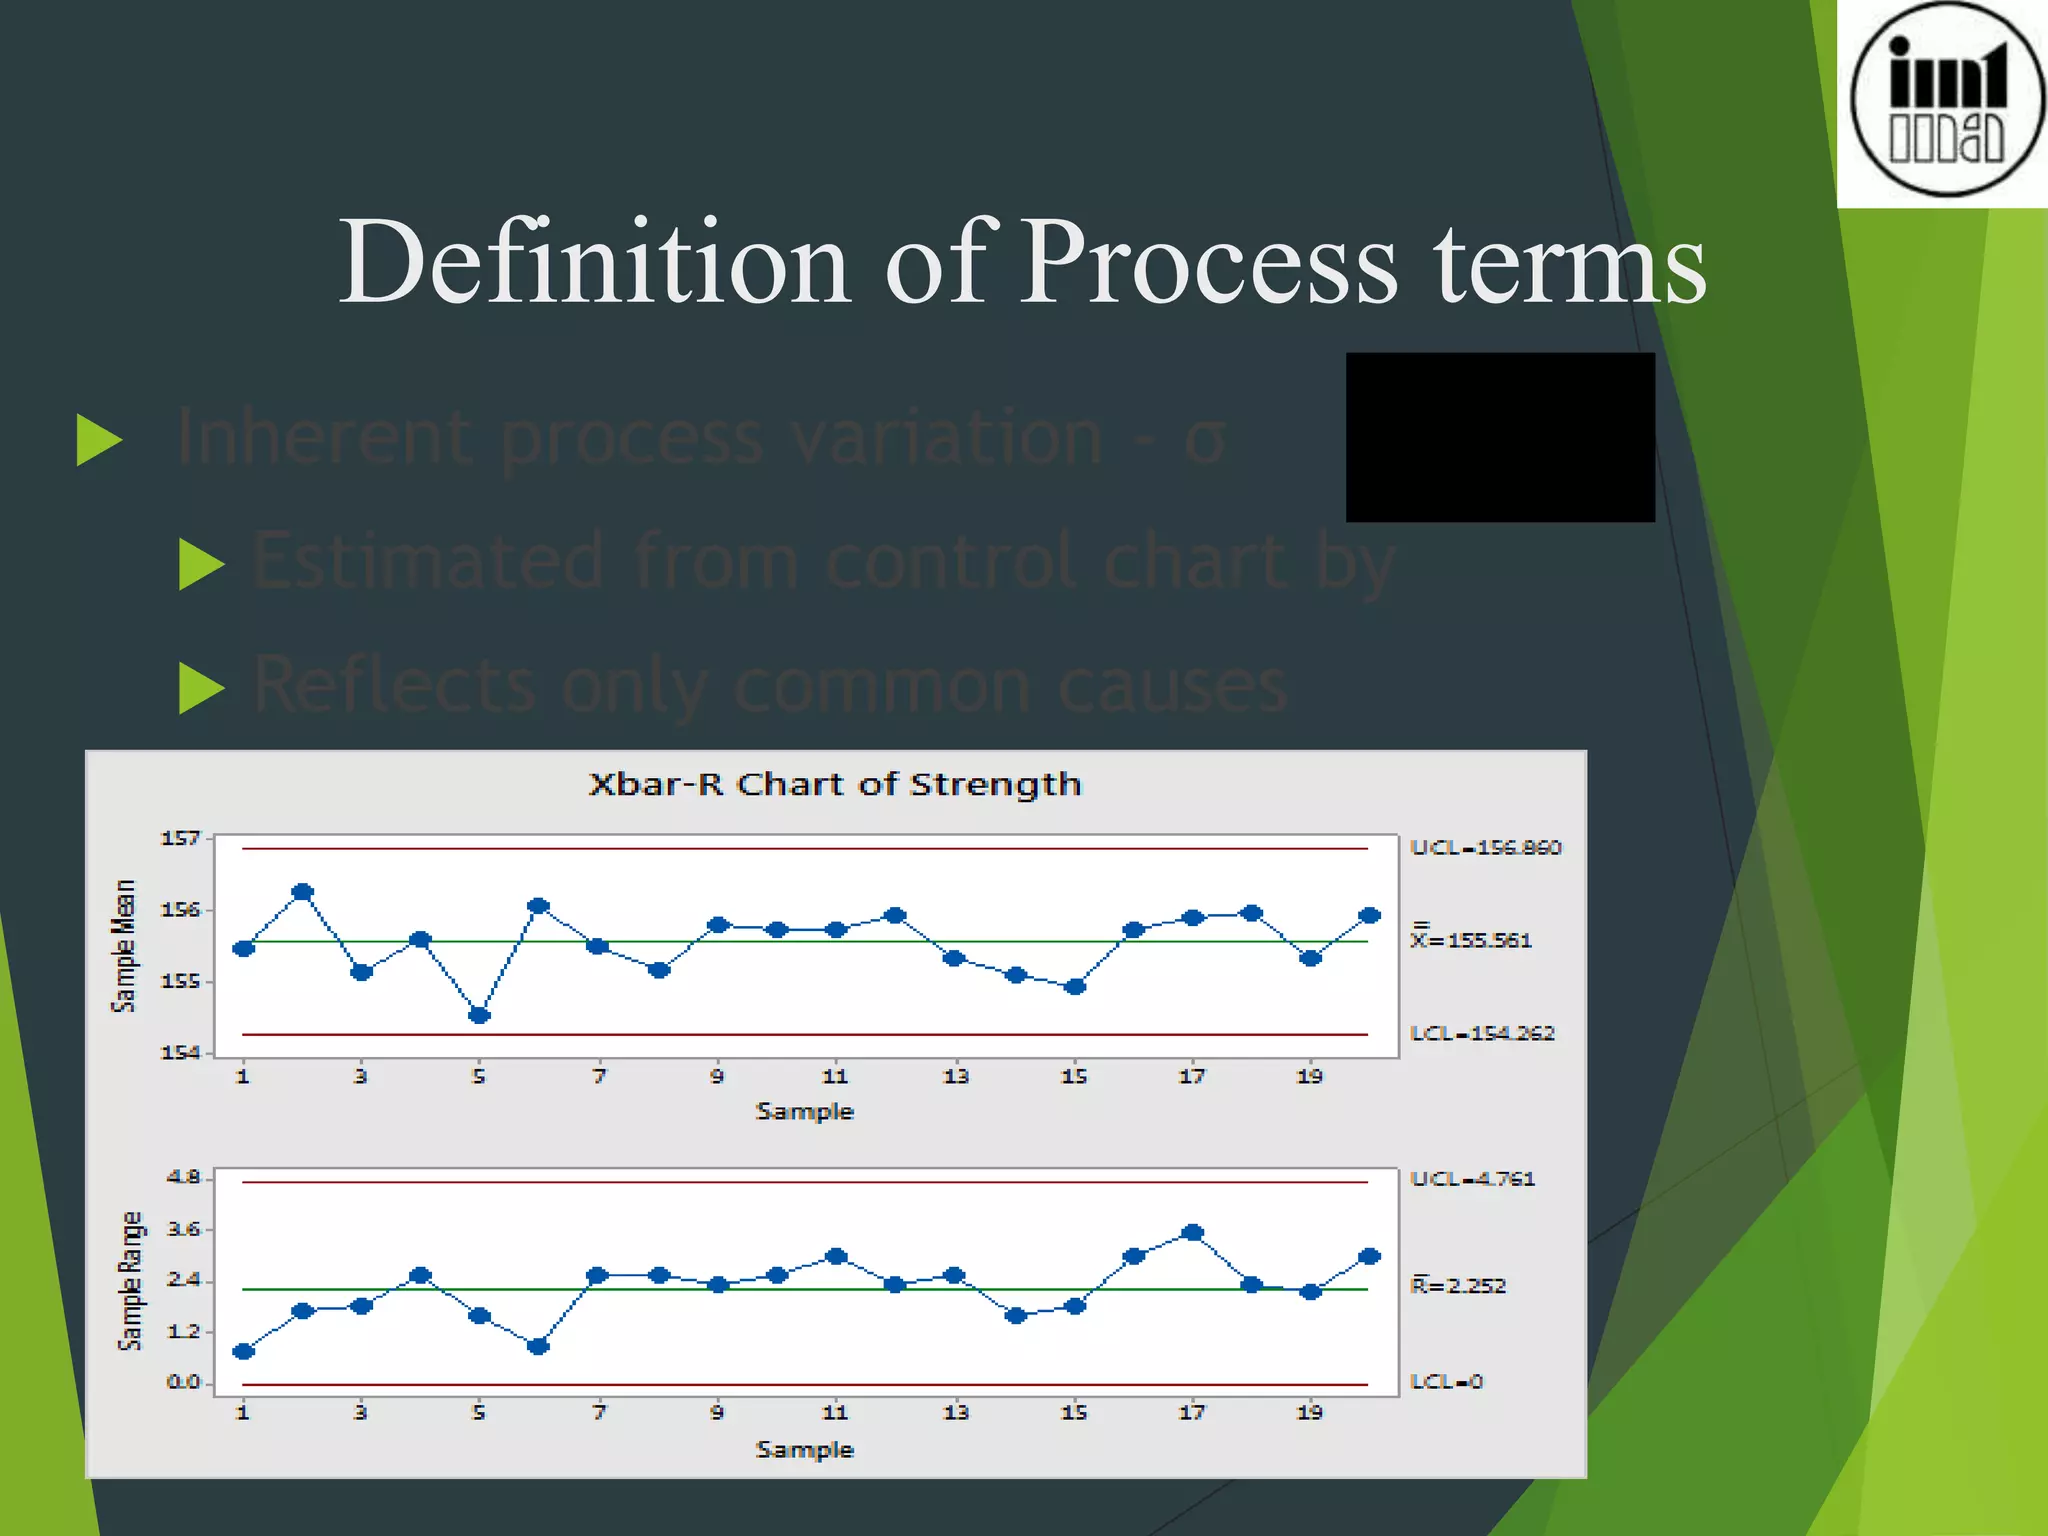
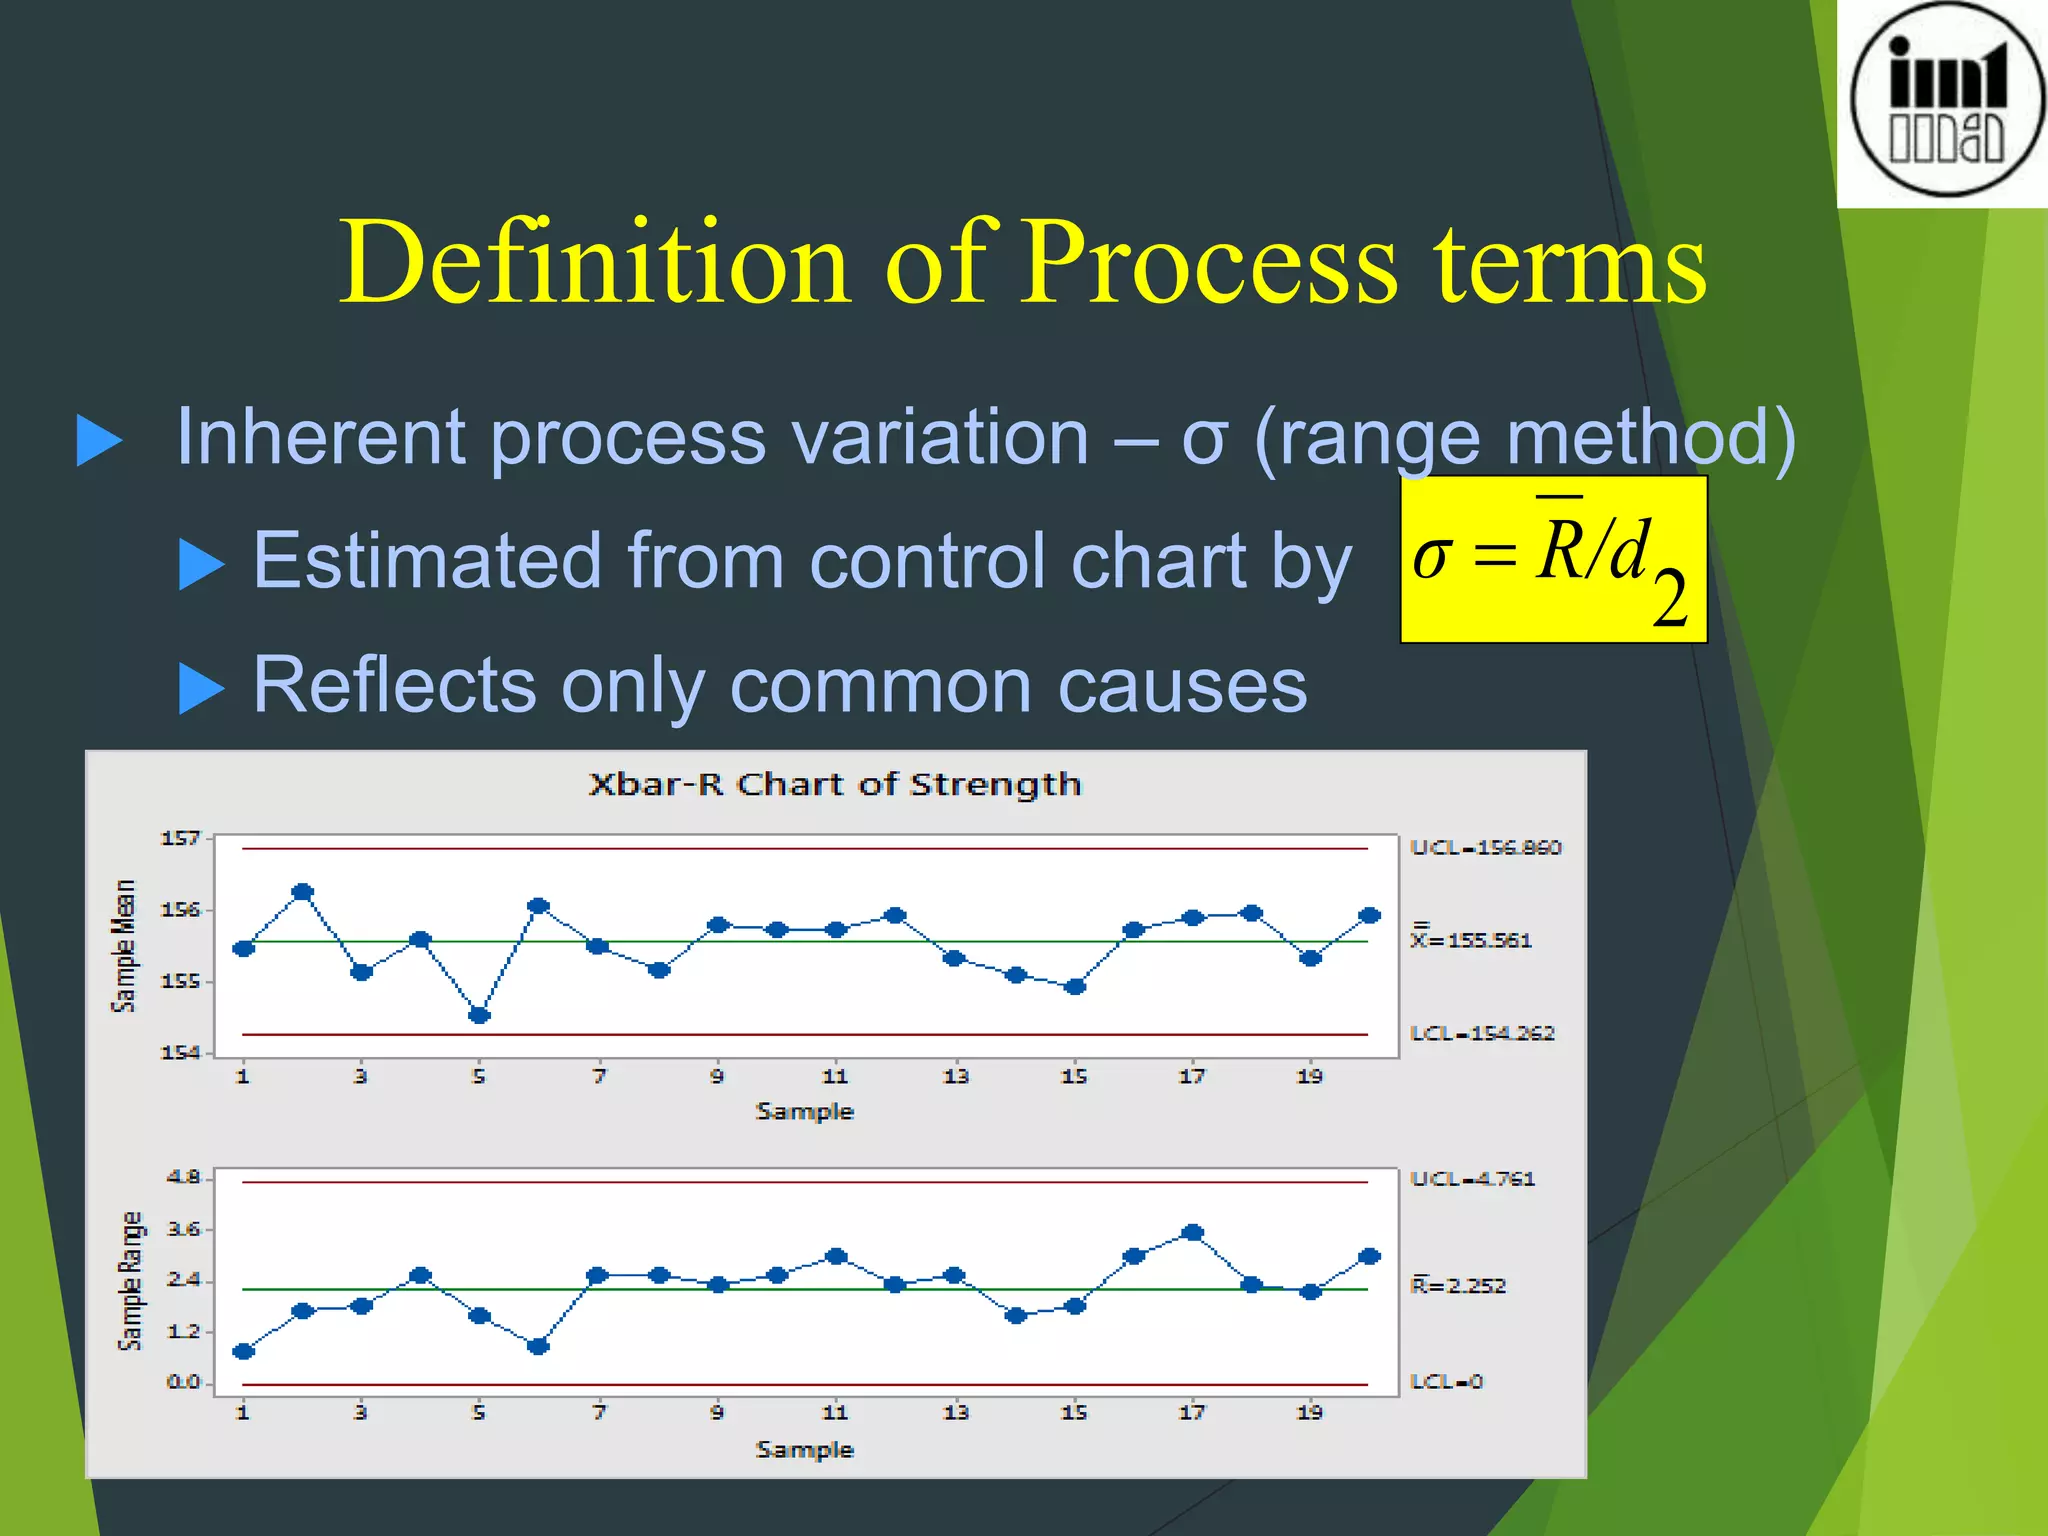

![Implication of Cpk = 1.67
Cp = 1.8
Component
tolerance
[microns]
Six Sigma
Variation
[microns]
Frequ
ency
272
(2σ)
Frequ
ency
380
(4σ)
Frequ
ency
399
(6σ)
Beyo
nd
6σ
Tot
al
40 22 7 14 22 1 400
30 16 5 10 16 1 400
20 11 3 7 11 1 400
10 5 1 3 5 1 400
47](https://image.slidesharecdn.com/day-5processcapabilityforcertificatecourseformarketingengineersonline-230721165100-44da60e7/75/Process-Capability-for-certificate-course-for-marketing-engineers-online-46-2048.jpg)