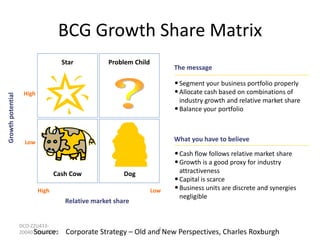
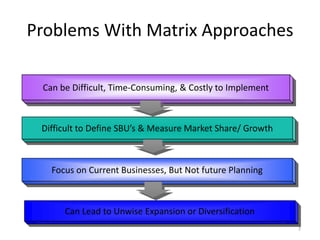
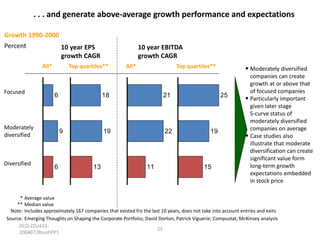
Portfolio management involves analyzing a company's current business portfolio, known as strategic business units (SBUs), to determine which should receive more or less investment and developing strategies to add new products or businesses. Common tools for analyzing SBUs include the Boston Consulting Group growth-share matrix and McKinsey's nine-box matrix, which assess businesses based on factors like market growth and share. However, these tools have limitations and don't support future planning. A company must also consider how to connect with customers through market segmentation, targeting, and positioning. Developing the right portfolio requires balancing factors like risk, return, capabilities, maturity, and organizational structure. [END SUMMARY]
Business Portfolio Analysis is an organisational strategy formulation technique that is based on the philosophy that Organisations should develop strategy..... much as they handle investment portfolios..
Enterprise and insititution strategy management tool new description and selection algorthm.
In this presenation a new method of entperprise and institution strategy management tools is developed. First new precise definitions are given for most popular strategy management methods, afterwards a new algorithm is designed for the correct choice of strategy menagement tools. The methods of SWOT analysis, Balanced Scorecard, Blue ocean strategy, Bowman's strategy clock, Six sigma, Boston Consulting Group matrix are considered.
Strategy Implementation, Strategic Analysis, Strategic analysis process, Strategic Choice, Steps in strategic choice, Factors affecting Strategic Choice, objective factors, subjective factors, Tools and Techniques of Strategic Analysis, The Boston Consulting Group (BCG) Matrix, GE Planning Grid, GE 9 Cell, Strategic Decisions, Invest, Protect, Harvest, Market Attractiveness , Competitive Strength, Industry Structure Analysis – The Life-Cycle MODEL, Porters 5 Force Model, Competitive advantage, PESTLE and Porter’s Five Forces Analysis, The McKinsey 7 – S Framework, VRIO Analysis, VRIO of H&M, Value Chain, Benchmarking, Mergers and acquisitions (M&A)
This report features world capital market performance and a timeline of events for the past quarter. It begins with a global overview, then features the returns of
stock and bond asset classes in the US and
international markets.
The report also illustrates the performance of globally diversified portfolios and features a quarterly topic.
Corporate Strategy or Strategic Management
Concepts and Cases by Fred R. David,
Francis Marion University, Florence, South Carolina, &
Forest R. David,
Strategic Planning Consultant
B2B payments are rapidly changing. Find out the 5 key questions you need to be asking yourself to be sure you are mastering B2B payments today. Learn more at www.BlueSnap.com.
VAT Registration Outlined In UAE: Benefits and Requirementsuae taxgpt
Vat Registration is a legal obligation for businesses meeting the threshold requirement, helping companies avoid fines and ramifications. Contact now!
https://viralsocialtrends.com/vat-registration-outlined-in-uae/
In the Adani-Hindenburg case, what is SEBI investigating.pptxAdani case
Adani SEBI investigation revealed that the latter had sought information from five foreign jurisdictions concerning the holdings of the firm’s foreign portfolio investors (FPIs) in relation to the alleged violations of the MPS Regulations. Nevertheless, the economic interest of the twelve FPIs based in tax haven jurisdictions still needs to be determined. The Adani Group firms classed these FPIs as public shareholders. According to Hindenburg, FPIs were used to get around regulatory standards.
Building Your Employer Brand with Social MediaLuanWise
Presented at The Global HR Summit, 6th June 2024
In this keynote, Luan Wise will provide invaluable insights to elevate your employer brand on social media platforms including LinkedIn, Facebook, Instagram, X (formerly Twitter) and TikTok. You'll learn how compelling content can authentically showcase your company culture, values, and employee experiences to support your talent acquisition and retention objectives. Additionally, you'll understand the power of employee advocacy to amplify reach and engagement – helping to position your organization as an employer of choice in today's competitive talent landscape.
Digital Transformation and IT Strategy Toolkit and TemplatesAurelien Domont, MBA
This Digital Transformation and IT Strategy Toolkit was created by ex-McKinsey, Deloitte and BCG Management Consultants, after more than 5,000 hours of work. It is considered the world's best & most comprehensive Digital Transformation and IT Strategy Toolkit. It includes all the Frameworks, Best Practices & Templates required to successfully undertake the Digital Transformation of your organization and define a robust IT Strategy.
Editable Toolkit to help you reuse our content: 700 Powerpoint slides | 35 Excel sheets | 84 minutes of Video training
This PowerPoint presentation is only a small preview of our Toolkits. For more details, visit www.domontconsulting.com
[Note: This is a partial preview. To download this presentation, visit:
https://www.oeconsulting.com.sg/training-presentations]
Sustainability has become an increasingly critical topic as the world recognizes the need to protect our planet and its resources for future generations. Sustainability means meeting our current needs without compromising the ability of future generations to meet theirs. It involves long-term planning and consideration of the consequences of our actions. The goal is to create strategies that ensure the long-term viability of People, Planet, and Profit.
Leading companies such as Nike, Toyota, and Siemens are prioritizing sustainable innovation in their business models, setting an example for others to follow. In this Sustainability training presentation, you will learn key concepts, principles, and practices of sustainability applicable across industries. This training aims to create awareness and educate employees, senior executives, consultants, and other key stakeholders, including investors, policymakers, and supply chain partners, on the importance and implementation of sustainability.
LEARNING OBJECTIVES
1. Develop a comprehensive understanding of the fundamental principles and concepts that form the foundation of sustainability within corporate environments.
2. Explore the sustainability implementation model, focusing on effective measures and reporting strategies to track and communicate sustainability efforts.
3. Identify and define best practices and critical success factors essential for achieving sustainability goals within organizations.
CONTENTS
1. Introduction and Key Concepts of Sustainability
2. Principles and Practices of Sustainability
3. Measures and Reporting in Sustainability
4. Sustainability Implementation & Best Practices
To download the complete presentation, visit: https://www.oeconsulting.com.sg/training-presentations
Putting the SPARK into Virtual Training.pptxCynthia Clay
This 60-minute webinar, sponsored by Adobe, was delivered for the Training Mag Network. It explored the five elements of SPARK: Storytelling, Purpose, Action, Relationships, and Kudos. Knowing how to tell a well-structured story is key to building long-term memory. Stating a clear purpose that doesn't take away from the discovery learning process is critical. Ensuring that people move from theory to practical application is imperative. Creating strong social learning is the key to commitment and engagement. Validating and affirming participants' comments is the way to create a positive learning environment.
Discover the innovative and creative projects that highlight my journey throu...dylandmeas
Discover the innovative and creative projects that highlight my journey through Full Sail University. Below, you’ll find a collection of my work showcasing my skills and expertise in digital marketing, event planning, and media production.
2. Designing the Business Portfolio
• The business portfolio is the collection of businesses
and products that make up the company.
• The company must:
– analyze its current business portfolio or Strategic Business
Units (SBU’s)
– decide which SBU’s should receive more, less, or no
investment
– develop growth strategies for adding new products or
businesses to the portfolio
2
3. BCG Growth Share Matrix
Growth potential
Star
Problem Child
The message
• Segment your business portfolio properly
• Allocate cash based on combinations of
High
industry growth and relative market share
• Balance your portfolio
What you have to believe
Low
• Cash flow follows relative market share
• Growth is a good proxy for industry
Cash Cow
Dog
High
Low
Relative market share
DCO-ZZU43320040728sushPP1
Source:
attractiveness
• Capital is scarce
• Business units are discrete and synergies
negligible
Corporate Strategy – Old and3 New Perspectives, Charles Roxburgh
4. Analyzing Current SBU’s:
Boston Consulting Group Approach
High
High
Stars
• High growth & share
• Profit potential
• May need heavy
investment to grow
Cash Cows
Low
Market Growth Rate
Relative Market Share
• Low growth, high share
• Established, successful
SBU’s
•Produce cash
Low
Question Marks
?
• High growth, low share
• Build into Stars or phase out
• Require cash to hold
market share
Dogs
• Low growth & share
• Low profit potential
4
5. The McKinsey/GE nine-box matrix
The message
• Manage your portfolio actively
• Judge businesses on:
– Market attractiveness
– Competitive position
• Keep businesses that are well- positioned in
good markets
What you have to believe
• Corporation is best owner for all the
attractive businesses
• Synergies between businesses are negligible
• Corporate can access capital to fund growth
DCO-ZZU43320040728sushPP1
5
Source: Corporate Strategy – Old and New Perspectives, Charles Roxburgh
6. Analyzing Current SBU’s:
GE’s Strategic Business-Planning Grid
Business Strength
Industry Attractiveness
Strong
Average
Weak
C
High
A
Medium
B
D
Low
6
7. Problems With Matrix Approaches
Can be Difficult, Time-Consuming, & Costly to Implement
Difficult to Define SBU’s & Measure Market Share/ Growth
Focus on Current Businesses, But Not future Planning
Can Lead to Unwise Expansion or Diversification
7
8. Developing Growth Strategies in the
Age of Connectedness
Product/ Market Expansion Grid
Existing
Products
Existing
Markets
New
Markets
1. Market
Penetration
2. Market
Development
New
Products
3. Product
Development
4. Diversification
8
9. Product/ Market Expansion Grid
• Product Development: offering modified or
new products to current markets.
– How? New styles, flavors, colors, or modified
products.
• Diversification: new products for new
markets.
– How? Start up or buy new businesses.
9
12. Connecting With Customers
• Market Segmentation: determining distinct groups of
buyers (segments) with different needs, characteristics,
or behavior.
• Market Targeting: evaluating each segment’s
attractiveness and selecting one or more segments to
enter.
12
13. Connecting With Customers
Market Positioning: arranging for a product to
occupy a clear, distinctive, and desirable place
relative to competing products in the minds of
target consumers. i.e. Chevy Blazer is “like a rock.”
POSITIONING:
Text page 65
Bentley: “You don’t park it. You position it.”
For what target market is Bentley positioned?
Click or press spacebar to return.
13
14. Marketing Strategies for Competitive
Advantage
Strategy a Company
Adopts
Depends on Its
Industry Position
14
15. SEGMENT ATTRACTIVENESS CRITERIA
CRITERIA
EXAMPLES OF CONSIDERATIONS
SIZE
MARKET POTENTIAL, CURRENT MARKET PENETRATION
GROWTH
PAST GROWTH, FORECASTS OF TECHNOLOGY CHANGE
COMPETITION
BARRIERS TO ENTRY, BARRIERS TO EXIT, POSITION OF
COMPETITORS, ABILITY TO RETALIATE
SEGMENT SATURATION
GAPS IN THE MARKET
RISK
FIT
RELATIONSHIPS WITH
OTHER SEGMENTS
PROFITABILITY
ECONOMIC, POLITICAL, AND TECHNOLOGICAL
COHERENCE WITH COMPANY’S STRENGTHS AND IMAGE
SYNERGY, COST INTERACTIONS, IMAGE TRANSFERS,
CANNIBALIZATION
ENTRY COSTS, MARGIN, LEVELS, RETURN ON INVESTMENT
16. ARTHUR D. LITTLE COMPANY’S MATRIX
DOMINANT
HARVEST
HOLD
STRONG
BUILD
FAVOURABLE
TENABLE
UNACCEPTABLE
WEAK
EMBRYONIC
GROWTH
MATURITY
PRODUCT LIFE CYCLE
DECLINE
17. Portfolio frameworks shifted from competition in product
markets to competition for corporate control
So far …
Now …
Can the BU create value as
a standalone enterprise?
Can the corporate parent create more
value from the BU than any other
owner?
BU under
consideration
Promote BU
linkages
Corporate Center
Comp
etitive
positions
Corporate
center skills
BU 1
Industry
attractiveness
BU 2
BU 3
BU
linkages
DCO-ZZU433Source: Strategy Primer Series – A structured 17
codification of strategy knowledge for
20040728sushPP1
McKinsey, Part 8: Portfolio Matrices; German Strategy Practice
18. Toward a new approach to shaping
portfolio
Traditional approach (old world)
Realities of today’s
environment
• Tendency to focus on business
unit as the unit of analysis
• Often opportunistic and reactive
• Acquisition biased
• Bimodal, tending toward
consolidation within a piece of
the value chain or major M&A
Toward a new approach
• View portfolio through multiple
• Greater emphasis on
economies of scope
(not just scale)
• Globalization
• Falling transaction
costs/expanding
technology
• Shorter product life
cycles
lenses
• Vary approach by company
archetypes
• More programmatic vs. reactive
• Balanced acquisition and exit
approach
• Consider broad range of vehicles
Source: Emerging Thoughts on Shaping the Corporate Portfolio; David Dorton, Patrick
Viguerie
DCO-ZZU43320040728sushPP1
18
19. Archetype-specific
Synergies captured from each archetype
Discrete, multibusiness
Shared asset
Integrated go to market
• Significantly underperform
• Outperform discrete,
• Strongest performers by
shared asset and integrated go
to market
• Most active segment (>2x other
segments)
• More balanced approach
(acquisition/divestitures)
• Highest experience level with
large deals
• Winners execute much smaller
deal (20% of average size of
losses)
multibusiness (2x) yet lag
integrated go to market
• Most capital-intensive business
model (nearly 2x D/E ratio vs.
other segments)
• Highest average deal size
(nearly 3x other segments)
• Winners execute fewer, smaller
deals (50% size of losers)
significant margin (8x better
than discrete)
• Most capital efficient business
models (winners with 4x ROIC
vs. winners in other segments)
• Winners are much more
acquisitive (>2x losers)
Overall
• Lowest performers across archetypes execute larger deal on average
• Winners tend to be no more active than losers suggesting that quality matters more than activity
• Winners tend to be relatively more acquisitive
• Divestitures are underutilized as a value creation lever
DCO-ZZU43320040728sushPP1
19
Source: Emerging Thoughts on Shaping the Corporate Portfolio; David Dorton, Patrick Viguerie
20. 4 lenses through which to view and define the “shaping unit” for purposes of portfolio
decisions
2
1
Risk/Return lens
• Groups of products,
businesses, or business
system components with
similar risk/return
characteristics
• Most appropriate
when making
– Buy/sell/JV decisions
– Capital allocation and
investment decisions
DCO-ZZU433-20040728sushPP1
Capability/competency lens
• Groups of existing, emerging or
• potential units, based on discrete
capabilities and competencies
• Most appropriate when making
– Hold vs. sell decisions (“better owner”)
– Assessment of “white space”
opportunities or opportunities to
extend economies of scope
Organizational/incentive lens
• Units defined according to existing
organizational and/or incentive structures
• Most appropriate when making
– Assessment of legal/tax/
accounting implications
– Judgments as to how to effect
portfolio change in an organization
3
Maturity lens
• Business units defined
according to stage of maturity
of product in lifecycle
• Most appropriate when making
– Moderate diversification
decisions to accelerate
growth and perpetuate the
corporate existence
– Liberation decisions
(sell, spin-off, carve out)
4
20
Source: Emerging Thoughts on Shaping the Corporate Portfolio; David Dorton, Patrick Viguerie
21. Viewing the portfolio through lenses has important
implications for shaping strategy
Lens
1. Risk/return
2. Capabilities
3. S-curve
High
DISGUISE
D
EXAMPLE
4. Organizational/incentive
Infrastructure
4
6
Upside
Service
5
A
2
B
C
D
3
1
Low
Low
Other
Liberate
Legacy
product
Applications
Joint venture
Systems
Data
High
Risk
Illustrative
findings
• Future market cap not related
•
•
•
to size of current units
Several “high-potential” growth
businesses unlikely to
meaningfully drive market cap
At least one “big bet” required
to drive value
Several low risk, low return
units
• Invest aggressively to ensure
“4” is successful
Implications
• Exit low return/high risk cluster
• Isolate L/L cluster and exit if
possible
DCO-ZZU43320040728sushPP1
• Portfolio as configured requires • Revenues disproportionately
•
•
•
excellence along multiple
dimensions
Critical capabilities missing
from at least 1 growth business
Ownership of “A” compromises
market opportunity
Technical foundation in “D”
required for success in “C”
• Separate “A” to enable marketfocused pure play
• Joint venture “D” build
capabilities to support growth
in “C”
•
•
driven by mature businesses
Growth investment in new
businesses badly aligned with
potential to drive value
Diversification benefits from
applications and systems
business
• Disproportionate management
•
•
• Refocus growth investment
•
around moderately diversified
growth profile
Continue to scale vs. creating
exit options for select mature
businesses
• Isolate businesses requiring
performance vs. growth focus
• Align incentives to capture
•
21
focus and strategic attention to
several small businesses
without potential for real
leadership
Shared incentives and channels
make true performance
accountability and focus
difficult
Few incentives to capture
cross-BU synergies (“silos”)
upside and prepare for
potential exit
Create services sales capability
22. The SHAPE framework: Building blocks of portfolio design
Aspirations
• Aspirations provide unconstrained guidance
for portfolio agenda
• Shaping agenda continually iterates between
aspirations and portfolio characteristics
Performance Profile
Head room
• Unit-by-unit economics
• Companies should actively
drive the risk/return
profile of the portfolio
• The shaping agenda
should not be driven to
moderate cash flow
volatility risks
manage their portfolio to
ensure adequate growth head
room and therefore, platforms
for value creation
• The weighted average maturity
of the portfolio determines the
available headroom
Enablers
Synergies
• External factors
determine the
degrees of freedom
available in creating
the shaping agenda
(e.g., capital markets,
deal flow)
• Dominant source of synergies
•
(economies of skill, scale, and
scope) are determined by asset
configuration “archetype”
Transactions should follow shaping
logic driven by asset configuration
DCO-ZZU43320040728sushPP1
22
Source: Emerging Thoughts on Shaping the Corporate Portfolio; David Dorton, Patrick Viguerie
23. Crafting a SHAPE agenda: an iterative process
“Left brain” activity (aspirations)
2. What do we
want to be?
“Right brain” activity
Shape agenda
–
“The
Playbook”
1. How high
should my
aspirations
be?
3. What skills
can we
leverage?
2. Program/
thematic
shaping
options
1. Portfolio
diagnostic
• Synergies
• Headroom
• Profile
• Enablers
3. Transaction
strategy
4. Do I have
time to pull
this off?
Source: Emerging Thoughts on Shaping the Corporate Portfolio; David Dorton, Patrick
Viguerie
DCO-ZZU43320040728sushPP1
23
24. Research has shown that moderately diversified companies can
outperform over long time periods…
Focused
Cumulative excess returns to shareholders*
Percent
600
CAGR
Percent
558
10
225
6
112
4
500
400
300
200
100
0
1980 1982 1984 1986 1988 1990 1992 1994 1996 1998 2000
DCO-ZZU43320040728sushPP1
Source: Emerging Thoughts on
24
Shaping the Corporate Portfolio; David Dorton, Patrick Viguerie
Diversified
Moderately
diversified
25. . . . and generate above-average growth performance and expectations
Growth 1990-2000
Percent
10 year EPS
growth CAGR
All*
Focused
Top quartiles**
6
Moderately
diversified
Diversified
10 year EBITDA
growth CAGR
Top quartiles**
18
13
21
19
9
6
All*
22
11
• Moderately diversified
25
19
15
companies can create
growth at or above that
of focused companies
• Particularly important
given later stage
S-curve status of
moderately diversified
companies on average
• Case studies also
illustrate that moderate
diversification can create
significant value form
long-term growth
expectations embedded
in stock price
* Average value
** Median value
Note: Includes approximately 167 companies that existed fro the last 10 years, does not take into account entries and exits
Source: Emerging Thoughts on Shaping the Corporate Portfolio; David Dorton, Patrick Viguerie; Compustat; McKinsey analysis
DCO-ZZU43325
20040728sushPP1
26. Moderate diversification allows companies to transcend multiple S-curves at
certain points in their life cycle
Transition
periods
Liberate units
where net
synergies are
exhausted
Enter new
businesses
where
capabilities
match
discontinuities
Focus to
build
capabilities
and meet
expectations
DCO-ZZU43320040728sushPP1
Cull underperforming units
rapidly
Create
multiple
strategic
options
Moderately
diversify to
grow
• Moderate diversification
allows companies to place
several bets on future
potential growth
opportunities
• Strong focus on core
business with dynamic
moderate diversification
generates higher growth by
enabling companies to
stride multiple S-curves
Reshuffle business mix through
active trading of portfolio
Continuous loop
26
Source: Emerging Thoughts on Shaping the Corporate Portfolio; David Dorton, Patrick Viguerie
27. Implications and opportunities for any given corporation depend
on starting position…
High
Opportunistic
liberation
Relative
expected
long-term
growth rate*
Focus on
delivery
Dynamic
portfolio
reshaping
Focused
transformation
Moderate
diversification
Low
Low
Degree of focus (HHI)
* Long-term
DCO-ZZU433- growth expectations embedded in the stock price relative to that of the industry
27
20040728sushPP1
Source: Emerging Thoughts on Shaping the Corporate Portfolio; David Dorton, Patrick Viguerie
High
28. . . . and requires aggressive management of entity boundary
Rapid culling
Definition
Early liberation
Active trading
Proactivity
• Rapidly exit when
• Separate from new
• Actively trade
• Actively seek to match
detect early signs of
potential failure
Negative pattern• Hold on to underperforming
businesses too long
• Divest only when
faced with significant
market pressure
DCO-ZZU43320040728sushPP1
businesses when
– Capabilities have
been fully leveraged
– Potential synergies
have been captured
– Value from
liberation is
substantial
• Hold on to successful
new businesses past
the point where
additional synergies
can be
captured/created
portfolio on a
continuous basis and
have an M&A
program that is
balanced over time
and programmatic
ongoing internal scan
for capabilities that
can be applied in new
related areas with
external search for
discontinuities
• Relentlessly stick to
• Passively manage the
portfolio; do not
constantly reevaluate
M&A and divestiture
opportunities
core business or
• Diversify in reaction
to underperformance, external
pressure or
• Diversify by making
“me too” moves a
beat too late
11 points TRS difference between companies exhibiting 3-4 positive characteristics
and those exhibiting 3-4 negative patterns
28
Source: Emerging Thoughts on Shaping the Corporate Portfolio; David Dorton, Patrick Viguerie
29. Corporate portfolio diagnostic can help assess starting point
Step
Focus
Performance
and prospects
1. Evaluate business performance of BUs at high
level
• Financial performance
• Associated Risks
2. Estimate life cycle phase of BUs
3. Evaluate growth potential and prospects of
BUs, on a preliminary basis
Implications
• Understand at a high level where value is
created
• Understand where greatest value creation
potential and growth opportunities are
likely to be
4. Identify potential synergies yet to be captured
Synergies
between BUs, on a preliminary basis
• Revenue based
• Cost based
• Asset based
5. Scan for emerging capabilities and new areas
Capabilities
of expertise potentially applicable to adjacent
business spaces
• Understand at a high level where there
are clear synergies to be captured going
forward
• Identify BUs for which ongoing synergies
are less clear as areas for further probing
• Emerging capabilities identified may be
matched to external discontinuities, once
these have also been identified
• A two-day diagnostic can provide a high-level view on:
– Potential areas of streamlining
– Potential changes in prioritization
– Potential areas of future growth
• It can help prioritize areas of reassessment and lead to effective changes in scope management
• Combined with a CMD, it can be a powerful tool to start meaningful discussions with clients
DCO-ZZU433-20040728sushPP1
29
Source: Focus is not enough: Shaping the Corporate Portfolio for Sustained Value Creation; Neil Harper, Patrick Viguerie
30. Step 1 – Evaluate BU performance PROGRESS
WORK IN at
Ratings
high level
High growth, highly profitable business
Very low growth, unprofitable business
Steps
Sample end product for one BU
• List businesses in portfolio ( use a product
driven approach to define businesses)
• Obtain segment operating performance
Pre tax
ROIC
data from annual reports, SEC filings and
analyst reports
ROIC
• For each business create the ROIC tree to
identify the key value levers; disaggregate
sufficiently until the real sources of
performances is reached
Spread
• Compute WACC for each BU using peer
growth and spread for the last five to ten
years
SG&A
Capital
turnover
WACC
group unlevered beta of each business;
subtract WACC from ROIC to derive the
spread
• Assess historical performance in NOPLAT
1 – tax
rate
Operating
margin
COGS/
revenue
NOPLAT
growth
Rating:
Rationale: High operating margins coupled
with sustained revenue growth for the past
DCO-ZZU433ten years
30
20040728sushPP1
Source: Focus is not enough: Shaping the Corporate Portfolio for Sustained Value Creation; Neil Harper, Patrick
31. Step 2 – Identify S-curve positions of BUs in business mix evolution
WORK IN PROGRESS
Steps
Sample end product
BROADWING
• Identify the major transition periods in corporate
scope during the last decade
Moderately diversified
into non-telephony
1991
Streamlined
businesses
1998
Local phone
($ 590 M)
• Measure the EBITDA growth and excess returns
relative to the industry for each major period
Local phone ($ 718 M)
Customer
care and
billing
($ 288M)
• Identify the major business mix evolution events in
each period
• Plot each BU’s life cycle stage on company S-curve for
each period
Customer care
and billing
($ 548M)
Telemarketing
($ 448M)
Telemarketing
($ 85M)
• Characterize each period with the dominant scope
management characteristics demonstrated during
the period
Wireless
($ 91 M)
EBITDA CAGR
Excess returns
Analysis highlights comparative
performance for every corporate
scope period determined by
where each BU stood in its life
stage
1983-97
Proactive search
1%
4%
• Spun off telemarketing,
Streamline
Change
business
mix
• Acquired Auxton computers
•
Position
for
growth
-
1998-1999
Early liberation
-19%
35%
and Vanguard Technologies
to grow the customer care
and billing business (1983)
Formed telemarketing
division (1989)
customer care, and billing
business after fully
exploiting the synergies
(1998)
• Formed a JV with AT&T to
provide wireless services (1998)
• Acquired IXC Communications
to enter the broadband
business (1999)
DCO-ZZU43331
Source: Focus is not enough: Shaping the Corporate Portfolio for Sustained Value Creation; Neil Harper,
20040728sushPP1
Patrick Viguerie
32. Step 3 – Evaluate growth potential and future profitability of BUs
Ratings
Low uncertainty, high expected growth business
High uncertainty, low expected growth business
Steps
Sample end product for one BU
• Obtain expected segment operating
performance data from analyst reports
• Interview industry experts to check
NOPLAT
growth
reasonableness of forecasts and make
necessary adjustments
• For each business, create the expected
Expected
ROIC
Spread
ROIC tree to identify the key value levers;
disaggregate sufficiently until the real
sources of performances is reached
• Assess expected performance in NOPLAT
growth and spread for the foreseeable
future years; rate overall attractiveness
DCO-ZZU43320040728sushPP1
Pre tax
ROIC
Capital
turnover
1 – tax
rate
WACC
Market
BU share
1
3%
2
15%
3
30%
• Compute WACC for each BU using peer
group unlevered beta of each business;
subtract WACC from ROIC to derive the
spread
Operating
margin
Industry
growth
Medium
High
Low
Relative
growth
High
Low
Low
Riski
ness
Low
High
Low
Rating:
Rationale: High expected ROIC due to capital turnover improvements
coupled with with high growth relative to the industry
32
Source: Focus is not enough: Shaping the Corporate Portfolio for Sustained Value Creation; Neil Harper, Patrick Viguerie
33. Step 4 – Identify potential synergies yet to be captured amongst BUs
WORK IN PROGRESS
Ratings
Capabilities fully leveraged and potential synergies have been captured
High potential for leveraging the capabilities from core and other BUs and high latent synergies to be captured
BU1
BU2
BU3
BU4
Incremental
synergy capture
No significant
incremental synergy to
be captured
Few incremental
synergies to be
captured
Some limited
incremental
synergies to be
captured
Significant incremental
synergies still to be
captured
Value from separation
High given active
market for corporate
control and need for
greater focus
High
Lower than value of
incremental synergy
capture
Lower than value of
incremental synergy
capture
Dis-synergy
from separation
Limited
Limited
Material
Significant
Value creation
potential
Low
High
Low to moderate
Moderate to high
Ability to extract
value
One of the pack
One of the pack
Natural owner
Natural owner
Candidate for culling or
separation
Candidate for
liberation
Candidate for lower
prioritization (change
in resource
allocation)
Steps
• Conduct interviews with
CST and BU managers to
assess the asset,
revenue and cost based
synergies amongst the
BUs
• Assess the ability to
extract value considering
corporate center skills
and business unit
linkages in the portfolio
• Develop a day 1
hypothesis for the given
BU based on synergy
assessment
Overall attractiveness
Consolidate for higher
prioritization (change
in business mix)
DCO-ZZU43333
20040728sushPP1
Source: Focus is not enough: Shaping the Corporate Portfolio for Sustained Value Creation; Neil Harper, Patrick
34. Step 5 – Assess the capabilities for
WORK IN PROGRESS
scanning the periphery
Ratings
Informed point of view on emerging technologies and business models: major players,
opportunities and barriers, likely success, and threats/opportunities to core businesses
Minimal understanding of emerging technologies or business models and how they impact core
businesses
Steps
Sample end product
• Identify who in organization is responsible for systematic
Ratings based on ability to complete matrix below
scanning of periphery (if possible, estimate headcount relative
to competitors).
New technologies and business models
• Interview strategic planning, BU heads, to assess degree of
1
knowledge of periphery
– Emerging technologies and business models
– Major players in each technology/business
– Opportunities and risks/barriers to success
2
3
A
B
C
D
– Expected success
Opportunities/
barriers
– Assessment of threats/opportunities posed to core
businesses
Competitor bets
literature searches, industry and analyst reports*
• Tap employees who are alumni of competitors
5
Players
– Competitor bets
• Benchmark client view against McKinsey practice experts,
4
Likelihood of
success
Threats/
opportunities to
Source: Focus is not enough: Shaping the Corporate Portfolio for Sustained Value Creation; Neil Harper, Patrick Viguerie
DCO-ZZU433core
34
20040728sushPP1
* For complete methodology of periphery scan, see Creative Destruction EM Guide to Creation
35. Exit/ownership restructuring options should follow from this
systematic diagnostic
WORK IN PROGRESS
Value
with
improvement**
>current
value
Can be
achieved by
current
mgmt?
No
Greater value
to another
player?
No
Material
synergies with
other BUs?*
No
IPO possible?
No
Consider full
spin-off***
Yes
Yes
Yes
Value
of mkt-based
mgmt incentives
high?
No
Keep
Yes
Yes
Keep and
improve
Consider
sale
Consider
tracking stock
Consider carve out
then spin-off***
* Which can not be captured at arm’s length
** Hexagon framework for optimization
*** Decision based on assessment of key sources of value: a) Include strategic flexibility; b) improved market for corporate
DCO-ZZU433control; c) greater management focus; d) improved management incentivization
35
20040728sushPP1
Source: Focus is not enough: Shaping the Corporate Portfolio for Sustained Value Creation; Neil Harper, Patrick Viguerie
36. Companies that actively manage their portfolios create more
value than those that do not
Value of $100 invested from Jan 1990-Dec 1999*
$459
30%
$353
Passive
portfolios
Average number of
transactions**
2
Active
portfolios
15
* Risk adjusted for beta, 200 largest companies (by market capitalization) in 1990 still existing in 2000
** The third of the sample with the fewest transactions was classified “passive” and the third with the most transactions was classified “active”
DCO-ZZU433-
36
Source: Proactive Divestiture: Selling ‘Good’ Businesses, Lee Dranikoff, Tim Koller, Sam Lee, Becca O’Brien, Antoon Schneider, Brian Williams
20040728sushPP1
37. A majority of divestitures, which are an important part of active portfolio management, are
only made in reaction to pressure
Reactive
Proactive vs. reactive divestitures*
% of deals
Proactive
100% = 49
Proactive divestitures for
strategic reasons with no
evidence of performance
decline
Pressure due to corporate
parent underperformance
(35%)
24
76
Proactive divestitures probably
even fewer; benefit of the doubt was
given when no evidence of pressure was
found
Pressure due to business unit
underperformance – or both
parent and business unit (41%)
* Based on analyst reports, press articles and financial analysis of all divestitures mentioned in the WSJ during 4 one-month periods
Source: Proactive Divestiture: Selling ‘Good’ Businesses, Lee Dranikoff, Tim Koller, Sam Lee, Becca O’Brien, Antoon Schneider, Brian Williams
DCO-ZZU43320040728sushPP1
37
38. Thus, most divestiture decisions are delayed for a significant period
Timeliness of reactive divestitures
% of deals
100% = 37
Rapid response
• Quick exit when BU underperformance becomes
clear
• Timely response to market pressure
• Reasonable step to resolve corporate
underperformance, done as quickly as possible
35
Late response
• Persistent, long-term business unit
underperformance
• Continuous investor pressure on corporation to
divest
• Business underperformance completely
transparent to market
• “Fire sale” or shut down
76%
65
DCO-ZZU43320040728sushPP1
38
Source: Proactive Divestiture: Selling ‘Good’ Businesses, Lee Dranikoff, Tim Koller, Sam Lee, Becca O’Brien, Antoon Schneider, Brian Williams
39. Hanging on to business units too long can impose three types of
costs on the corporation
Hidden costs of
ownership imposed
by BU on its parent
Costs imposed by
wrong parent on BU
Value decline due to
unmet expectations
The parent and the rest of the organization can be dragged
down by a business unit and the business unit can impose a
substantial opportunity cost of scarce management time
By holding on too long, a parent can stunt business unit
growth, causing lower performance
Companies tend to hold on to businesses despite low
potential to meet market expectations, dragging down
overall shareholder returns – a cost that can be difficult to
quantify
DCO-ZZU43339
Source: Proactive Divestiture: Selling ‘Good’ Businesses, Lee Dranikoff, Tim Koller, Sam Lee, Becca O’Brien, Antoon Schneider, Brian Williams
20040728sushPP1
40. Over time, business units impose substantial but largely hidden costs on their
parent
Potential costs
Explanation
1. Culture and
skill
As a business unit matures, its culture may become incompatible with the culture that the
company wants to create, hampering the rest of the corporation’s efforts to change
2. Imperative to
create
Stable operating units, while potentially important for cash management, can remove the
impetus to create; without an “emergency,” incremental improvements triumph over
substantial change
3. Management
time
Scarce management time can be diverted into operating a business unit that is not part of
the future of the company
4. Decision making
Mismatched business units can lead to poor decision making because of conflicts of interest
and cross-subsidization
5. Talent attraction
and
management
Attracting talent with the desired mindset is difficult when a company is viewed by the talent
market as synonymous with one particular business unit (with different talent needs);
maintaining contrasting employee propositions within the group is difficult
6. Investor
credibility
Investors may find it difficult to believe that a company can manage business units with
different needs, creating a type of conglomerate discount and reducing appeal to all classes of
investors
DCO-ZZU43320040728sushPP1
40
Source: Proactive Divestiture: Selling ‘Good’ Businesses, Lee Dranikoff, Tim Koller, Sam Lee, Becca O’Brien, Antoon Schneider, Brian Williams
41. Due to these factors, selling ‘good’ businesses should be considered
in managing the company’s portfolio
Potential types of sales
Rationale
Selling cash cows
definition, cash cows have high market shares in stable
By
industries
a result, they have low market headroom and low ability
As
to surprise the market
They also may present substantial downside risk if market
share unexpectedly declines
they are likely to impose hidden costs of ownership on
And
the parent
These factors need to be balanced against the benefits of
cash cows, e.g., stable cash flow during downturns
Selling business with high market
share
with cash cows, high-market-share businesses have
As
low market headroom and may present a risk if market
share unexpectedly declines
Selling business even if industry
has significant remaining growth
potential
growth is positive, but declining, the market may be
If
disappointed, leading to lower shareholder returns
Sell profitable businesses
a business is profitable but imposes hidden costs on the
If
parent, it may require sale
DCO-ZZU43320040728sushPP1
41
Source: Proactive Divestiture: Selling ‘Good’ Businesses, Lee Dranikoff, Tim Koller, Sam Lee, Becca O’Brien, Antoon Schneider, Brian Williams
42. An ongoing proactive divestiture program requires 3 important
elements
Comments
Forcing mechanisms
• Most companies only divest when under some pressure or after
some dramatic event, e.g., change in top management
• Forcing mechanisms should be built into the corporate processes to
prompt proactive divestitures
• People with the right motivation, skills, and incentives are needed
Talent
Simple
communication
strategy
to make the case for divestitures at every level of the organization,
i.e., board, top management, and operating management
• A simple communication strategy on divestitures has to be
developed and communicated to the whole organization to
uphold morale and avoid negative market signaling effects
DCO-ZZU43342
Source: Proactive Divestiture: Selling ‘Good’ Businesses, Lee Dranikoff, Tim Koller, Sam Lee, Becca O’Brien, Antoon Schneider, Brian Williams
20040728sushPP1
43. Proactive divestiture decision tree: 3 steps to divesting a business
1.
?
Which businesses should
?
be divested?
?
?
?
?
?
?
Divestiture candidates
3.
Can it be done,
how and when?
?
X
Exit feasibility,
method and timing
DCO-ZZU43320040728sushPP1
2.
Would what’s left
make sense?
Overall portfolio
assessment
43
Source: Proactive Divestiture: Selling ‘Good’ Businesses, Lee Dranikoff, Tim Koller, Sam Lee, Becca O’Brien, Antoon Schneider, Brian Williams
44. In summary, top performers in portfolio management excel in a
specific set of dimensions
Best practices
1
Define an appropriate level of portfolio complexity
2
Leverage truly distinctive corporate competencies and synergies
3
Selectively build growth opportunities
4
Proactively trade the portfolio and re-allocate resources
DCO-ZZU433Source:20040728sushPP1
New Frontiers in Portfolio Management, Abengoeachea, et. al.
44
45. GE BUSINESS SCREEN CELLS - STRATEGIES
STRATEGY
BUSINESS
PROSPECTS
COMPETITIVE
COMPATIBILITY
RECOMMENDED STRATEGY
LEADER
HIGH
AVERAGE
TRY HARDER
HIGH
MEDIUM
DOUBLE OR QUIT
HIGH
WEAK
GROWTH
AVERAGE
AVERAGE STRONG
CUSTODIAL
AVERAGE
AVERAGE
PHASE
WITHDRAWAL
LOW
AVERAGE
CASH GENERATION
LOW
STRONG
LOW
WEAK
HOLD HIGH MARKET POSITION WITH ALL
ANY RESOURCES
ALLOCATE MORE RESOURCES TO BECOME
LEADER
PICK PRODUCTS LIKELY TO BE FUTURE HIGH
FLYERS FOR DOUBLING AND ABANDON
OTHERS.
MAY HAVE STRONG COMPETITION WITH NO
ONE COMPANY AS LEADER. ALLOCATE
ENOUGH RESOURCES TO GROW WITH
MARKET
MAY HAVE MANY COMPETITORS, MAXIMISE
CASH GENERATION WITH MINIMAL NEW
RESOURCES.
SLOW WITHDRAWAL TO RECOVER MOST OF
THE INVESTMENT
SPEND LITTLE CASH FOR FURTHER
EXPANSION AND USE THIS AS A CASH
RESOURCE FOR FASTER GROWING
BUSINESSES
LIQUIDATE AND INVEST ELSEWHERE
DISINVEST
46. SECTORAL PROSPECTS
SHELL’S DIRECTIONAL POLICY MATRIX
ATTRACTIVE
LEADER
AVERAGE
LEADER
GROWTH
ATTRACTIVE
CASH
GENERATION
STRONG
TRY HARDER
CUSTODIAL
PHASED
WITHDRAWAL
AVERAGE
UNITS COMPETITOR POSITION
DOUBLE
or
QUIT
HASED
WITHDRAWAL
DISINVEST
WEAK