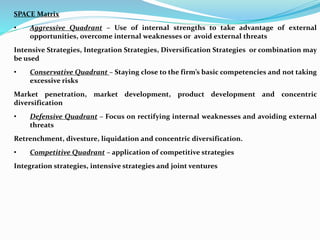
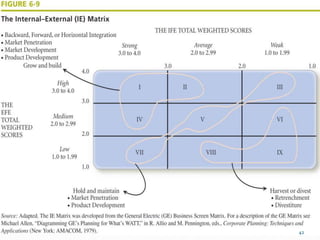
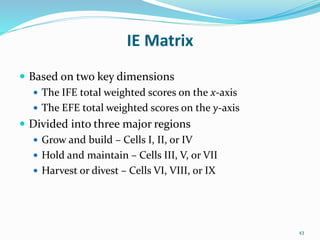
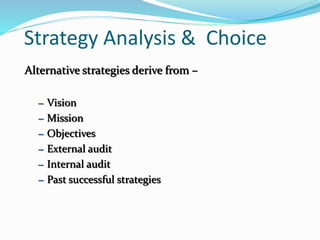
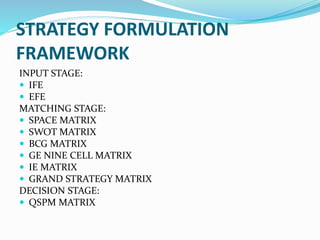
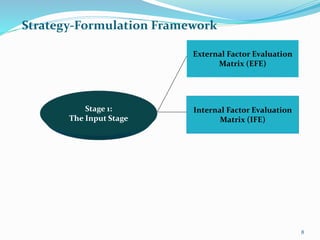
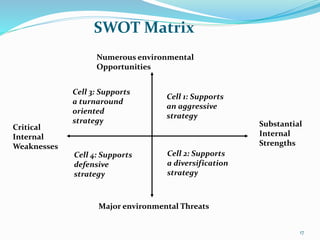
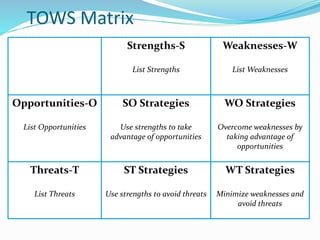
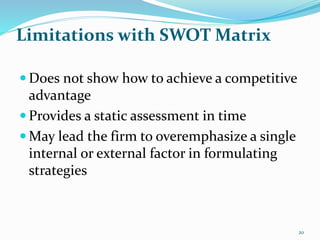
The document discusses various strategic analysis and choice frameworks including the EFE matrix, IFE matrix, SWOT matrix, SPACE matrix, BCG matrix, GE nine-cell matrix, and IE matrix. It provides details on how to conduct an analysis using each framework, including how to evaluate internal and external factors, match strategies, and determine the appropriate strategic position and actions. The frameworks help organizations generate strategies by analyzing their internal strengths and weaknesses as well as external opportunities and threats.

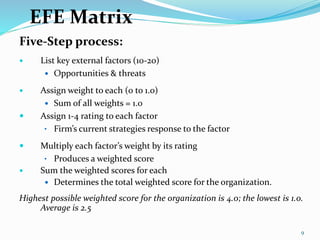
![Internal Factor Evaluation (IFE) matrix
[It is similar to EFE Matrix, only difference is it uses
internal factors( strengths and weaknesses) rather
than external factors (opportunities and threats)]](https://image.slidesharecdn.com/strategicanalysisandchoice-190225130140/85/Strategic-analysis-and-choice-12-320.jpg)
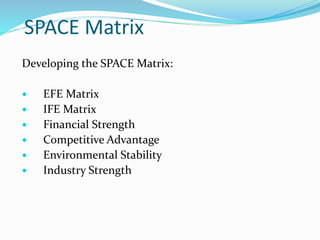
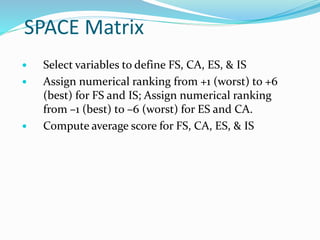
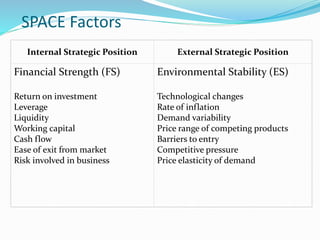
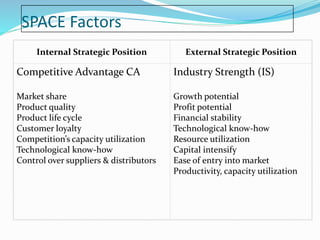
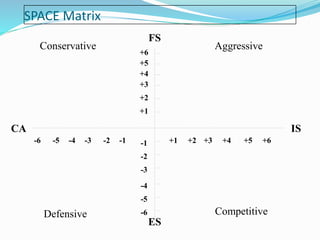
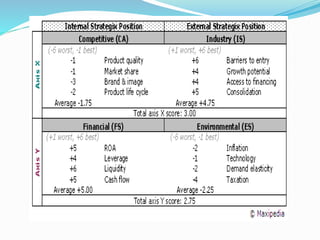
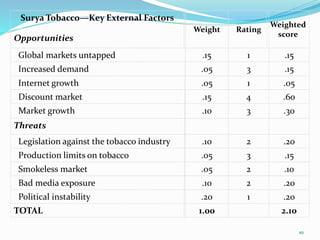
![SPACE Matrix
Two Internal Dimensions
Financial Strength [FS]
Competitive Advantage [CA]
Two External Dimensions
Environmental Stability [ES]
Industry Strength [IS]](https://image.slidesharecdn.com/strategicanalysisandchoice-190225130140/85/Strategic-analysis-and-choice-22-320.jpg)
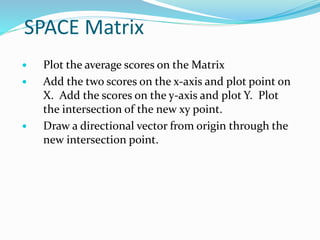
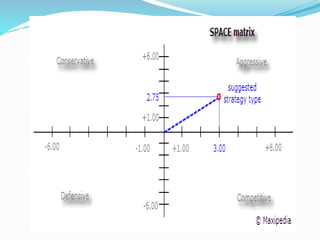
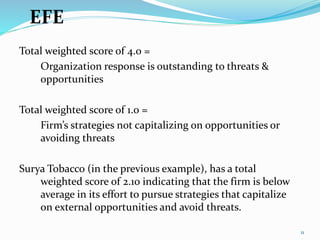
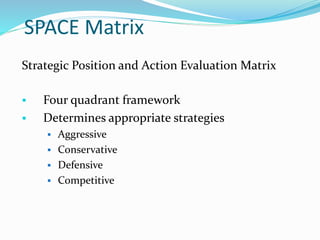
![SPACE Matrix
Overall Strategic position determined by:
Financial Strength [FS]
Competitive Advantage [CA]
Environmental Stability [ES]
Industry Strength [IS]](https://image.slidesharecdn.com/strategicanalysisandchoice-190225130140/85/Strategic-analysis-and-choice-23-320.jpg)