Downloaded 618 times


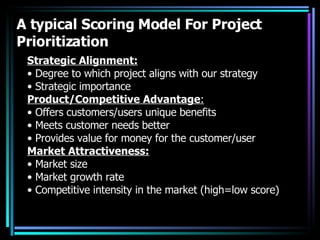
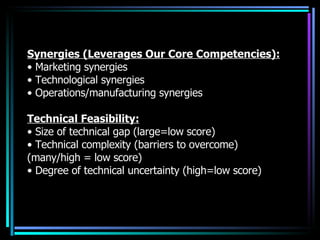

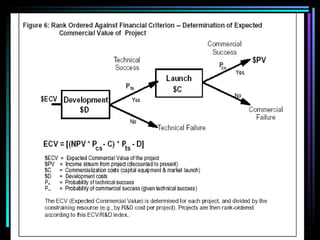
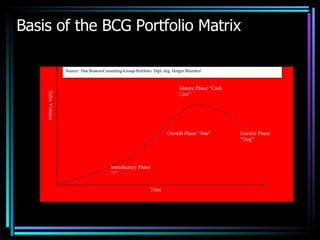


The document discusses portfolio management for new products. It notes that portfolio management has become an important management function due to shorter product lifecycles and increased global competition. It then outlines some pitfalls of poor portfolio management such as projects not being strategically aligned and spending not reflecting business priorities. The importance of effective portfolio management is also discussed in terms of maximizing returns, maintaining competitiveness, and allocating resources efficiently. A typical scoring model for prioritizing projects is presented based on factors like strategic alignment, market attractiveness, and risk versus return. Finally, portfolio analysis methods like the BCG matrix are briefly described.


![Awareness of digital currency[1] (1).pptx](https://cdn.slidesharecdn.com/ss_thumbnails/awarenessofdigitalcurrency11-260125155504-b1badee4-thumbnail.jpg?width=640&height=640&fit=bounds)


