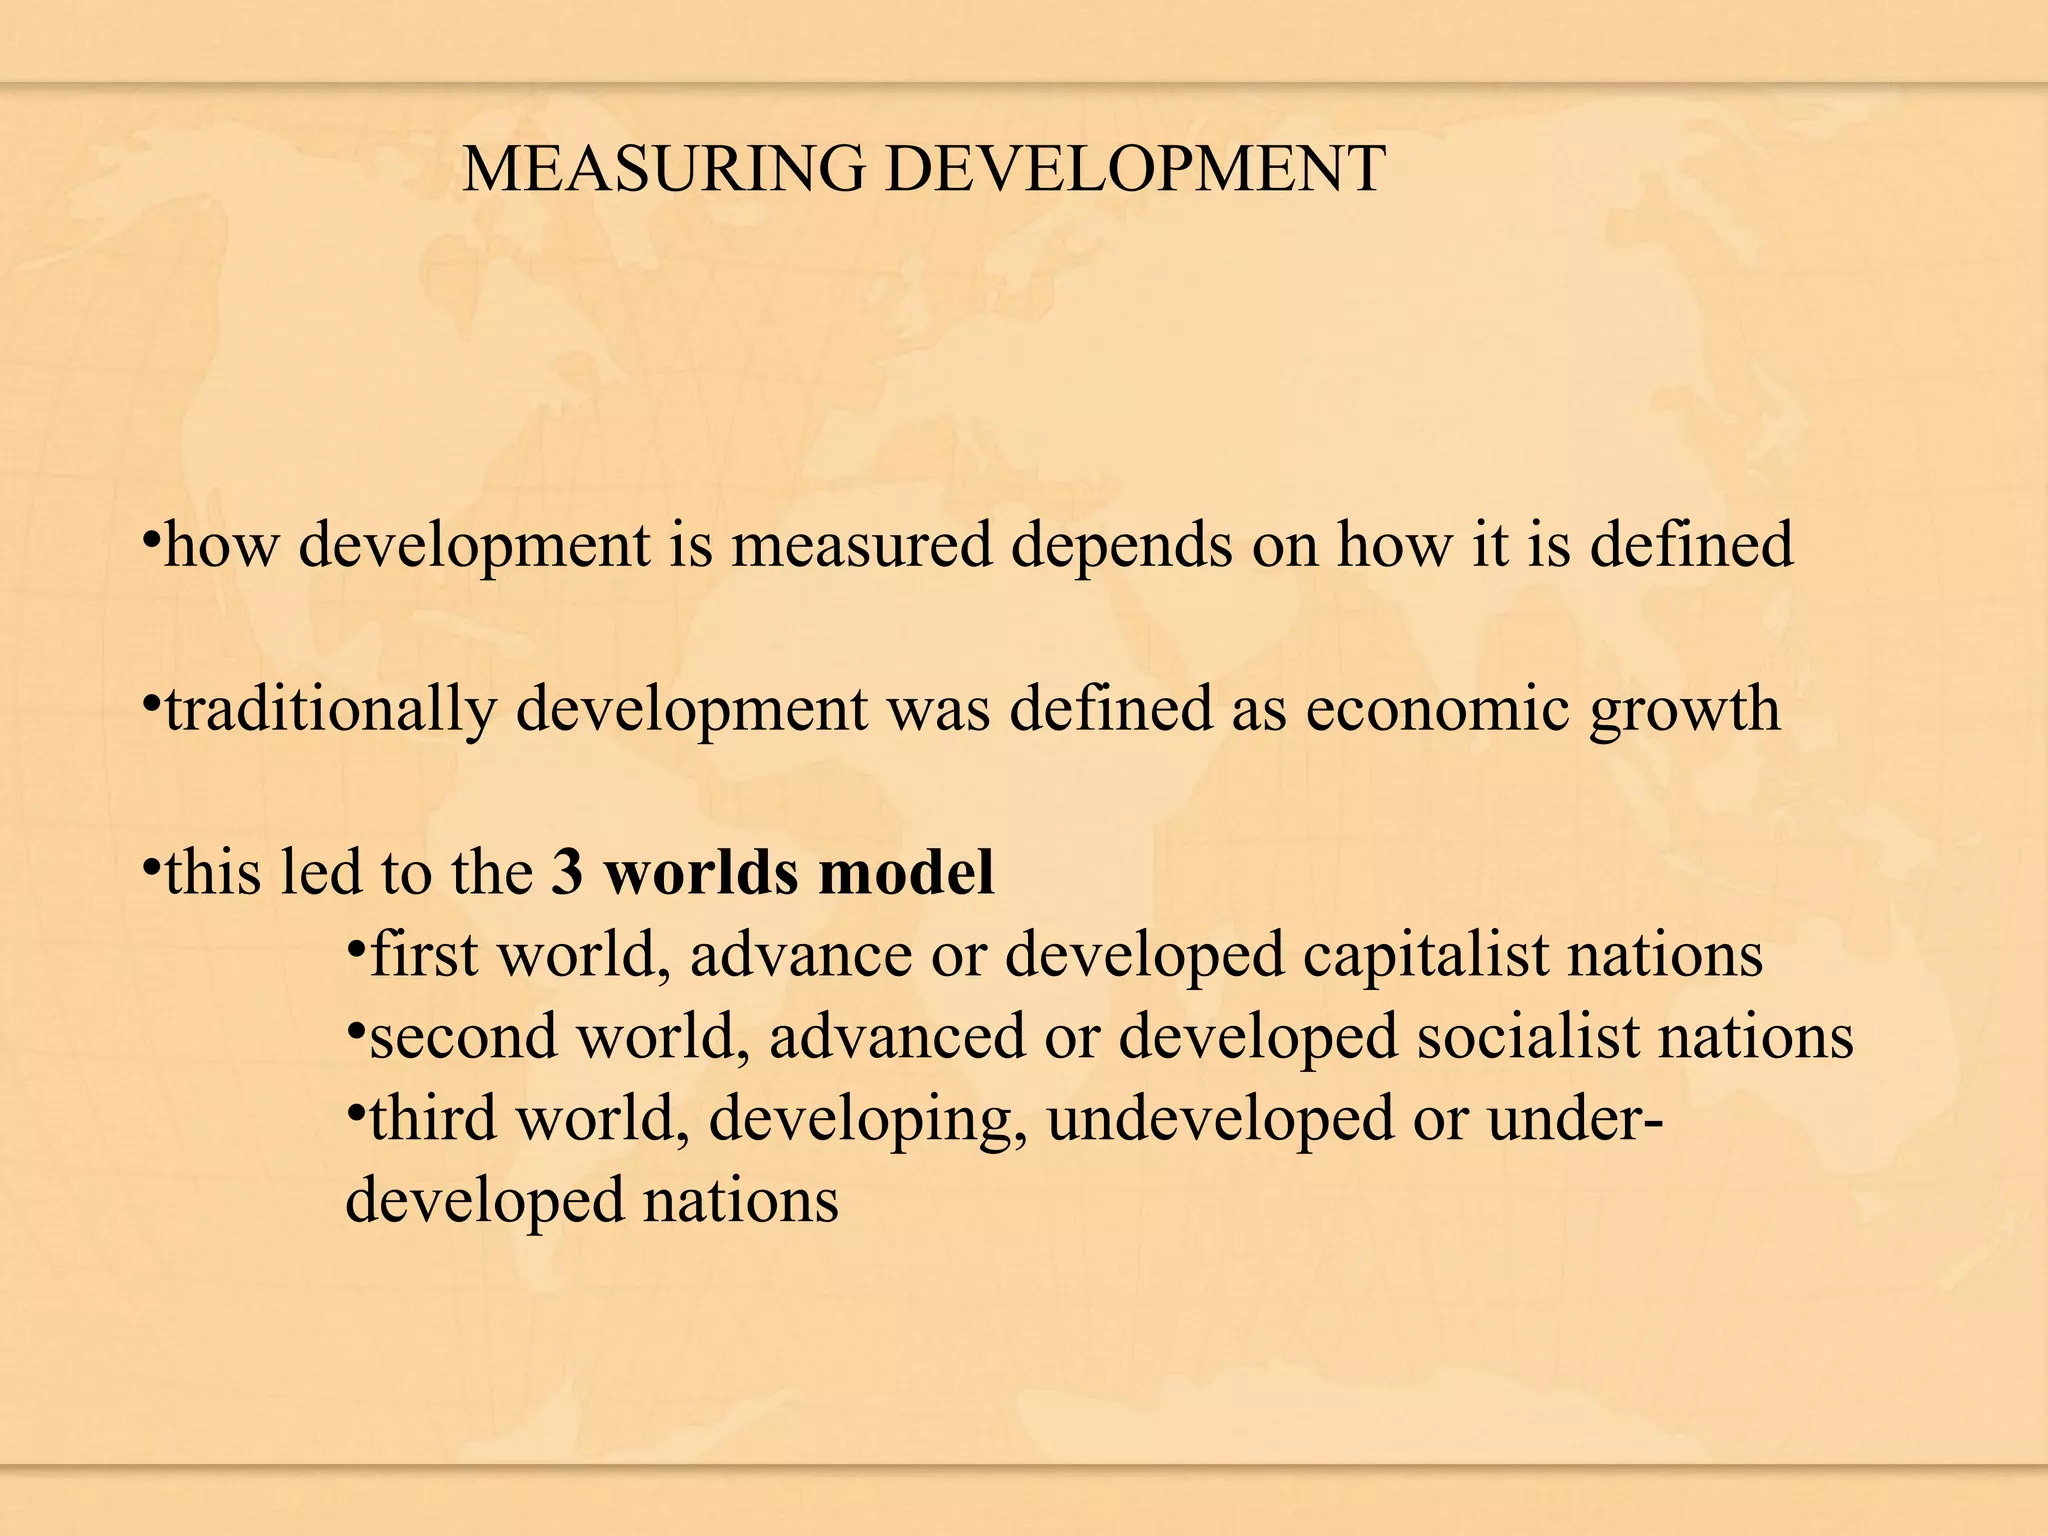
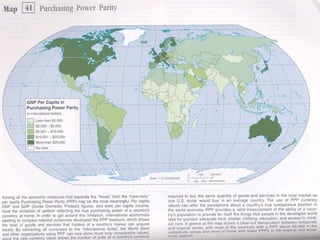
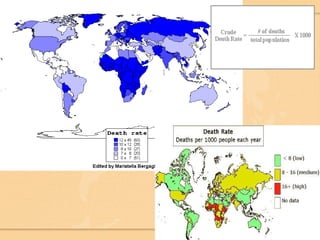
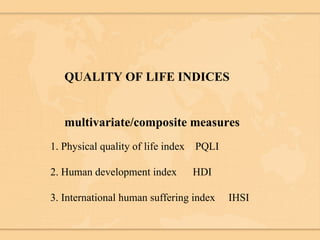
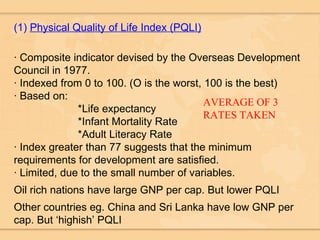
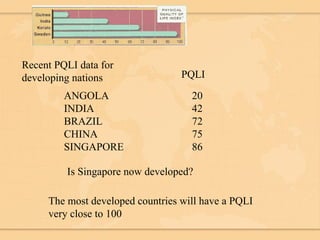
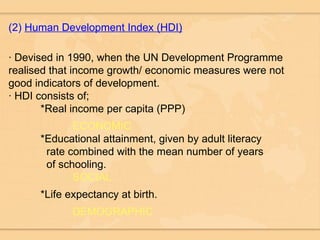
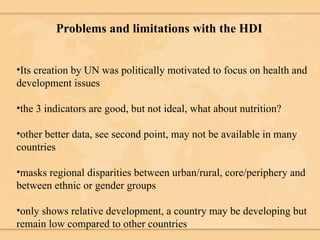
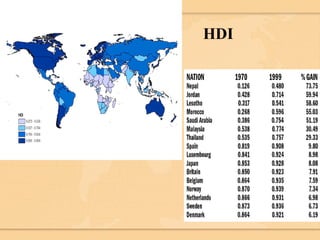
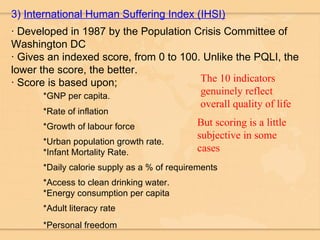
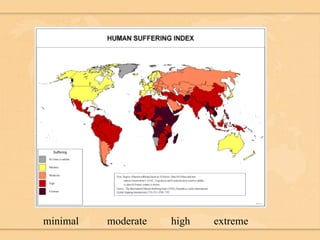
MEASURING DEVELOPMENT how development is measured depends on how it is defined traditionally development was defined as economic growth this led to the  3 worlds model first world, advance or developed capitalist nations second world, advanced or developed socialist nations third world, developing, undeveloped or under-developed nations
TRADITIONAL DEFINITION Traditionally development has been measured by looking at economic criteria this led to the distinction between rich and poor nations,developed and less developed (MEDC vs LEDC ) or after the Brandt report NORTH vs SOUTH with the existence of a Development Gap which it was the job of development to narrow or close
The north south divide
MODERN DEFINITIONS OF DEVELOPMENT A. a modern definition sees development as a process of change allowing basic needs to be met. improving quality of life social justice health well-being education freedom moving from easily quantitative criteria to less easily defined qualitative measures
B. sustainable development using resources in a responsible way, without damaging the opportunity for future generations to satisfy their own needs traditional measures have no place here as economic output or energy used may not signify ‘green’ development sustainable development preserves the quality of the environment sustains traditions customs preserves resources maintains/improves levels of health and education
TRADITIONAL MEASURES OF ECONOMIC DEVELOPMENT 1. GNP (gross national product) per capita / GDP (gross domestic product) per capita 2. purchasing power parity per capita 3. energy consumption 4. workforce engaged in agriculture / manufacturing /service sectors
1. GNP per capita  / GDP per capita GNP is defined as the total value of a countries economic production in one year calculated per capita to eliminate differences in the populations of countries to include production of food/goods provision of services profits from overseas investments money earned in the country by foreigners and foreign businesses
This allowed countries to be classified according to income high income countries (MEDC’s) low income countries (LEDC’s) middle income countries (including the NIC’s, the newly industrialised countries this economic growth and development was expected to trickle down to the poorer countries whose GNP would subsequently improve
 
PROBLEMS WITH USING MONEY UNITS TO ASSESS DEVELOPMENT 1. Real value of a currency can change over short periods, so US dollar is used, conversion creates distortions due to inflation 2. Does not reflect the actual purchasing power of a currency within a country (costs vary country to country) 3. Much output does not enter international trade 4. Socialist countries may have different definitions of national income 5. High local costs due to cold winters or the size of a country eg. Russia lead to problems due to money spent on clothes, heating and transport 6. GNP gives no indication of how money/wealth is distributed within a country. A rising GNP may show a country is wealthier while the poorest citizens remain extremely poor
2. PURCHASING POWER PARITY PER CAPITA Introduced by the world bank to over come problems with GNP measures takes into account the cost of living in a country gives a truer indication of living standards and the wealth of individuals still uses US dollar highlights areas of HIGH, MIDDLE and LOW purchasing power US 41,000 dollars UK 29,000 dollars S KOREA 19,000 dollars KENYA 1,000 dollars
 
3. ENERGY CONSUMPTION per capita energy is a common economic measure of development it is a rough guide to the degree of industrialisation of a country and how far along Rostows stages of development a country has moved industrialised countries can use 10 times more energy than non industrialised countries can be kilowatt hours of electricity per capita or measured as a coal equivalent figure
 
4. WORKFORCE ENGAGED IN AGRICULTURE the percentage of the population engaged in each of the sectors of employment give an indication of levels of development this is shown in the Clarke-Fisher model LEDC’s have a large percentage employed in the primary sector, particularly farming as a country develops and industrialises the percentage employed in the secondary/manufacturing sectors will increases as will industrial output the MEDC’s will have the highest percentage employed in the service/tertiary sectors as only they can afford so many ‘non producers’
DEMOGRAPHIC MEASURES 1. Crude birth rate 2. Crude death rate 3. Natural increase (growth rate) 4. Infant mortality rate 5. Fertility rate 6. Life expectancy 7. % under 15 years (structure of the population) CAN BE ILLUSTRATED BY:- Demographic transition model population pyramids
 
 
Natural increase birth rate - death rate expressed as a %
 
LIFE EXPECTANCY
QUALITY OF LIFE INDICES multivariate/composite measures 1. Physical quality of life index  PQLI 2. Human development index  HDI 3. International human suffering index  IHSI
(1)  Physical Quality of Life Index (PQLI) · Composite indicator devised by the Overseas Development Council in 1977. · Indexed from 0 to 100. (O is the worst, 100 is the best) · Based on:   *Life expectancy *Infant Mortality Rate   *Adult Literacy Rate · Index greater than 77 suggests that the minimum requirements for development are satisfied. · Limited, due to the small number of variables.  Oil rich nations have large GNP per cap. But lower PQLI Other countries eg. China and Sri Lanka have low GNP per cap. But ‘highish’ PQLI AVERAGE OF 3 RATES TAKEN
ANGOLA 20 INDIA 42 BRAZIL  72 CHINA 75 SINGAPORE 86 PQLI Recent PQLI data for developing nations The most developed countries will have a PQLI very close to 100 Is Singapore now developed?
(2)  Human Development Index (HDI) · Devised in 1990, when the UN Development Programme realised that income growth/ economic measures were not  good indicators of development. · HDI consists of; *Real income per capita (PPP) ECONOMIC *Educational attainment, given by adult literacy    rate combined with the mean number of years    of schooling. SOCIAL *Life expectancy at birth. DEMOGRAPHIC
Problems and limitations with the HDI Its creation by UN was politically motivated to focus on health and development issues the 3 indicators are good, but not ideal, what about nutrition? other better data, see second point, may not be available in many countries masks regional disparities between urban/rural, core/periphery and between ethnic or gender groups only shows relative development, a country may be developing but remain low compared to other countries
HDI
3)  International Human Suffering Index (IHSI) · Developed in 1987 by the Population Crisis Committee of Washington DC · Gives an indexed score, from 0 to 100. Unlike the PQLI, the lower the score, the better. · Score is based upon; *GNP per capita.  *Rate of inflation  *Growth of labour force *Urban population growth rate. *Infant Mortality Rate.  *Daily calorie supply as a % of requirements *Access to clean drinking water. *Energy consumption per capita *Adult literacy rate *Personal freedom   The 10 indicators genuinely reflect overall quality of life But scoring is a little subjective in some cases
minimal moderate high   extreme
The Problems With Indicators of Social Development. · They do not accurately reflect the inequalities within the given  set. They do not reflect income distribution.  · There is still a lack of agreement on a universal system of measuring social development. Some indicators change daily, e.g. freedom of speech, right to vote, political freedom, etc. · The other problem is associated with the collection of data, for some of the following reasons; *Very few census surveys take place in LEDCs. *Registration is inadequate and unrepresentative.  *Only the better educated, wealthier people can    understand the registration procedures. *Refusal to fill in forms for political or personal    reasons.
· Reasons for an unreliable census ; * Too costly for some LEDC’s. * Incomplete mapping. * Lack of trained staff. * Hard to record nomadic peoples. * Transport difficulties. * Male staff unable to interview women in the Middle East and Indian subcontinent, due to cultural differences. * Language (regional dialects) difficulties. * Low literacy levels. * They can be adapted to portray something entirely  different for political reasons.

Population Populationdevelopment

  • 1.
    MEASURING DEVELOPMENT howdevelopment is measured depends on how it is defined traditionally development was defined as economic growth this led to the 3 worlds model first world, advance or developed capitalist nations second world, advanced or developed socialist nations third world, developing, undeveloped or under-developed nations
  • 2.
    TRADITIONAL DEFINITION Traditionallydevelopment has been measured by looking at economic criteria this led to the distinction between rich and poor nations,developed and less developed (MEDC vs LEDC ) or after the Brandt report NORTH vs SOUTH with the existence of a Development Gap which it was the job of development to narrow or close
  • 3.
  • 4.
    MODERN DEFINITIONS OFDEVELOPMENT A. a modern definition sees development as a process of change allowing basic needs to be met. improving quality of life social justice health well-being education freedom moving from easily quantitative criteria to less easily defined qualitative measures
  • 5.
    B. sustainable developmentusing resources in a responsible way, without damaging the opportunity for future generations to satisfy their own needs traditional measures have no place here as economic output or energy used may not signify ‘green’ development sustainable development preserves the quality of the environment sustains traditions customs preserves resources maintains/improves levels of health and education
  • 6.
    TRADITIONAL MEASURES OFECONOMIC DEVELOPMENT 1. GNP (gross national product) per capita / GDP (gross domestic product) per capita 2. purchasing power parity per capita 3. energy consumption 4. workforce engaged in agriculture / manufacturing /service sectors
  • 7.
    1. GNP percapita / GDP per capita GNP is defined as the total value of a countries economic production in one year calculated per capita to eliminate differences in the populations of countries to include production of food/goods provision of services profits from overseas investments money earned in the country by foreigners and foreign businesses
  • 8.
    This allowed countriesto be classified according to income high income countries (MEDC’s) low income countries (LEDC’s) middle income countries (including the NIC’s, the newly industrialised countries this economic growth and development was expected to trickle down to the poorer countries whose GNP would subsequently improve
  • 9.
  • 10.
    PROBLEMS WITH USINGMONEY UNITS TO ASSESS DEVELOPMENT 1. Real value of a currency can change over short periods, so US dollar is used, conversion creates distortions due to inflation 2. Does not reflect the actual purchasing power of a currency within a country (costs vary country to country) 3. Much output does not enter international trade 4. Socialist countries may have different definitions of national income 5. High local costs due to cold winters or the size of a country eg. Russia lead to problems due to money spent on clothes, heating and transport 6. GNP gives no indication of how money/wealth is distributed within a country. A rising GNP may show a country is wealthier while the poorest citizens remain extremely poor
  • 11.
    2. PURCHASING POWERPARITY PER CAPITA Introduced by the world bank to over come problems with GNP measures takes into account the cost of living in a country gives a truer indication of living standards and the wealth of individuals still uses US dollar highlights areas of HIGH, MIDDLE and LOW purchasing power US 41,000 dollars UK 29,000 dollars S KOREA 19,000 dollars KENYA 1,000 dollars
  • 12.
  • 13.
    3. ENERGY CONSUMPTIONper capita energy is a common economic measure of development it is a rough guide to the degree of industrialisation of a country and how far along Rostows stages of development a country has moved industrialised countries can use 10 times more energy than non industrialised countries can be kilowatt hours of electricity per capita or measured as a coal equivalent figure
  • 14.
  • 15.
    4. WORKFORCE ENGAGEDIN AGRICULTURE the percentage of the population engaged in each of the sectors of employment give an indication of levels of development this is shown in the Clarke-Fisher model LEDC’s have a large percentage employed in the primary sector, particularly farming as a country develops and industrialises the percentage employed in the secondary/manufacturing sectors will increases as will industrial output the MEDC’s will have the highest percentage employed in the service/tertiary sectors as only they can afford so many ‘non producers’
  • 16.
    DEMOGRAPHIC MEASURES 1.Crude birth rate 2. Crude death rate 3. Natural increase (growth rate) 4. Infant mortality rate 5. Fertility rate 6. Life expectancy 7. % under 15 years (structure of the population) CAN BE ILLUSTRATED BY:- Demographic transition model population pyramids
  • 17.
  • 18.
  • 19.
    Natural increase birthrate - death rate expressed as a %
  • 20.
  • 21.
  • 22.
    QUALITY OF LIFEINDICES multivariate/composite measures 1. Physical quality of life index PQLI 2. Human development index HDI 3. International human suffering index IHSI
  • 23.
    (1) PhysicalQuality of Life Index (PQLI) · Composite indicator devised by the Overseas Development Council in 1977. · Indexed from 0 to 100. (O is the worst, 100 is the best) · Based on: *Life expectancy *Infant Mortality Rate *Adult Literacy Rate · Index greater than 77 suggests that the minimum requirements for development are satisfied. · Limited, due to the small number of variables. Oil rich nations have large GNP per cap. But lower PQLI Other countries eg. China and Sri Lanka have low GNP per cap. But ‘highish’ PQLI AVERAGE OF 3 RATES TAKEN
  • 24.
    ANGOLA 20 INDIA42 BRAZIL 72 CHINA 75 SINGAPORE 86 PQLI Recent PQLI data for developing nations The most developed countries will have a PQLI very close to 100 Is Singapore now developed?
  • 25.
    (2) HumanDevelopment Index (HDI) · Devised in 1990, when the UN Development Programme realised that income growth/ economic measures were not good indicators of development. · HDI consists of; *Real income per capita (PPP) ECONOMIC *Educational attainment, given by adult literacy rate combined with the mean number of years of schooling. SOCIAL *Life expectancy at birth. DEMOGRAPHIC
  • 26.
    Problems and limitationswith the HDI Its creation by UN was politically motivated to focus on health and development issues the 3 indicators are good, but not ideal, what about nutrition? other better data, see second point, may not be available in many countries masks regional disparities between urban/rural, core/periphery and between ethnic or gender groups only shows relative development, a country may be developing but remain low compared to other countries
  • 27.
  • 28.
    3) InternationalHuman Suffering Index (IHSI) · Developed in 1987 by the Population Crisis Committee of Washington DC · Gives an indexed score, from 0 to 100. Unlike the PQLI, the lower the score, the better. · Score is based upon; *GNP per capita. *Rate of inflation *Growth of labour force *Urban population growth rate. *Infant Mortality Rate. *Daily calorie supply as a % of requirements *Access to clean drinking water. *Energy consumption per capita *Adult literacy rate *Personal freedom The 10 indicators genuinely reflect overall quality of life But scoring is a little subjective in some cases
  • 29.
  • 30.
    The Problems WithIndicators of Social Development. · They do not accurately reflect the inequalities within the given set. They do not reflect income distribution. · There is still a lack of agreement on a universal system of measuring social development. Some indicators change daily, e.g. freedom of speech, right to vote, political freedom, etc. · The other problem is associated with the collection of data, for some of the following reasons; *Very few census surveys take place in LEDCs. *Registration is inadequate and unrepresentative. *Only the better educated, wealthier people can understand the registration procedures. *Refusal to fill in forms for political or personal reasons.
  • 31.
    · Reasons foran unreliable census ; * Too costly for some LEDC’s. * Incomplete mapping. * Lack of trained staff. * Hard to record nomadic peoples. * Transport difficulties. * Male staff unable to interview women in the Middle East and Indian subcontinent, due to cultural differences. * Language (regional dialects) difficulties. * Low literacy levels. * They can be adapted to portray something entirely different for political reasons.