Downloaded 267 times
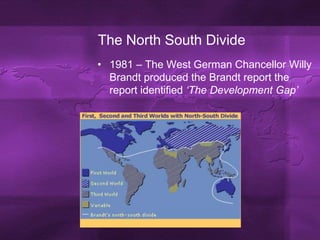
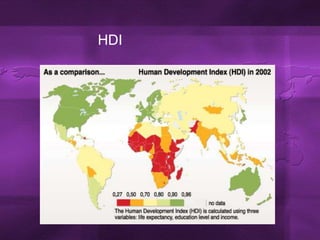


This document discusses different ways to measure the development gap between wealthy and poor countries. It begins by introducing the "Brandt line" from 1981, which showed that the global North possessed 80% of the world's wealth while the South had only 20%. However, this simple division is outdated as some countries have developed faster than others. The document then examines common economic indicators like GDP and GNI, as well as the Human Development Index (HDI), which provides a more holistic picture of health, education, and living standards. While measures provide useful comparisons, development has been uneven globally, and some regions like Sub-Saharan Africa still lag far behind in growth.


![[SARMIENTO] Development and Wealth POERPOINT PRESENTATION.pptx](https://cdn.slidesharecdn.com/ss_thumbnails/sarmientodevelopmentandwealth-250619220032-2382b709-thumbnail.jpg?width=640&height=640&fit=bounds)


