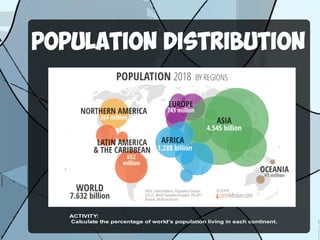
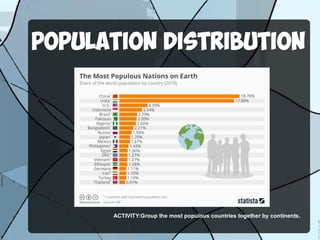
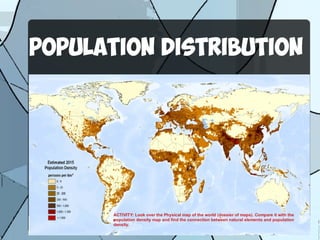
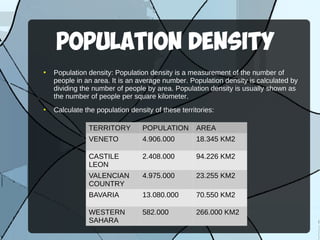
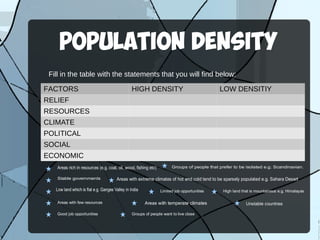
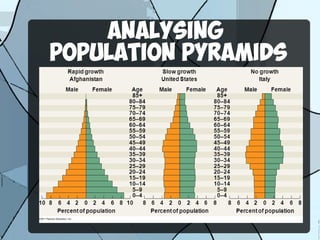
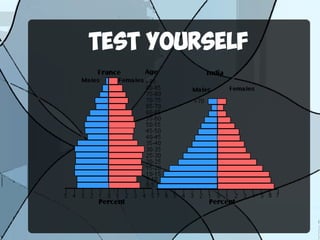
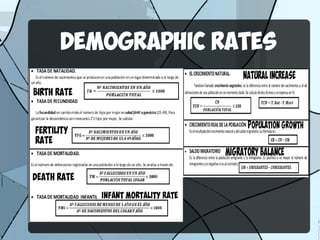
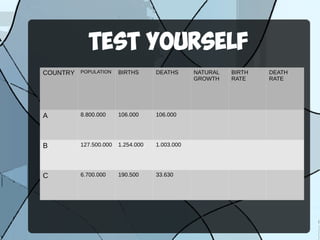
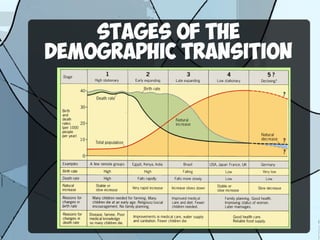
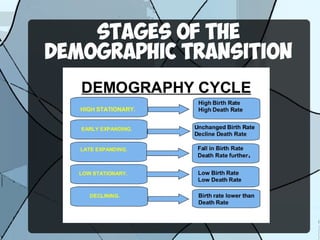
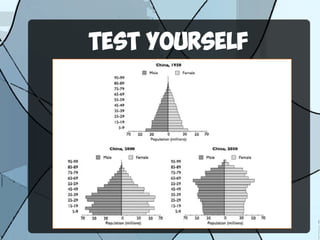
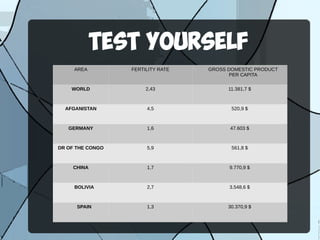
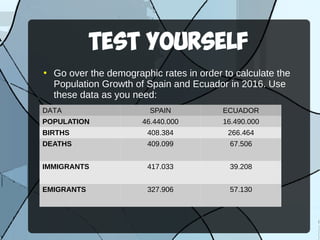
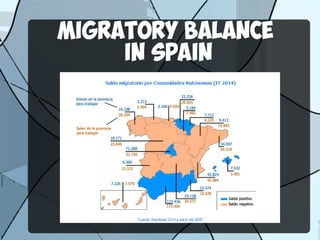
POPULATION GEOGRAPHY
CONTENTS
●
Population distribution
●
Population structure and population
pyramids
●
Demographic rates
●
Stages of the demographic transition
●
The world population explosion
●
Migrations
PRELIMINARY MAP:
WORLD REGIONS
POPULATION DISTRIBUTION
ACTIVITY:
Calculate the percentage of world’s population living in each continent.
POPULATION DISTRIBUTION
ACTIVITY:Group the most populous countries together by continents.
POPULATION DISTRIBUTION
ACTIVITY: Look over the Physical map of the world (dossier of maps). Compare it with the
population density map and find the connection between natural elements and population
density.
POPULATION density
●
Population density: Population density is a measurement of the number of
people in an area. It is an average number. Population density is calculated by
dividing the number of people by area. Population density is usually shown as
the number of people per square kilometer.
●
Calculate the population density of these territories:
TERRITORY POPULATION AREA
VENETO 4.906.000 18.345 KM2
CASTILE
LEON
2.408.000 94.226 KM2
VALENCIAN
COUNTRY
4.975.000 23.255 KM2
BAVARIA 13.080.000 70.550 KM2
WESTERN
SAHARA
582.000 266.000 KM2
POPULATION DENSITY
FACTORS HIGH DENSITY LOW DENSITIY
RELIEF
RESOURCES
CLIMATE
POLITICAL
SOCIAL
ECONOMIC
Fill in the table with the statements that you will find below:
Low land which is flat e.g. Ganges Valley in India
Areas rich in resources (e.g. coal, oil, wood, fishing etc)
Areas with extreme climates of hot and cold tend to be sparsely populated e.g. Sahara DesertStable governments
Groups of people that prefer to be isolated e.g. Scandinavian.
Limited job opportunities High land that is mountainous e.g. Himalayas
Areas with few resources Areas with temperate climates Unstable countries
Good job opportunities Groups of people want to live close
POPULATION STRUCTURE
Biological structure (sex and age): More males than females in the young
population and more females than men in the eldery population.
Economic structure (activity): Active (16-65) and inactive population (young
and old dependents).
POPULATION PYRAMIDS
ANALYSING
POPULATION PYRAMIDS
ANALYSING
POPULATION PYRAMIDS
ANALYSING
POPULATION PYRAMIDS
TEST YOURSELF
DEMOGRAPHIC RATES
TEST YOURSELF
COUNTRY POPULATION BIRTHS DEATHS NATURAL
GROWTH
BIRTH
RATE
DEATH
RATE
A 8.800.000 106.000 106.000
B 127.500.000 1.254.000 1.003.000
C 6.700.000 190.500 33.630
STAGES OF THE
DEMOGRAPHIC TRANSITION
STAGES OF THE
DEMOGRAPHIC TRANSITION
TEST YOURSELF
TEST YOURSELF
AREA FERTILITY RATE GROSS DOMESTIC PRODUCT
PER CAPITA
WORLD 2,43 11.381,7 $
AFGANISTAN 4,5 520,9 $
GERMANY 1,6 47.603 $
DR OF THE CONGO 5,9 561,8 $
CHINA 1,7 9.770,9 $
BOLIVIA 2,7 3.548,6 $
SPAIN 1,3 30.370,9 $
THE WORLD POPULATION
EXPLOSION
DRAW YOUR OWN
CONCLUSION
DRAW YOUR OWN
CONCLUSION
DRAW YOUR OWN
CONCLUSION
DRAW YOUR OWN
CONCLUSION
DRAW YOUR OWN
CONCLUSION
Migrations
FOREIGN Migrations
IN SPAIN
TEST YOURSELF
●
Go over the demographic rates in order to calculate the
Population Growth of Spain and Ecuador in 2016. Use
these data as you need:
DATA SPAIN ECUADOR
POPULATION 46.440.000 16.490.000
BIRTHS 408.384 266.464
DEATHS 409.099 67.506
IMMIGRANTS 417.033 39.208
EMIGRANTS 327.906 57.130
Migratory balance
in Spain
THAT S ALL FOLKS?’

Population Geography